



Table of contents
The average Google Ads click-through rate in 2026 is 6.64%, and for the first time in five years the average cost per lead has actually gone down, to $66.69. Read on its own, a CTR number tells you almost nothing about account health - this page lines it up against the CPC and CPL it actually produces, across Search, Meta and LinkedIn.
Key Takeaways
- Average Google Ads CTR is 6.64% in 2026, across all industries.
- Average Google Ads CPC is $5.42, more than double the 2016 figure.
- Average cost per lead is $66.69, down for the first time in five years.
- Average conversion rate is 8.18% across Google Ads accounts.
- Conversion rate rose in 87% of industries year over year.
- Arts & Entertainment has the highest search CTR, at 12.75%.
- Finance & Insurance follows at 9.83% CTR.
- Automotive Repair, Service & Parts has the lowest CTR, at 5.56%.
- Education & Instruction CTR rose 31.71% year over year, the biggest gain.
- Health & Fitness CTR fell 19.08% year over year, the biggest drop.
- Meta traffic CTR rose 12.87% to 1.93% in one 2026 analysis.
- Meta CPC fell 14.29% to $0.60 over the same period.
- Meta CTR benchmarks generally run 1.4% to 2.2% across sources.
- LinkedIn CPC runs roughly $7 to $15 depending on industry.
- LinkedIn CPL commonly lands between $70 and $250 by industry.
The 2026 Google Search baseline
WordStream's 2026 Google Ads Benchmarks report puts the average click-through rate across all industries at 6.64%, average cost per click at $5.42, average conversion rate at 8.18%, and - the standout finding - average cost per lead at $66.69, the first year-over-year CPL decrease the report has recorded in five years. For context on where costs have gone: CPC is more than double what it was 10 years ago ($2.32 in 2016 versus $5.42 in 2026), while CPL has risen a comparatively modest 13% over the same decade ($59.18 to $66.69).
| 2026 Google Ads metric (all industries) | Average | YoY direction |
|---|---|---|
| Click-through rate (CTR) | 6.64% | Broadly stable |
| Cost per click (CPC) | $5.42 | Up modestly |
| Conversion rate (CVR) | 8.18% | Up in 87% of industries |
| Cost per lead (CPL) | $66.69 | Down for the first time in 5 years |
CTR by industry: the spread that hides inside the average
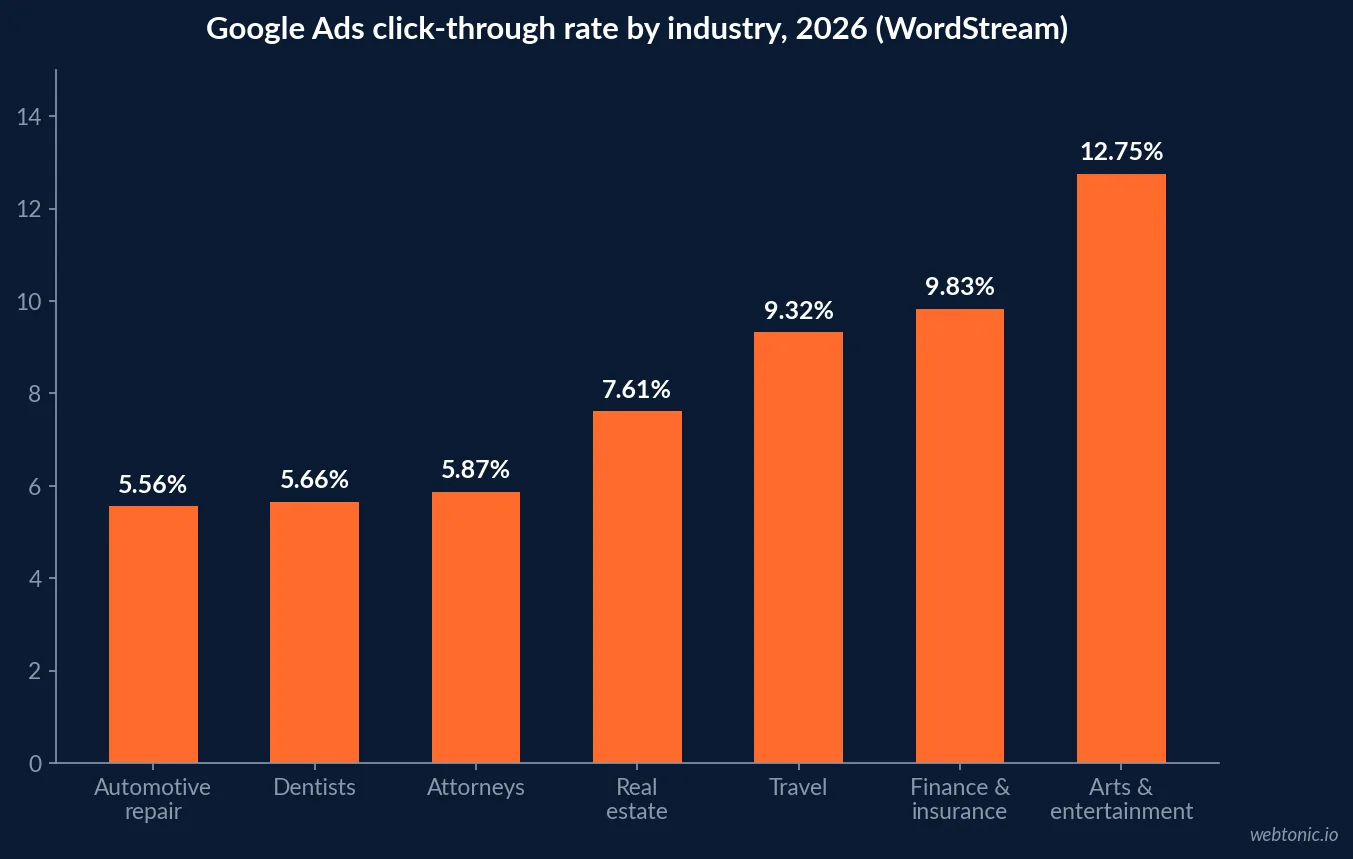
The 6.64% average masks a wide industry spread. Arts & Entertainment leads at 12.75%, followed by Finance & Insurance at 9.83% and Travel at 9.32%. At the other end, Automotive Repair, Service & Parts sits lowest at 5.56%, just ahead of Dentists & Dental Services (5.66%) and Health & Fitness (5.81%). A CTR that looks "low" against the blended average may be perfectly healthy for a naturally lower-CTR category - the comparison that matters is against your own industry row, not the cross-industry blend.
| Industry | Avg CTR 2026 | Avg CPC 2026 |
|---|---|---|
| Arts & Entertainment | 12.75% | $1.63 |
| Finance & Insurance | 9.83% | $3.39 |
| Travel | 9.32% | — |
| Real Estate | 7.61% | — |
| Attorneys & Legal Services | 5.87% | $9.87 |
| Dentists & Dental Services | 5.66% | $8.00 |
| Automotive — Repair, Service & Parts | 5.56% | $4.35 |
Where CTR moved the most, year over year
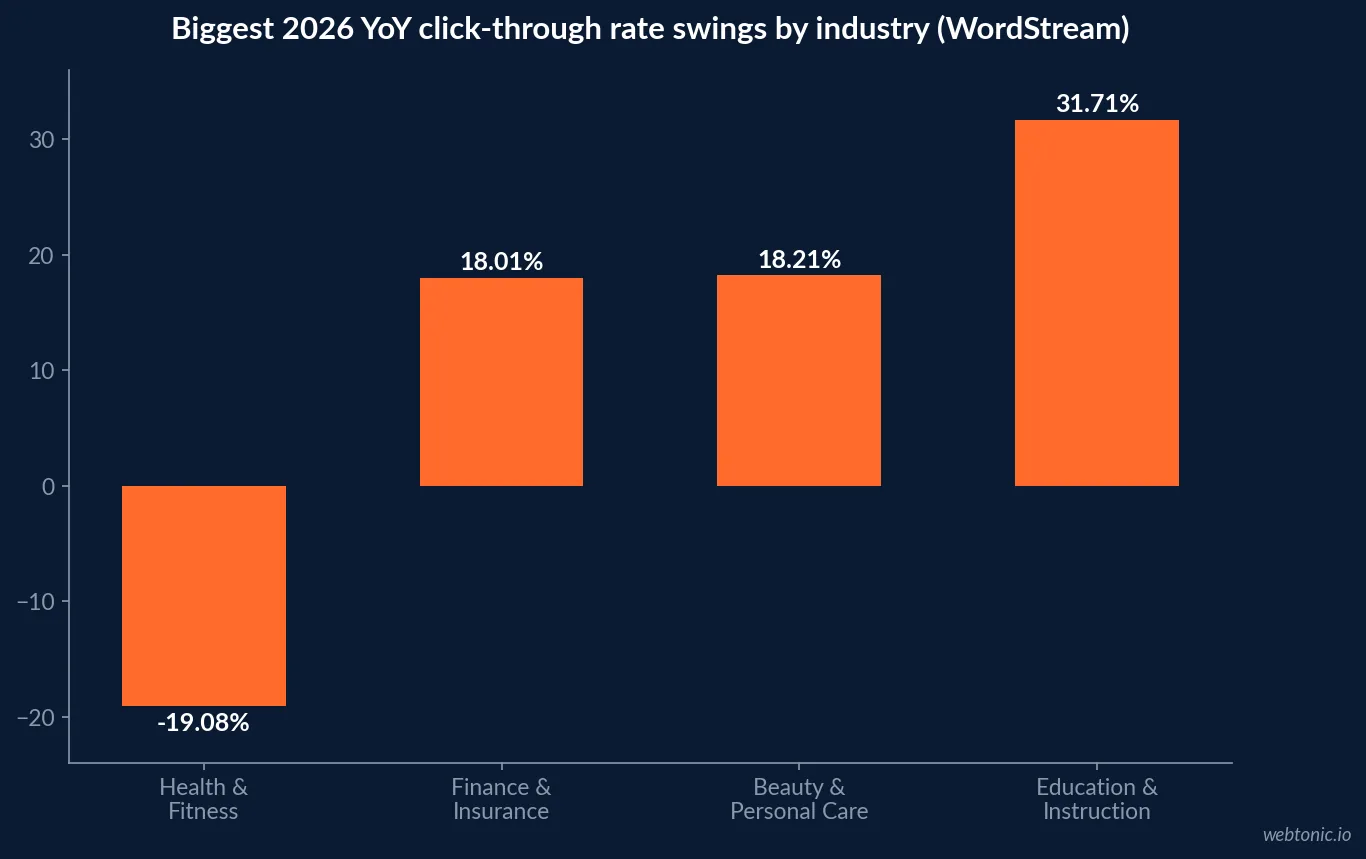
WordStream attributes 2026's biggest CTR gains to platform optimization tooling reaching more accounts: Education & Instruction rose 31.71%, Beauty & Personal Care rose 18.21%, and Finance & Insurance rose 18.01%. The steepest fall was Health & Fitness, down 19.08%, alongside declines in Career & Employment. A category swinging double digits year over year is a signal to re-check ad copy and audience targeting before assuming a platform-wide algorithm shift is to blame.
How Meta's CTR and CPC compare
Meta ads are served into a feed rather than a search result, so CTR benchmarks run structurally lower than search. One 2026 analysis reported by Search Engine Land found traffic-objective CTR rising 12.87% year over year to 1.93%, while CPC fell 14.29% to $0.60 over the same period. A separate 2026 benchmark compilation puts the broader healthy range at 1.4% to 2.2% for CTR, with CPC closer to $0.70 for traffic campaigns and roughly $1.92 for lead-gen objectives - the objective you optimize for changes both numbers substantially, which search benchmarks don't need to account for in the same way.
| Meta Ads metric (2026) | Reported figure | Notes |
|---|---|---|
| Traffic CTR | 1.93% | Up 12.87% YoY, one analysis |
| Traffic CPC | $0.60 | Down 14.29% YoY, same analysis |
| General CTR range | 1.4%-2.2% | Compiled across sources |
| Traffic-objective CPC | ≈$0.70 | Compiled across sources |
| Lead-gen objective CPC | ≈$1.92 | Compiled across sources |
What moved conversion rate while CPC held steady
The most counter-intuitive 2026 finding in WordStream's data is that conversion rate rose for 87% of industries even as CPC stayed roughly flat and CTR barely moved. That combination usually means the demand side improved - buyers converting at a higher rate once they land - rather than the ad side. Automated bidding and asset-generation tooling reaching more of the account base is the most likely driver WordStream itself points to, since the accounts benefiting most were the ones already using Smart Bidding and AI-assisted creative tools rather than manual campaigns.
The practical read for an account manager: if your CTR is flat but your CPL just moved, don't assume the ad is the problem. Check the landing page and offer first, since that is where 2026's conversion-rate gains are concentrated.
Where LinkedIn fits for B2B
LinkedIn's CTR runs lower than both Search and Meta almost by design - it charges a premium for precision, not volume. Kiin Labs' 2026 LinkedIn benchmark set, built across more than 100 industry rows, puts cost per lead as low as roughly $90 in healthcare-adjacent categories and as high as $300-plus in retail, with cost per click generally running $7 to $15 depending on vertical. That combination only pencils out against a deal size large enough to absorb it, which is why LinkedIn benchmark tables are built by industry and job function rather than a single blended average the way Google's are.
The takeaway across all three platforms: CTR is the top of a chain that ends in CPL, and the platform that wins on CTR alone (Search, typically) is not automatically the platform that wins on cost per qualified lead once conversion rate and deal size are factored in.
| Platform | Typical CTR range, 2026 | Typical CPC range | Best fit |
|---|---|---|---|
| Google Search | 5.6% - 12.8% by industry | $1.63 - $9.87 | High-intent, bottom-of-funnel queries |
| Meta feed | 1.4% - 2.2% | $0.60 - $1.92 | Interruption-based demand generation |
| 0.4% - 0.7% typical | $7 - $15 | High-ACV B2B, precise job-title targeting |
Putting the three platforms in one media plan
None of this argues for picking one platform over the other two - it argues for budgeting each against the number it is actually good at. Search wins on CTR and intent; Meta wins on reach and cost efficiency at the top of the funnel; LinkedIn wins on precision when the deal size justifies the premium. If you're deciding how to split a fixed budget across the three, our Google Ads strategy guide and our paid search team can help model that split against your own CPL target rather than a blended industry average.
How to use these benchmarks without over-indexing on them
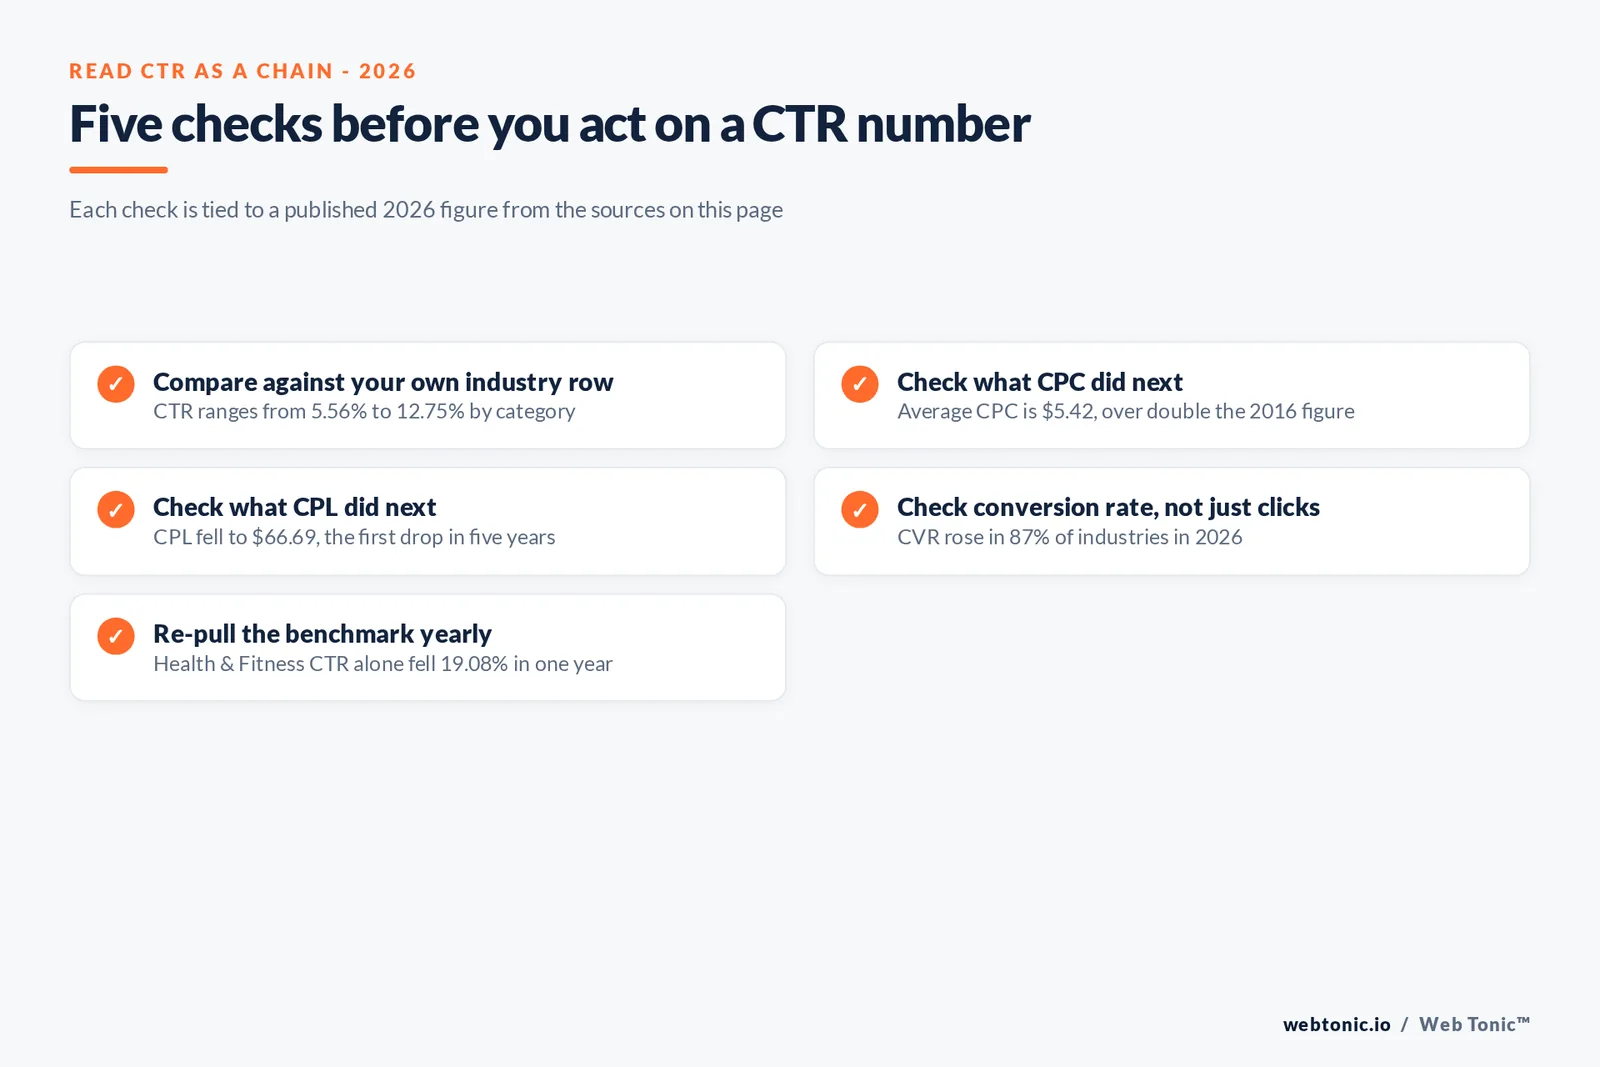
Pull your own trailing-90-day CTR, CPC and CPL by campaign before comparing against any published average, since the reports above are built from each vendor's own client book and will not exactly match your account mix. Then read the three numbers as one chain, not three separate scorecards: a CTR win that doesn't move CPL is a copy test, not a budget decision. Our growth marketing team builds that full-funnel read into every paid search account review.
A five-year view before you set next year's target
WordStream's decade-long tracking gives useful context for setting a realistic internal target: average CPC has more than doubled since 2016 ($2.32 to $5.42), while CPL has risen a comparatively modest 13% over the same window ($59.18 to $66.69). That gap - CPC up over 100%, CPL up 13% - is only possible because conversion rate and CTR both improved enough to absorb most of the cost increase. Setting next year's CPL target purely off this year's CPC trend, without also modelling a conversion-rate improvement, will overstate how much the lead is really going to cost.
Frequently Asked Questions
What is a good click-through rate for Google Ads in 2026?
The 2026 average across all industries is 6.64%, per WordStream's Google Ads benchmarks report, based on client account data. The range by industry is wide: Arts & Entertainment tops the list at 12.75%, Finance & Insurance follows at 9.83%, while Automotive Repair, Service & Parts sits lowest at 5.56%. A CTR below your industry's reported average is worth investigating; one above it is not automatically a win if conversion rate hasn't moved with it.
How does CTR relate to cost per click and cost per lead?
They move together but not proportionally. WordStream's 2026 data puts average Google Ads CPC at $5.42 and average cost per lead at $66.69 - the first CPL decrease the report has recorded in five years. A higher CTR generally lowers CPC through Quality Score, but the conversion rate behind the click decides whether that click ever becomes an affordable lead. The 2026 data shows conversion rate rose for 87% of industries even as CPC held roughly flat.
What's a good CTR on Meta (Facebook and Instagram) ads?
Meta's 2026 numbers run lower than search by design, since Meta is served to people who weren't actively searching. Reported traffic-objective CTR sits around 1.4% to 2.2% depending on the source, with one analysis showing traffic CTR rising 12.87% year over year to 1.93% while CPC fell 14.29% to $0.60. Treat any Meta CTR above roughly 2% on a cold audience as strong.
Why do industry CTR benchmarks vary so much between reports?
Different reports pull from different account bases, campaign types and date windows. WordStream's numbers come from its own managed client accounts; a competing benchmark using a different book of business, more small accounts, or a different mix of Search versus Display traffic will land on different averages even for the same platform and month. Use a benchmark to set direction, not a pass/fail line - and re-pull it each year, since 2026 CPL fell for the first time in five years.
Which industries saw the biggest CTR swings in 2026?
On the upside, Education & Instruction gained 31.71% year over year, followed by Beauty & Personal Care (+18.21%) and Finance & Insurance (+18.01%), per WordStream's 2026 report. On the downside, Health & Fitness fell 19.08% year over year, the steepest drop tracked in that data set.
Sources
WordStream - Google Ads Benchmarks 2026: Competitive Data & Insights for Every Industry
WebFX - 2026 Google Ads Benchmarks: CTR, CPC, CVR, CPA and More
WebFX - What Is a Good CTR? 2026 Industry and Channel Benchmarks
Search Engine Land - Facebook Ad Costs Fall as Traffic and Lead Performance Improves
Visible Factors - Facebook Ads Benchmarks: Performance Analysis 2026
Kiin Labs - LinkedIn Ads Benchmarks 2026: CTR, CPC, CPM, Cost Per Lead


