



Table of contents

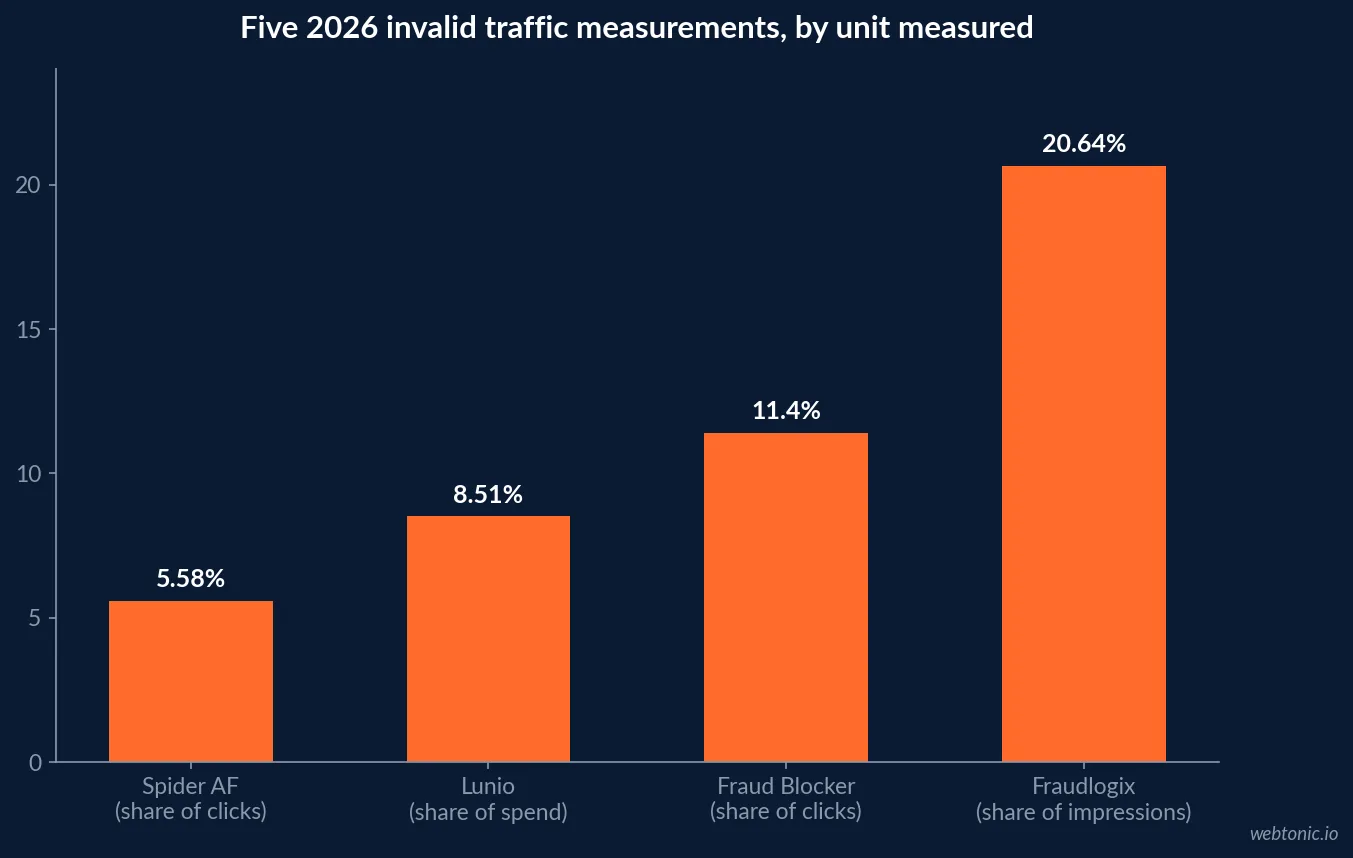
Five independent 2026 measurements of invalid ad traffic land between 5.6% and 20.6% of paid clicks or impressions, depending on what is being measured and how. That spread is not a contradiction - it's a map of where click fraud actually concentrates, and this page lines the five up side by side against the CPA impact each one implies.
Key Takeaways
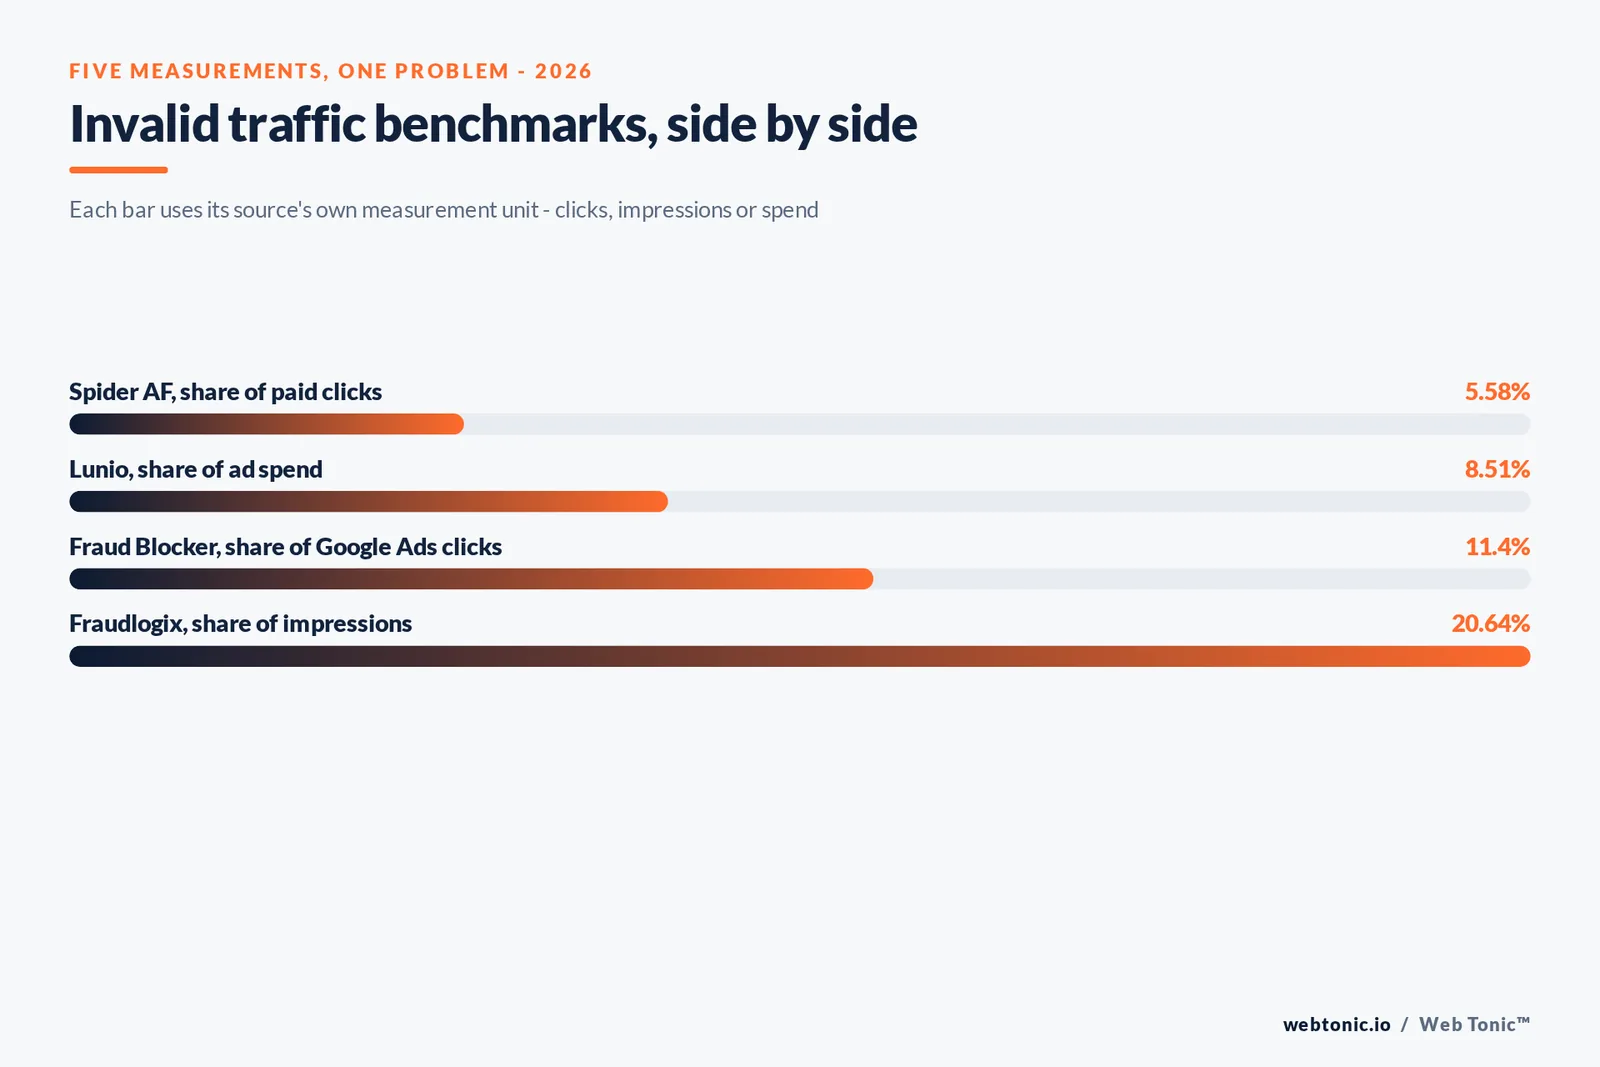
- 8.51% average invalid traffic rate across 2025 global ad spend (Lunio).
- $63 billion lost to invalid traffic in 2025, against $740B+ in ad spend.
- 5.58% of paid clicks were invalid in H1 2026 (Spider AF), up from 4.32% in 2025.
- $25.3 billion in H1 2026 ad spend was exposed to fraudulent traffic risk.
- 20.64% of 105.7 billion impressions showed invalid-traffic risk signals (Fraudlogix).
- Roughly $37 billion in US programmatic spend tied to that exposure.
- 11.4% average invalid click rate across 104 million Google Ads clicks (Fraud Blocker).
- Approximately 80% of invalid clicks are "general" (easy-detect) traffic, per Google.
- Global ad-fraud losses forecast to exceed $100 billion in 2026 (Juniper Research).
- Rising toward $172 billion by 2028.
- 75.6% of marketers lose more than 5% of budget to invalid traffic.
- 48.1% specifically lose between 5% and 10% of monthly performance budget.
- 85.6% are concerned about agentic AI generating invalid traffic.
- Only 5.3% run a dedicated IVT prevention platform.
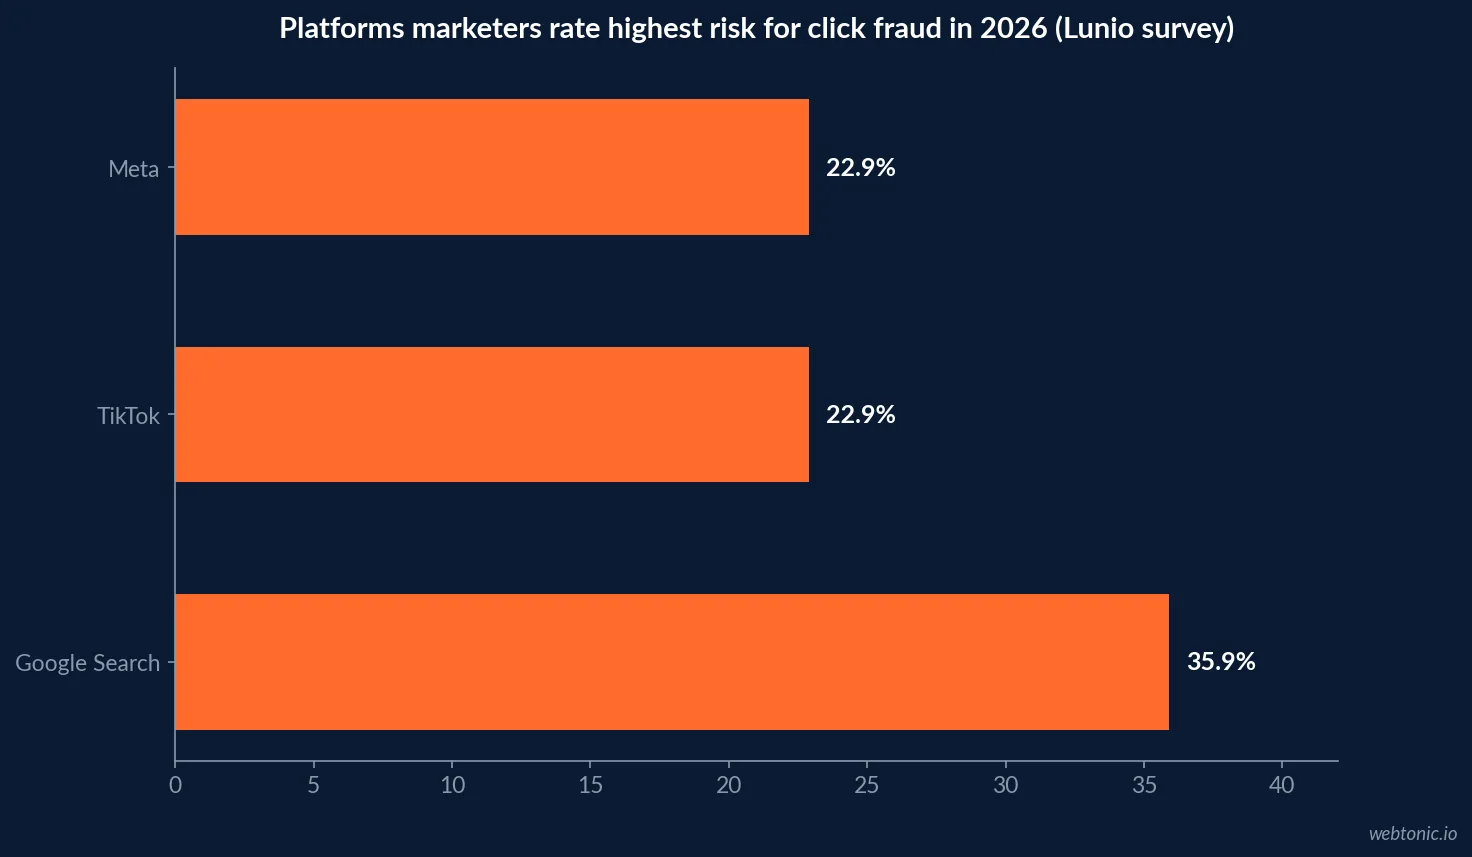
- Google Search rated the highest-risk platform at 35.9%.
- TikTok and Meta tied for second at 22.9% each.
Why five reports give five different numbers
Every invalid-traffic figure in circulation depends on three choices the source makes: what unit it measures (clicks, impressions or spend), which channels it covers, and how conservative its detection threshold is. That's why a benchmark table is more useful than a single headline number - each row below tells you exactly what was counted before you compare it to your own account.
| Source | Unit measured | 2026 (or latest) figure | Scope |
|---|---|---|---|
| Lunio Global IVT Report | Share of ad spend | 8.51% (2025 avg.) | Global, cross-channel |
| Spider AF Ad Fraud Report | Share of paid clicks | 5.58% (H1 2026) | Global, cross-channel |
| Fraudlogix Ad Fraud Stats | Share of impressions | 20.64% | 105.7B impressions, cross-channel |
| Fraud Blocker | Share of Google Ads clicks | 11.4% | 104M clicks, 43,701 accounts |
| Google Ads (own methodology) | Share of filtered invalid clicks | ≈80% "general" IVT | Google Search/Display only |
What it costs in dollars, not just percent
Lunio's Global Invalid Traffic Report applies its 8.51% average rate to a global ad-spend base exceeding $740 billion and arrives at $63 billion lost to invalid traffic in 2025 - a figure it expects to grow further in 2026 as AI agents generate more traffic that looks human at a glance. Fraudlogix's dataset, built from 105.7 billion impressions, separately estimates about $37 billion of US programmatic spend exposed to invalid traffic risk. Both estimates sit below Juniper Research's forecast of global ad-fraud losses exceeding $100 billion in 2026, climbing toward $172 billion by 2028 - Juniper's number is the broadest, covering fraud types the other reports exclude.
| Cost estimate | Figure | Basis | Source |
|---|---|---|---|
| Global invalid-traffic loss, 2025 | $63 billion | 8.51% of $740B+ ad spend | Lunio |
| US programmatic exposure | ≈$37 billion | 20.64% of impressions analyzed | Fraudlogix |
| Global ad-fraud loss forecast, 2026 | $100 billion+ | Cross-channel fraud model | Juniper Research |
| Global ad-fraud loss forecast, 2028 | ≈$172 billion | Cross-channel fraud model | Juniper Research |
| H1 2026 exposed ad spend | ≈$25.3 billion | 5.58% of paid clicks invalid | Spider AF |
Where marketers themselves say the risk sits
Lunio's State of Click Fraud Report 2026, surveying 131 senior marketers in May 2026 (74% brand-side, 26% agency-side), found Google Search rated the highest-risk platform at 35.9%, with TikTok and Meta tied for second at 22.9% each. The same survey found 85.6% of respondents are concerned about agentic AI generating "ghost converters" - non-human interactions that mimic real conversions closely enough to train automated bidding systems toward more of the same fake traffic.
Budget impact reported directly by marketers was blunt: 75.6% estimate losing more than 5% of their monthly performance budget to invalid traffic, and 48.1% put that loss specifically between 5% and 10%. Set against that, only 5.3% currently run a dedicated invalid-traffic prevention platform - the gap between stated concern and actual spend on protection.
What Google's own numbers say
Google's ad policy documentation states that approximately 80% of total invalid click traffic is estimated to be "general invalid traffic" - the more easily detected kind (known bots, crawlers, accidental double-clicks) that Google's systems filter automatically before an advertiser is charged. The remaining roughly 20% is "sophisticated invalid traffic," which Google deliberately does not break out per campaign, stating this is to prevent the data being reverse-engineered to help bad actors evade detection.
Separately, Fraud Blocker's analysis of 104 million clicks across 43,701 Google Ads accounts over a six-month window found an average invalid click rate of 11.4% - which sits between Lunio's spend-based average and Fraudlogix's impression-based figure, consistent with it measuring clicks specifically on one platform rather than cross-channel impressions.
| What Google discloses | Figure | What it means for advertisers |
|---|---|---|
| Share of invalid clicks that are "general" IVT | ≈80% | Auto-filtered before you're charged |
| Share that is "sophisticated" IVT | ≈20% | Harder to detect, not broken out per campaign |
| Reporting granularity offered | Daily filtered clicks per campaign | You see the count, not the type |
| Credits issued for missed invalid activity | Case-by-case | Not a guaranteed refund mechanism |
How to translate this into a CPA conversation
If your reported click-through rate and cost per acquisition both look reasonable but your close rate from paid leads is unusually low compared with organic, invalid traffic is one of the more common explanations - not the only one. Cross-check the platform-reported invalid click column against a third-party detection tool for at least one full month before renegotiating a contract or budget based on suspected fraud alone; the spread between the five figures above shows how easily a single-source number can mislead.
Our growth marketing team builds that verification step into paid search audits before recommending a platform or budget shift, alongside the kind of search strategy review that catches wasted spend before it compounds across a quarter.
How the five reports actually detect invalid traffic
The detection methods behind these numbers matter as much as the headline percentage. Fraud Blocker and Fraudlogix both work from direct platform data - actual clicks or impressions passed through detection rules - while Lunio's IVT rate blends spend-weighted detection across a managed client base, and its separate 2026 survey captures marketer perception rather than measured traffic. Spider AF publishes a click-level rate from its own protected campaigns. None of the five is auditing another's dataset, which is exactly why the numbers should be read as five separate lenses on the same problem rather than five attempts to answer one question.
That also means a business running Search, Meta and TikTok simultaneously should expect its blended invalid-traffic rate to land somewhere inside this range rather than at any single cited figure - which channel dominates spend will pull the blended number toward that channel's own risk profile.
What agentic AI changes about the risk
Every report published in the last six months flags the same new variable: AI agents that browse and click on a user's behalf. Lunio's May 2026 survey found 85.6% of marketers concerned about agentic AI and invalid traffic rates specifically, distinct from the concern about traditional bots. The mechanism is the "ghost converter" problem - an AI agent's interaction can look enough like a real conversion that automated bidding systems learn to target more traffic that resembles it, compounding the exposure rather than diluting it.
This is a genuinely new failure mode for accounts running fully automated bidding strategies, since the feedback loop happens inside the algorithm rather than in a report a human reviews.
| Traditional bot risk | Agentic AI risk (2026) | Why the second is harder to catch |
|---|---|---|
| Static click patterns | Browsing sessions that mimic human pacing | Session-level signals look normal |
| Flagged by IP/device rules | Distributed across residential-like proxies | Rule-based filters miss it |
| Doesn't convert further down funnel | Can complete a full form or micro-conversion | Trains bidding algorithms directly |
| Contained to one campaign | Can appear across Search, Meta and TikTok | Cross-platform, harder to isolate |
What to do with these numbers
Treat the 8.51%-20.64% range as a sizing exercise, not a single target: apply the lower, spend-based figures (Lunio) to budget conversations and the higher, impression-based figures (Fraudlogix) to platform-level risk assessments. Track your own invalid-click column monthly rather than relying on an annual industry average, since Spider AF's own data shows the rate moved nearly a full point in a single year (4.32% to 5.58%). If your paid search spend has grown faster than your qualified-lead volume, revisit the cost breakdown behind that spend alongside your invalid-traffic column, and talk to us if the two numbers don't reconcile.
Frequently Asked Questions
What percentage of paid clicks are fraudulent or invalid in 2026?
It depends which measurement you use, and the spread itself is a finding. Lunio's Global Invalid Traffic Report puts the average 2025 rate at 8.51% of ad spend. Spider AF measured 5.58% of paid clicks as invalid in H1 2026, up from 4.32% in 2025. Fraud Blocker, analyzing 104 million Google Ads clicks directly, found an 11.4% average invalid click rate. Fraudlogix, working from 105.7 billion ad impressions, flagged 20.64% as carrying invalid-traffic risk signals. None of these numbers are wrong; they measure different traffic types (impressions vs. clicks), different channels and different detection thresholds.
How much money does click fraud cost advertisers?
Juniper Research forecasts global ad-fraud losses exceeding $100 billion in 2026 and reaching roughly $172 billion by 2028. Lunio's report ties an 8.51% average invalid-traffic rate to $63 billion lost in 2025 against a $740 billion global ad-spend base. Fraudlogix separately estimates around $37 billion of US programmatic spend was exposed to invalid traffic based on its 2025 dataset.
Does Google filter out invalid clicks automatically?
Yes, and it discloses this at a methodology level without publishing a live percentage per account. Google's own ad policy documentation states that approximately 80% of total invalid click traffic is estimated to be 'general invalid traffic' - the more easily detected kind, filtered automatically before an advertiser is charged. The remaining share is 'sophisticated invalid traffic,' which Google intentionally does not break out by campaign to avoid letting bad actors reverse-engineer its detection thresholds.
Which ad platforms do marketers see as the highest click fraud risk?
Google Search, by a clear margin. Lunio's May 2026 survey of 131 senior marketers found Google Search rated the highest-risk platform for click fraud at 35.9%, with TikTok and Meta tied for second at 22.9% each. The same survey found 85.6% of marketers are specifically concerned about agentic AI generating invalid traffic that mimics real conversions.
How much of a performance budget is typically lost to invalid traffic?
Most marketers surveyed think it's more than they'd like: Lunio's 2026 survey found 75.6% of senior marketers estimate losing more than 5% of their monthly performance budget to invalid traffic, and 48.1% put that loss specifically in the 5-10% range. Only 5.3% of the same group currently run a dedicated invalid-traffic prevention platform, which is the gap between the concern and the spend protecting against it.
Sources
Lunio - Global Invalid Traffic Report 2026
Lunio - The State of Click Fraud Report 2026
Spider AF - Ad Fraud Investigation Report, H1 2026
Fraudlogix - Ad Fraud Statistics 2026
Fraud Blocker - Invalid Click Rate: Averages and Benchmarks for Google Ads
Google Ads Policy Help - Invalid Click Activity Methodology
Juniper Research - Quantifying the Cost of Ad Fraud, 2023-2028


