



Table of contents
Buy now, pay later drove $20 billion in US online holiday spend in 2025, up 9.8% year over year, and 16% of all US adults used it at least once that year. For a retailer, the question is not whether BNPL is popular - it clearly is - but whether the order value it adds and the checkout conversion it protects outweigh the merchant discount fee.
Key Takeaways
- $20 billion in US BNPL holiday spend in 2025, up 9.8% YoY.
- Cyber Monday BNPL spend crossed $1 billion for the first time, up 4.2% YoY.
- 82.2% of BNPL purchases now happen on a smartphone.
- 16% of all US adults used BNPL in 2025, up every year since 2021.
- Nearly 1 in 5 women used BNPL in the prior year, more than men.
- 49% of BNPL users bought clothing or accessories with it.
- 31% of adults with under $100 in emergency savings used BNPL, versus 8% with $2,000-plus.
- 15% of active cardholders used BNPL in Q2 2026, per Consumer Edge.
- 23% of renters used BNPL versus 13% of homeowners.
- Under-$40,000 earners were the only income tier to accelerate adoption in Q2 2026.
- 4.1% of BNPL loans were assessed a late fee in the CFPB's latest report, down from 5.2%.
- Late fee revenue fell to 0.18% of origination volume, from 0.24% in 2022.
- The BNPL charge-off rate fell from 2.63% (2022) to 1.83% (2023).
- Charged-off debt as a share of transaction value fell to 0.92%, from 1.71%.
- 21.5% of 25-34 year-olds use BNPL, versus roughly 7% of those over 65.
How much volume BNPL actually moves
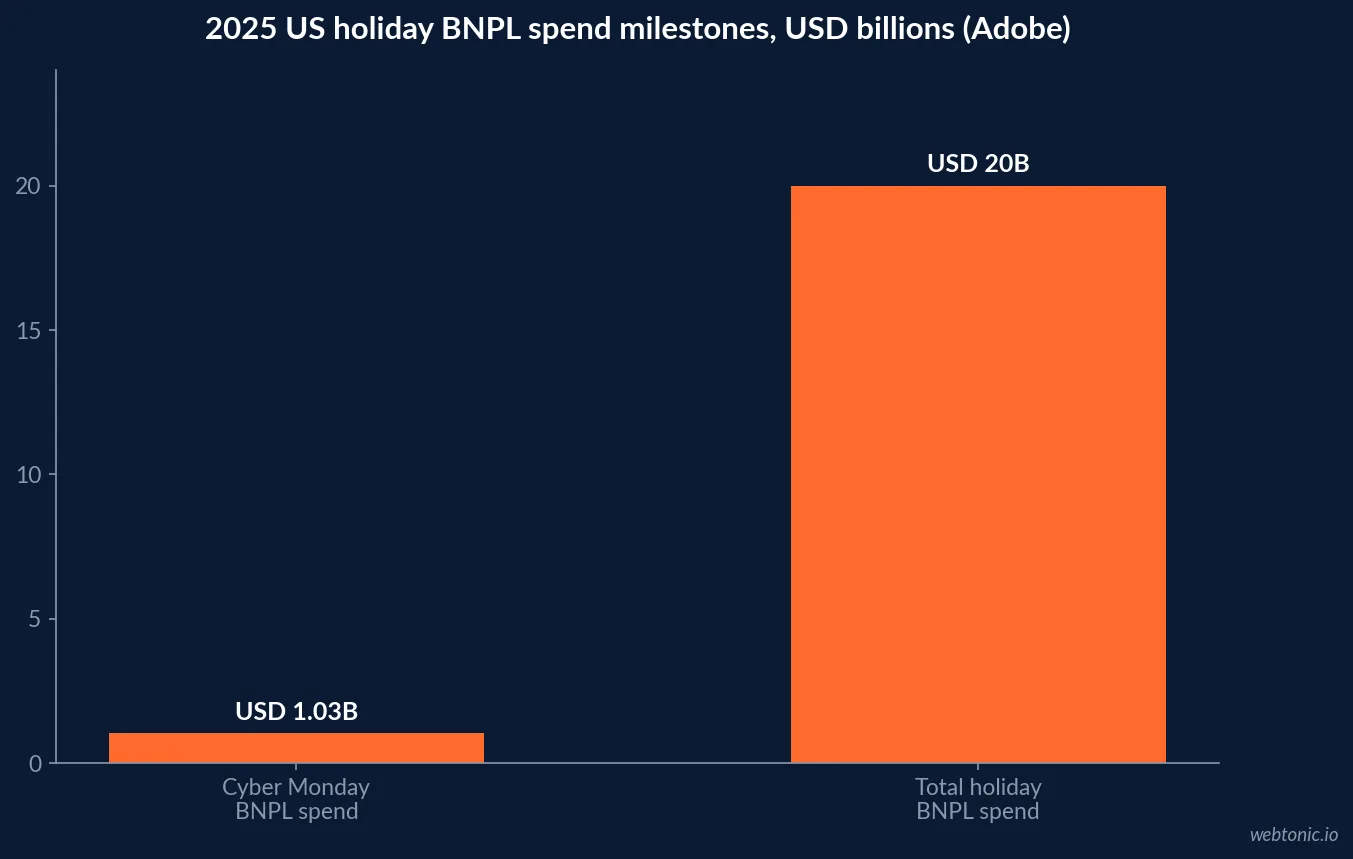
Adobe's 2025 holiday shopping report put total US online holiday spend at $257.8 billion, with buy now, pay later contributing $20 billion of that - up 9.8% year over year and $1.8 billion more than the prior season. Cyber Monday alone drove $1.03 billion in BNPL spend, the first time the payment method crossed the billion-dollar mark on a single day, up 4.2% year over year. Smartphones drove 82.2% of those BNPL purchases, a reminder that a slow mobile checkout is where a BNPL integration earns its keep.
| 2025 holiday season metric | Figure | YoY change |
|---|---|---|
| Total US online holiday spend | $257.8 billion | — |
| BNPL share of holiday spend | $20.0 billion | +9.8% |
| Cyber Monday BNPL spend | $1.03 billion | +4.2% |
| BNPL purchases made on smartphone | 82.2% | — |
| Categories most bought with BNPL | Electronics, apparel, toys, furniture | — |
Who is actually financing purchases this way
The Federal Reserve's 2025 Survey of Household Economics and Decisionmaking (SHED), run on nearly 13,000 respondents, found 16% of all US adults used BNPL in 2025, with usage rising every year since the survey first asked in 2021. Women use it more than men at every income and education level tested, and usage climbs sharply with financial constraint: 31% of adults who could only cover an emergency expense under $100 from savings used BNPL, a share that falls steadily to 8% among adults who could cover $2,000 or more.
Clothing and accessories are the dominant use case: 49% of BNPL users report using it for apparel, followed by groceries or food delivery at roughly one in five users, then electronics and furniture.
| BNPL user segment | Usage rate | Source |
|---|---|---|
| All US adults, 2025 | 16% | Federal Reserve SHED |
| Adults with <$100 emergency savings | 31% | Federal Reserve SHED |
| Adults with $2,000+ emergency savings | 8% | Federal Reserve SHED |
| Used BNPL for clothing/accessories | 49% of users | Federal Reserve SHED |
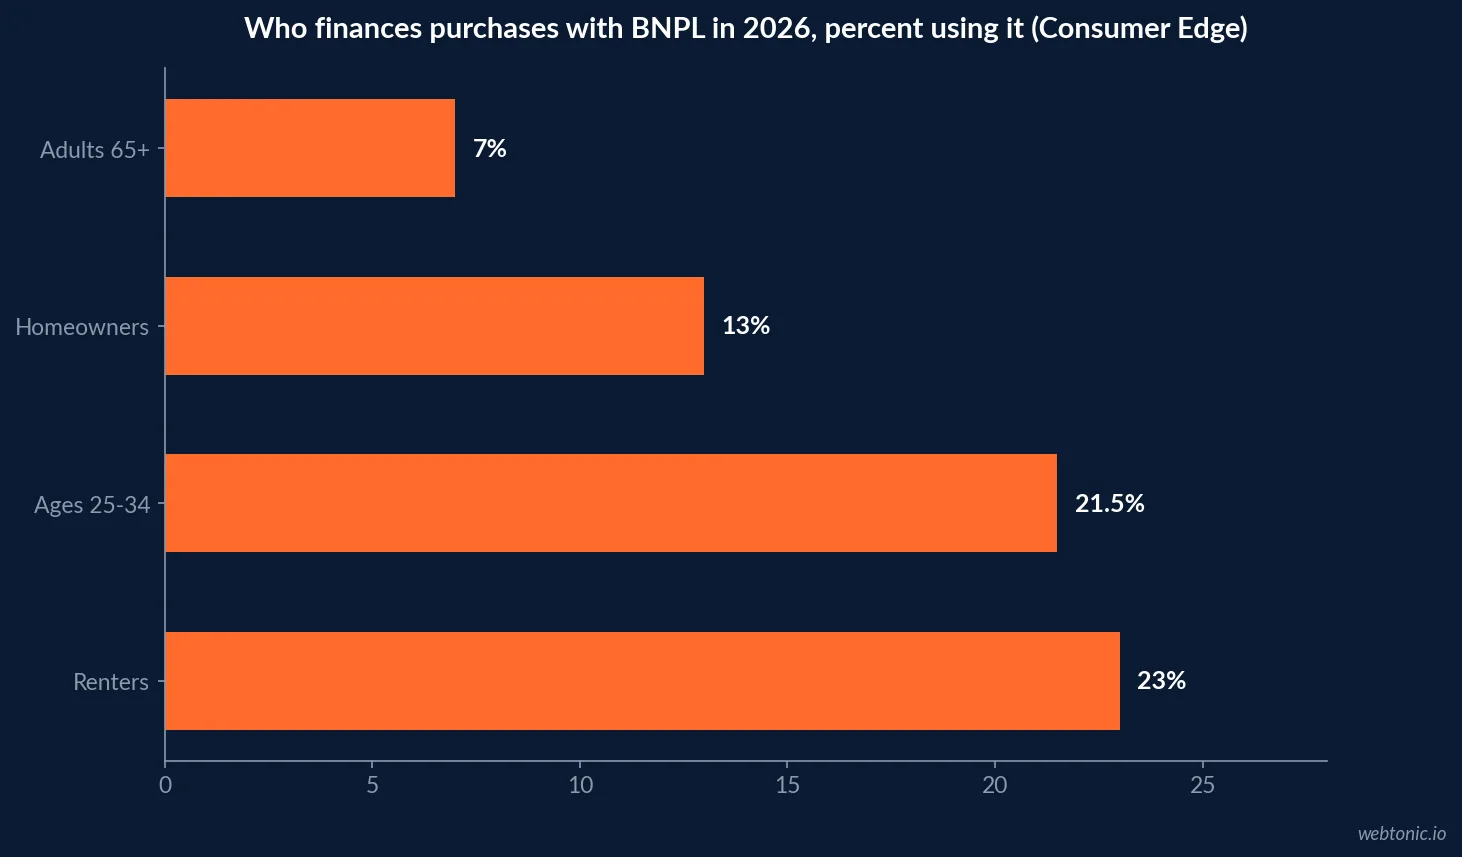
| Renters | ≈23% | Consumer Edge Q2 2026 |
| Homeowners | ≈13% | Consumer Edge Q2 2026 |
| Ages 25-34 | ≈21.5% | Consumer Edge Q2 2026 |
| Ages 65+ | ≈7% | Consumer Edge Q2 2026 |
The growth is concentrated where retailers need conversion help most
Consumer Edge's Q2 2026 BNPL Trends report found overall active-cardholder adoption at 15%, up 1.23 percentage points year over year. The households driving that growth are the ones a retailer's normal credit checks would otherwise turn away: the under-$40,000 income tier was the only income band to accelerate during the quarter, and households with children showed a persistent ~6.5-point adoption gap over households without kids. The over-$150,000 tier, by contrast, sits at just 13% penetration and slowing growth.
For a retailer, that concentration is the actual argument for BNPL: it recovers checkout conversion from shoppers who were going to abandon a cart over a liquidity gap, not from shoppers who had a credit card in hand anyway.
The delinquency picture retailers actually inherit
Merchants don't carry BNPL credit risk directly - the BNPL provider does - but delinquency trends still shape provider fees and approval rates at checkout. The CFPB's December 2025 BNPL market report found 4.1% of loans were assessed a late fee, down from 5.2% in 2022, with late fee revenue falling to 0.18% of total origination volume from 0.24%. A Richmond Fed economic brief separately reports the BNPL charge-off rate falling from 2.63% in 2022 to 1.83% in 2023, with charged-off debt as a share of total transaction value dropping from 1.71% to 0.92% - the lowest level since 2019.
| BNPL risk metric | 2022 | Latest reported | Source |
|---|---|---|---|
| Loans assessed a late fee | 5.2% | 4.1% | CFPB, Dec 2025 |
| Late fee revenue / origination volume | 0.24% | 0.18% | CFPB, Dec 2025 |
| Loan charge-off rate | 2.63% | 1.83% | Richmond Fed |
| Charged-off debt / transaction value | 1.71% | 0.92% | Richmond Fed |
What this means for a merchant's decision
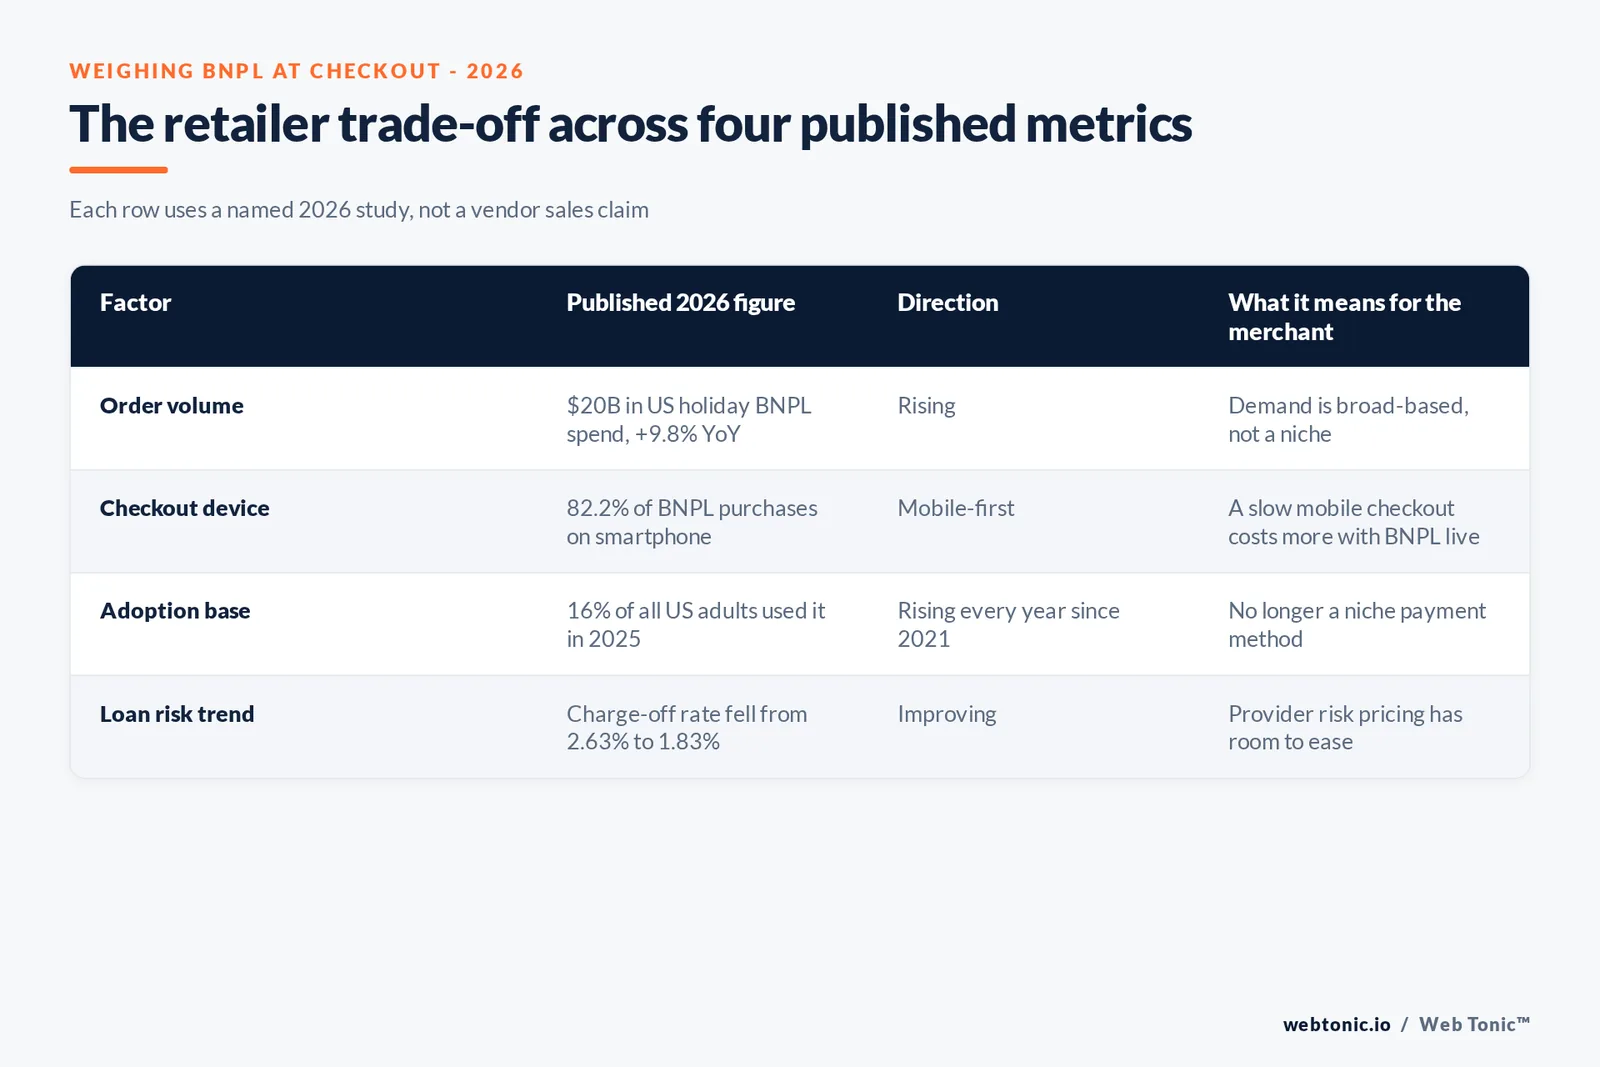
The pattern across every source above is the same shape: rising, broad-based consumer adoption; concentrated growth among liquidity-constrained shoppers who would otherwise abandon a cart; and falling loan-level risk metrics even as volume climbs. None of that answers the merchant discount fee question directly - fee structures vary by provider and category - but it does answer the demand-side question: BNPL is not a niche checkout option in 2026, it is close to a baseline expectation for anyone selling apparel, electronics or furniture online.
If BNPL checkout data is telling you conversion is being left on the table somewhere else in the funnel, our growth marketing team can help isolate where.
What retailers should ask a BNPL provider before signing
The public data above answers the demand-side question convincingly; it does not answer the merchant-economics question, because discount fees are negotiated per contract and rarely published. Three questions the data above suggests are worth asking directly: does the provider's approval rate skew toward the liquidity-constrained segments actually driving 2026 adoption growth (renters, under-$40,000 households), does their reported delinquency trend match the improving CFPB and Richmond Fed direction rather than lagging it, and does the merchant discount fee scale down as volume grows the way a card network's interchange typically does. A provider that cannot answer the second question with recent data is asking you to underwrite risk it may not be pricing correctly itself.
It is also worth separating the "pay-in-four" BNPL model most of this data describes from longer installment products some providers now bundle under the same brand - the two carry different risk and fee profiles, and a single blended rate across both can obscure which one is actually driving a merchant's cost.
Category fit matters more than the headline lift
Adobe's holiday data shows BNPL concentrating in categories with a natural payment-plan logic: electronics, apparel, toys and furniture were the top four purchase types by BNPL users during the 2025 season. A retailer in one of those categories should expect the aggregate lift to hold more reliably than a retailer selling low-ticket consumables, where a four-payment plan makes less sense to a shopper in the first place.
| Category signal | What the 2026 data shows | Retailer implication |
|---|---|---|
| Electronics, apparel, toys, furniture | Top BNPL purchase categories, Adobe 2025 holiday data | Aggregate AOV lift most likely to hold |
| Low-ticket consumables | Not among reported top BNPL categories | Lift may be smaller than the market average |
| Mobile-first storefronts | 82.2% of BNPL purchases on smartphone | Checkout speed on mobile matters more with BNPL live |
| Renter and under-$40k audiences | Fastest-growing adoption segments | BNPL recovers carts these segments would otherwise abandon |
How to read these numbers before adding a BNPL provider
Compare your own average order value with and without BNPL for at least one full quarter before renewing or renegotiating a provider contract - Adobe's aggregate lift is a market average, not a guarantee for a specific category. Watch the delinquency trend, not just the current rate: both the CFPB and Richmond Fed data show the trend improving, which is the number that should shape a multi-year provider negotiation more than a single snapshot. For the paid-traffic side of that same checkout, our note on what Facebook Ads cost in 2026 covers a comparable budgeting exercise, and our team can review a BNPL provider contract's fee structure against your category's expected lift.
Frequently Asked Questions
Is buy now pay later actually worth it for retailers?
The order-value case is strong and the delinquency case has improved. Adobe's 2025 holiday data shows BNPL drove $20 billion in online spend, up 9.8% year over year, and merchants who offer it typically see materially higher order values than checkouts without it. On the risk side, Richmond Fed data shows the charge-off rate on BNPL loans fell from 2.63% in 2022 to 1.83% in 2023. The trade-off is the merchant discount fee BNPL providers charge per transaction, which retailers have to weigh against that order-value lift for their own margin structure.
How many consumers actually use buy now pay later?
16% of all US adults used BNPL in 2025, according to the Federal Reserve's Survey of Household Economics and Decisionmaking (SHED), and usage has risen every year since the survey first asked about it in 2021. Consumer Edge's Q2 2026 data puts active-cardholder adoption at 15% and rising, with the fastest growth among households earning under $40,000 a year and renters.
What do people actually buy with BNPL?
Clothing and accessories lead by a wide margin - nearly half (49%) of BNPL users report using it for apparel in the prior year, per the Fed's 2025 SHED data. Groceries or food delivery follow at roughly one in five users, then electronics and furniture or appliances. Adobe's holiday data adds that 82.2% of BNPL purchases now happen on a smartphone.
Is BNPL riskier for retailers than credit cards?
The trend is toward less risk, not more. The CFPB's December 2025 BNPL market report found that 4.1% of loans were assessed a late fee, down from 5.2% in 2022, and that late fee revenue fell to 0.18% of total origination volume from 0.24%. The Richmond Fed separately reports the charge-off rate falling from 2.63% (2022) to 1.83% (2023), with charged-off debt as a share of transaction value dropping from 1.71% to 0.92% over the same period.
Which customers are driving BNPL growth in 2026?
Lower-income households and renters, disproportionately. Consumer Edge's Q2 2026 report found BNPL penetration of roughly 23% among renters versus 13% among homeowners, and the under-$40,000 income tier was the only income band to accelerate its year-over-year adoption during the quarter. The Fed's SHED data shows a similar pattern by liquidity: 31% of adults who could cover an emergency expense of less than $100 from savings used BNPL, against 8% of those who could cover $2,000 or more.
Sources
Adobe Digital Insights - 2025 Holiday Shopping Season Report
Federal Reserve - Consumer & Community Context, August 2026
CFPB - Buy Now, Pay Later Market Report, December 2025
Federal Reserve Bank of Richmond - Buy Now, Pay Later: Recent Developments and Implications
Consumer Edge - Q2 2026 Buy Now, Pay Later Trends Report


