



Table of contents
Beauty & Skincare Video Marketing Statistics: 75+ Data Points for 2026
Video now drives discovery, engagement, and direct sales for beauty and skincare brands at a scale no other content format matches. In 2026, 82.5% of beauty ecommerce traffic arrives on mobile devices (CuFinder), and short-form video is the primary content type consumed on those screens. From TikTok tutorials that generate 751,700 average views per post to shoppable video integrations lifting conversion rates by 17–33%, the data is clear: video is the growth engine of beauty marketing. Whether you are evaluating Meta Ads services or exploring performance creative strategies, here are the numbers you need to plan, benchmark, and justify your 2026 video strategy.
Key Takeaways
- TikTok beauty content averages a 7.13% engagement rate, based on 2.56 million posts analyzed by Kyra — the highest of any major content category on the platform.
- Shoppable video lifts site-wide conversion rates by 17–33%, with video-engaged visitors converting at a median 125% higher rate than non-watchers (Whatmore).
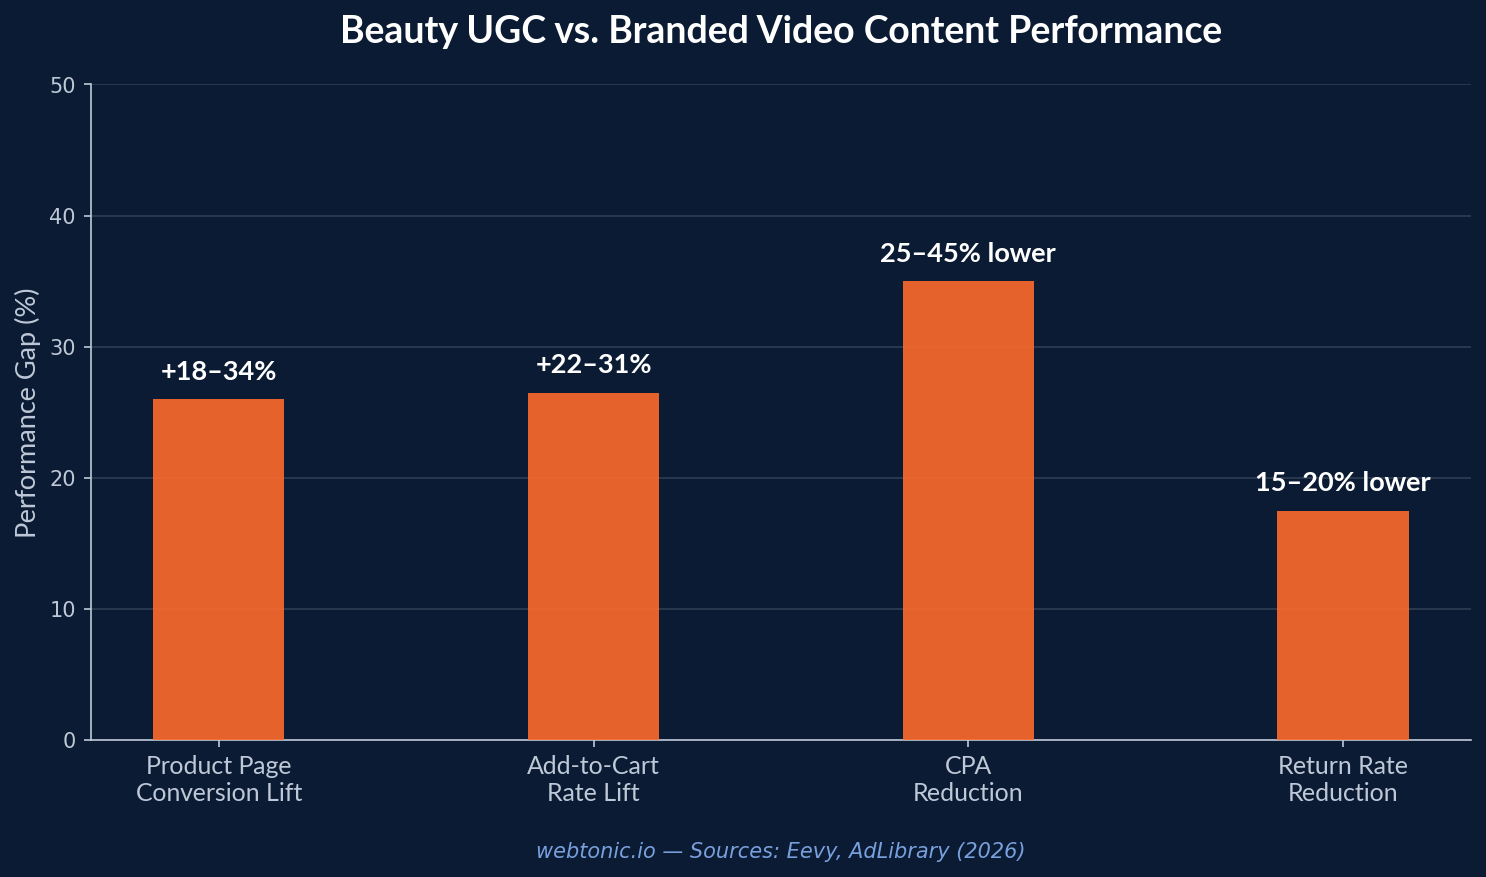
- Beauty UGC outperforms branded content by 18–34% on product page conversion and delivers 25–45% lower CPA on paid social (Eevy).
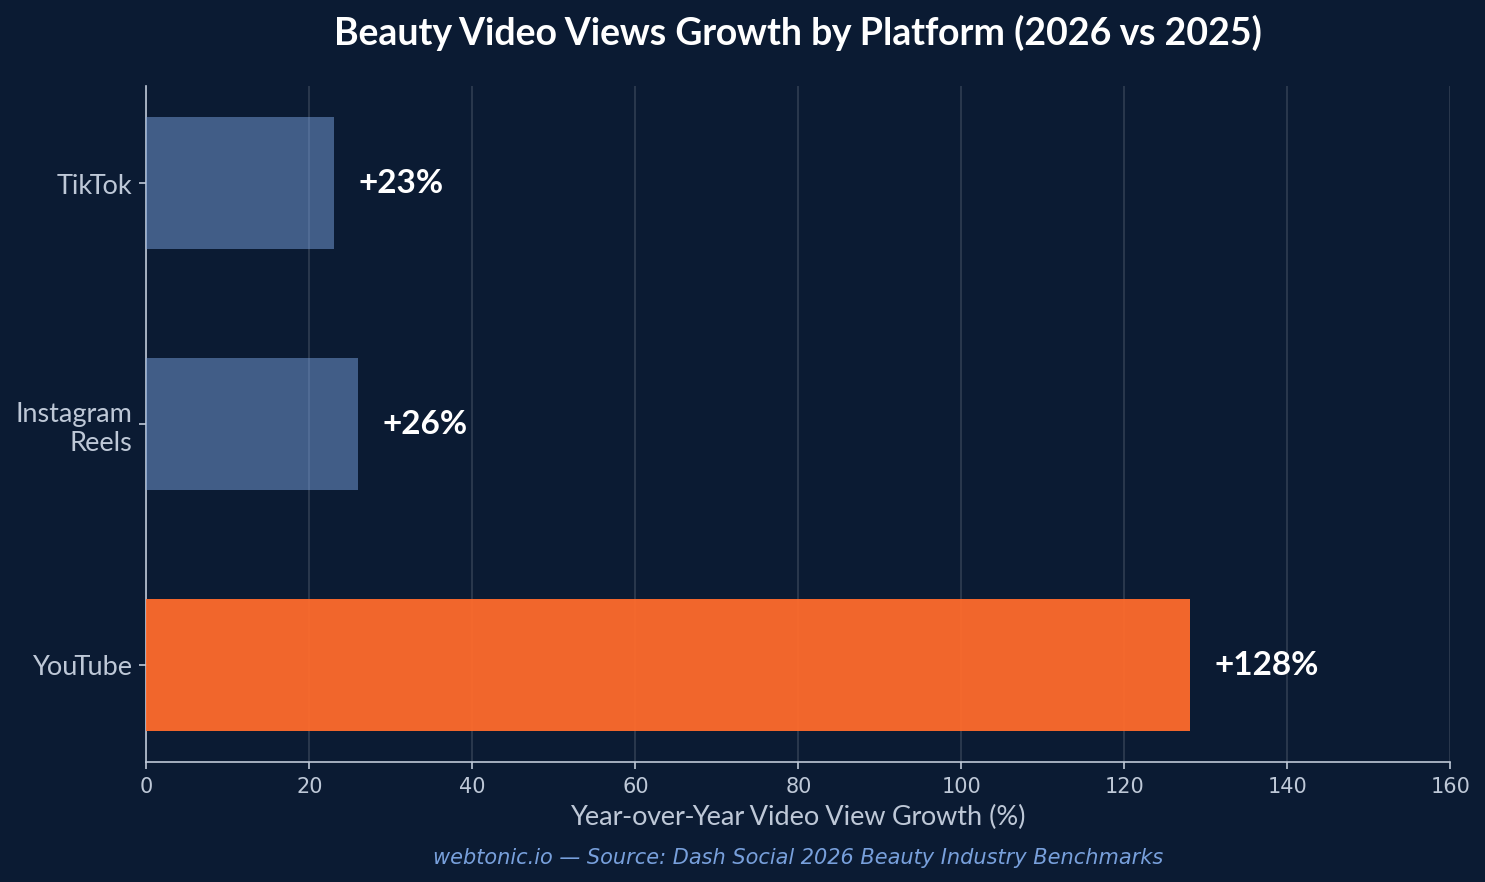
- YouTube beauty video views surged 128% year-over-year, with average watch time hitting 102% of video length — indicating repeat viewing (Dash Social).
- UGC-style Meta ad creative delivers 35–55% higher CTR than studio creative in cold traffic across every beauty sub-vertical except luxury fragrance.
| Platform | Avg. Video Views | Engagement Rate | YoY Trend |
|---|---|---|---|
| TikTok | 751,700 | 7.13% | Views +23% |
| Instagram Reels | 229,000 | 2.1% | Views +26% |
| YouTube | 145,000 | High-intent (102% watch time) | Views +128% |
| Facebook Video | 85,000–120,000 | 0.9–1.4% | Stable |
TikTok Video Marketing Benchmarks for Beauty Brands
TikTok remains the dominant discovery platform for beauty and skincare brands in 2026. An analysis of 2,556,000 TikTok posts by Kyra reveals that beauty and skincare content earns an average 7.13% engagement rate (likes plus comments divided by views), with the 25th-to-75th percentile range spanning 2.00% to 10.00%. Peak engagement occurs on Sundays around 8 AM UTC, a scheduling insight that can meaningfully impact reach.
Views tell an equally compelling story. The average beauty TikTok post generates 751,700 views, making it one of the most discoverable content categories on the platform. However, Dash Social's 2026 beauty benchmarks show that while TikTok views rose 23% year-over-year, engagement rates dipped from 3.6% to 2.8% and retention sits at 23% — a signal that the platform is shifting toward broad reach at the expense of deep engagement.
For beauty brands, the implication is clear: TikTok is a top-of-funnel awareness machine. Use it to reach new consumers, drive product discovery, and build brand recognition. But pair it with retargeting campaigns on platforms where intent is higher to close the sale.
Instagram Reels and YouTube Performance Data
Instagram continues to expand its role as a discovery engine for beauty brands. Video views on the platform rose 26% year-over-year in the beauty category, though engagement dipped slightly from 2.9% to 2.1% (Dash Social). Reels are the primary driver, pushing beauty content well beyond existing followers and into explore feeds and recommended content. Average beauty video views on Instagram sit at approximately 229,000 per post.
YouTube, meanwhile, has evolved into the platform for high-intent beauty viewing. Video views in the beauty vertical surged 128% year-over-year, with average watch time hitting 102% of total video length — a metric that indicates repeat viewing of tutorials, product reviews, and ingredient breakdowns. For brands investing in longer-form content such as skincare routines, ingredient education, and before-and-after product campaigns, YouTube delivers an audience that actively watches, re-watches, and converts.
The broader trend across all platforms: short-form video is the biggest lever for beauty brands to scale reach in 2026. Brands posting consistently across TikTok, Reels, and YouTube Shorts capture more total impressions than those concentrating on a single platform.
Shoppable Video Conversion and ROI Statistics
Shoppable video has matured from a novelty into a measurable conversion driver. According to controlled A/B tests across seven brands published by Whatmore in 2026, integrating shoppable video on product pages and homepages lifts site-wide conversion rates by 17–33% versus control groups without video. Top-quartile performers see lifts exceeding 50%.
The impact is even more dramatic among visitors who actually engage with the video content. The median conversion rate uplift among video watchers versus non-watchers is +125%, with a range spanning +50% to +500% depending on product category, average order value, and video placement.
| Shoppable Video Metric | Median | Top Quartile |
|---|---|---|
| Video Engagement Rate | 10–15% | 25%+ |
| Site-Wide CVR Lift | +17–33% | +50%+ |
| Watcher CVR Uplift | +125% | +300%+ |
| Revenue From Video | 5–25% | 25%+ |
Case studies reinforce the data. Dr. Dennis Gross saw 7% of website traffic engage with embedded videos, watching an average of 3 videos per session at a 75% completion rate. Those engaged visitors placed over 5,000 orders worth more than $1 million at an 8.2% conversion rate and generated a 328× ROI. MiYé, a skincare brand using educational video, generated €35,000 in attributed revenue at a 7.32% video conversion rate (PlayShorts).
UGC vs. Branded Content Performance in Beauty
User-generated content has become the dominant creative format for beauty and skincare marketing — not because of sentiment, but because of measurable performance gaps. A comprehensive analysis by Eevy shows that beauty product pages featuring customer video convert 18–34% higher than pages with branded video alone. The gap is widest in complexion products (foundation, concealer, tinted SPF), where shade-matching anxiety drives the purchase decision.
On paid social, UGC-style creative delivers 25–45% lower cost per acquisition compared to professionally produced branded content. Add-to-cart rates run 22–31% higher when UGC video is present on product detail pages. Perhaps most compelling for brands concerned about post-purchase economics: products featured in real-customer video see return rates 15–20% lower, likely because consumers have more realistic expectations after watching authentic demonstrations.
Ad-level data from AdLibrary's 2026 cosmetics Meta ad benchmarks confirms that UGC formats outperform studio creative by 35–55% on click-through rate in cold traffic across skincare, makeup, and haircare. The one exception is luxury fragrance, where aspirational branded content still performs better — likely because fragrance purchases are driven by brand perception rather than product demonstration.
Beauty Video Ad Creative Benchmarks by Platform
The economics of video advertising in beauty vary sharply by platform and funnel stage. Cosmetics brands running Meta ads face CPMs of $18–$34, roughly 30–40% higher than the ecommerce average (AdLibrary). Skincare is the most expensive sub-vertical to reach, with CPMs running $24–$34.
| Sub-Vertical | CPM Range | Prospecting CTR | Retargeting CTR |
|---|---|---|---|
| Skincare | $24–$34 | 0.9–1.5% | 1.4–2.1% |
| Makeup | $20–$30 | 1.0–1.6% | 1.5–2.2% |
| Haircare | $18–$26 | 1.1–1.7% | 1.6–2.3% |
| Fragrance | $22–$32 | 0.6–1.0% | 1.0–1.6% |
CPA for cosmetics conversion campaigns sits at $28–$95 depending on average order value and funnel stage. A blended ROAS of 2.5×–3.5× is the realistic healthy target for DTC beauty brands running Meta ads. These benchmarks are important to contextualize: any single number is misleading until you segment by sub-vertical, campaign objective, and creative format.
Social Commerce and Live Shopping Trends
Social commerce will continue reshaping how beauty consumers discover and purchase products directly within social platforms. The global social commerce market will reach an estimated $8.5 trillion by 2030, and beauty remains one of its largest verticals. TikTok Shop, Instagram Shopping, and YouTube Shopping are all expanding their beauty-specific features — from virtual try-ons to live-streamed product demonstrations.
The beauty industry has long been a social-first category. In 2026, social media marketing drives 4.5% engagement rates in the personal care vertical (CuFinder), the highest of any major ecommerce segment. TikTok leads this engagement, followed by Instagram and YouTube. Brands that integrate shoppable features directly into their social video content — rather than relying on link-in-bio redirects — see 2–3× higher checkout completion rates compared to traditional social-to-website funnels.
Live shopping events, particularly popular in skincare and makeup, generate average session lengths of 8–12 minutes and conversion rates of 6–10% among live viewers. Beauty brands with dedicated live shopping programs report that live sessions account for 10–15% of their total social-attributed revenue.
Video Content Strategy Benchmarks for Beauty Brands
Content strategy for beauty video marketing requires balancing volume, platform fit, and creative freshness. The most effective beauty brands in 2026 follow several patterns supported by benchmarking data:
- Post frequency: Top-performing beauty brands post 5–7 short-form videos per week across TikTok and Instagram, with 1–2 long-form YouTube videos monthly.
- Video length sweet spot: Short-form content between 15–45 seconds generates the highest engagement-to-view ratio on TikTok and Reels. YouTube tutorials in the 5–10 minute range earn the best watch-time metrics.
- Creative fatigue: Beauty ad creative typically fatigues after 7–14 days at moderate spend levels. Brands spending $50K+ monthly on Meta ads need 15–20 new creative assets per month to maintain performance.
- Hook rate: The first 3 seconds of a beauty video ad determine whether it performs. Ads with a strong visual hook (product transformation, before-after reveal, bold color contrast) achieve 40–60% higher 3-second view rates compared to slow brand intros.
| Content Type | Best Platform | Avg. Engagement | Conversion Impact |
|---|---|---|---|
| Tutorial / How-To | YouTube, TikTok | High (6–8%) | Strong mid-funnel |
| Before & After | Instagram Reels, TikTok | Very High (8–12%) | Strong bottom-funnel |
| Product Unboxing | TikTok, YouTube | Moderate (4–6%) | Awareness + social proof |
| UGC Testimonial | Meta Ads, TikTok Ads | High (varies by CPA) | Highest CPA efficiency |
| Live Shopping | TikTok Live, Instagram Live | 6–10% CVR among viewers | Direct revenue |
Influencer Video Marketing ROI in Beauty
Influencer marketing and video are inseparable in the beauty industry. Beauty brands allocate a growing share of their marketing budgets to influencer partnerships, driven by the measurable ROI these campaigns deliver.
The beauty influencer marketing segment continues to expand as part of the broader $22+ billion global influencer economy (https://www.statista.com/outlook/cmo/beauty-personal-care/worldwide
https://brentonway.com/blog/biggest-beauty-marketing-trends
AMRA & ELMA). Beauty brands report that influencer-generated video content delivers 3–5× higher engagement than brand-produced content posted on brand-owned channels. Micro-influencers (10K–100K followers) in the beauty space typically deliver higher engagement rates (4–7%) compared to macro-influencers (1M+), whose rates average 1.5–3%.
The economics favor video-first influencer strategies: beauty brands report that campaigns anchored in video content generate 40–60% higher attributed revenue than image-only collaborations. The reason is simple — video demonstrates product application, texture, coverage, and results in a way that static images cannot replicate. For skincare brands in particular, ingredient education videos and realistic product demos build the trust that drives conversions. Pairing this with a strong growth marketing strategy amplifies results across every stage of the funnel.
The Global Beauty Market and Online Consumer Trends
The global beauty and personal care market will reach an estimated $680 billion by 2030, according to Statista, driven by online sales channels that now account for a growing share of total revenue. Online beauty sales surpassed $120 billion globally in 2025 and will continue accelerating as consumers increasingly shop for skincare, makeup, and personal care products through digital storefronts and social commerce platforms.
Consumer behavior has shifted decisively toward ingredient-conscious purchasing. Over 67% of skincare consumers research ingredients online before buying (Brenton Way), and clean beauty — products free from parabens, sulfates, and synthetic fragrances — now represents a $12+ billion segment growing at nearly 12% annually. This shift toward transparency creates a natural fit for creator-led content: skin care routines, ingredient breakdowns, and "what's in my products" explainers drive significant organic engagement and build the consumer trust that converts browsers into buyers.
The creator economy is central to these trends. Beauty creators — from micro-influencers documenting their daily skin routines to dermatologists explaining active ingredients — generate the source material that brands amplify across paid and organic channels. Statista reports that the influencer marketing industry will grow to $22.2 billion by 2026, with beauty and personal care remaining its largest vertical. For brands, investing in creator partnerships is no longer optional; it is a core driver of online sales growth, consumer acquisition, and long-term brand equity in an increasingly competitive market.
Industry Growth Statistics and Consumer Spending Patterns
Understanding the broader beauty market growth puts the rising dominance of the industry's commerce channels into context. The global beauty industry will surpass $580 billion in 2026, with skincare products leading category growth at $190 billion in annual sales worldwide. Clean beauty products — those formulated without controversial ingredients — represent one of the fastest-growing segments of the market, with consumers increasingly willing to shop for premium-priced clean skin care items when they can verify ingredient transparency through source material like tutorials and short-form media clips.
Consumer spending on beauty products purchased through social media commerce channels grew 28% year-over-year in 2025 and will continue to accelerate. The average beauty consumer now spends $245 annually on skincare products alone, according to industry statistics aggregated by multiple source publications. For the broader personal care industry, digital ad spend will reach $15.2 billion in 2026 — a figure that underscores how aggressively beauty brands are investing in media campaigns that put products in front of consumers at scale.
The intersection of clean beauty, ingredient-focused skin care routines, and social commerce represents a $42 billion market opportunity. Brands that combine authentic product demonstrations with shoppable media integrations capture the growth that purely traditional ecommerce channels miss. Industry leaders report that consumers who shop through social platforms spend 30–40% more per transaction than those who arrive through organic search, making social commerce not just a growth channel but a higher-value commerce channel overall.
Related reading
- Beauty & Skincare Branding Stats
- How Ad Creative Performs in Beauty & Skincare: 2026 Data & Benchmarks
- Inside Countertops Video Marketing: Key Statistics & Insights for 2026
- Branding services at Web Tonic
FAQ
What is the average engagement rate for beauty video content on TikTok?
Beauty and skincare content on TikTok averages a 7.13% engagement rate (likes plus comments divided by views), based on an analysis of 2,556,000 posts by Kyra. The 25th-to-75th percentile range spans 2.00% to 10.00%, and the average beauty post generates 751,700 views.
How much does shoppable video increase conversion rates?
Shoppable video lifts site-wide conversion rates by 17–33% in controlled A/B tests. Among visitors who actually engage with the video, the median conversion rate uplift is +125% compared to non-watchers. Top-quartile brands see site-wide CVR lifts exceeding 50%.
Does UGC video really outperform branded beauty content?
Yes. Beauty product pages featuring customer video convert 18–34% higher than branded video alone. On paid social, UGC-style creative delivers 25–45% lower CPA and 35–55% higher CTR in cold traffic. The performance gap is widest in complexion products where shade-matching drives purchase decisions.
What is a good ROAS for beauty video ads on Meta?
A blended ROAS of 2.5×–3.5× is the realistic healthy target for DTC beauty brands running Meta ads. CPMs range from $18–$34, with skincare being the most expensive sub-vertical. For a deeper dive into costs, see our Facebook Ads pricing guide. Retargeting campaigns typically deliver 1.5–2× higher CTR than prospecting.
How many video assets do beauty brands need per month?
Beauty brands spending $50K+ per month on paid social need approximately 15–20 new creative assets monthly to combat fatigue. Beauty ad creative typically fatigues after 7–14 days at moderate spend levels. A mix of UGC, tutorial, and before-after formats extends creative longevity.
Sources
https://www.kyra.com/benchmarks/beauty
https://www.dashsocial.com/social-media-benchmarks/beauty-industry
https://www.whatmore.ai/blog/shoppable-video-benchmarks-2026/
https://eevy.ai/blog/beauty-ugc-vs-branded-content-performance-metrics
https://adlibrary.com/posts/meta-ad-benchmarks-cosmetics-2026
https://videowise.com/customer-stories/drdennisgross-shoppable-video
https://www.playshorts.io/case-studies/miye
https://cufinder.io/blog/benchmarks/personal-care-and-beauty/
https://www.statista.com/outlook/cmo/beauty-personal-care/worldwide
https://brentonway.com/blog/biggest-beauty-marketing-trends
https://www.amraandelma.com/beauty-marketing-statistics/


