



Table of contents
Key Takeaways
- UGC beauty ads achieve 4.5× higher click-through rates than polished branded creative on Meta platforms, making user-generated content the single highest-leverage format in beauty advertising.
- TikTok CPC for beauty dropped 22% year-over-year to the $0.60–$0.90 range, while Meta CPMs inflated 30–40% YoY — reshaping where brands allocate paid media budgets.
- Top-performing beauty brands ship 8–12 net-new creator assets per month, consistently outperforming brands recycling 2–3 hero videos even at the same spend level.
- 36.8% of all top-performing beauty ads used UGC-style creative in 2026, making it the dominant format across the entire performance advertising dataset.
- Beauty marketing intensity leads DTC — e.l.f. allocates 21.4% of revenue, Coty 26.7%, and Beauty Health 31.1% to marketing, per 2025–2026 10-K filings.
- Macro influencers (250K–500K followers) grew +22.6% YoY in the beauty vertical, with TikTok macro creators generating 3.5× more earned media value per post than their Instagram equivalents.
| Platform | CPC | CPM | CTR | ROAS |
|---|---|---|---|---|
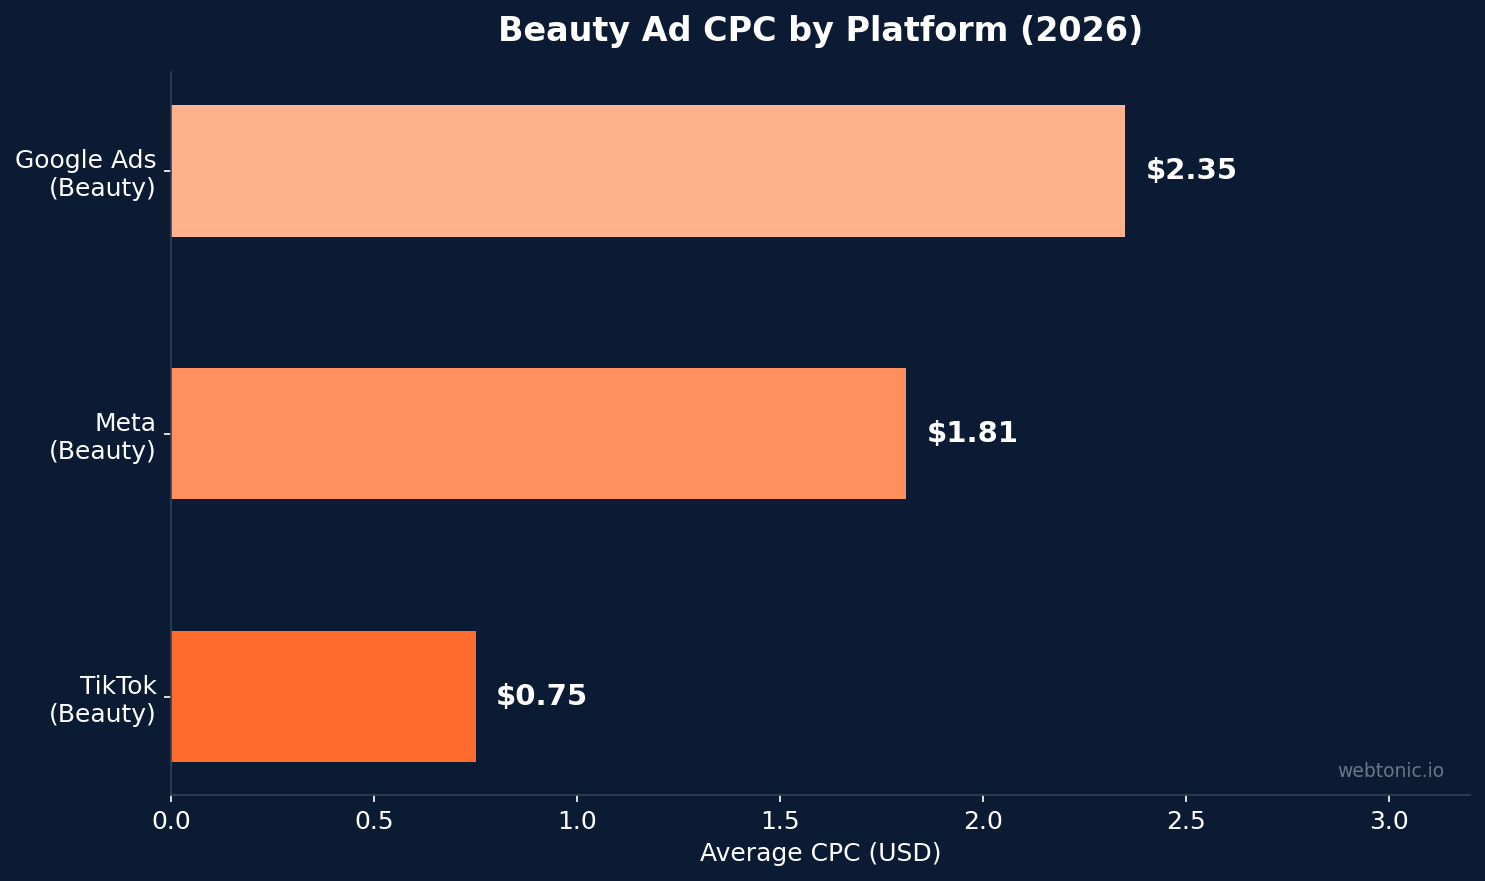
| Meta (Beauty) | $1.81 | $12.50–$18.00 | 1.16% | 3.00:1+ |
| TikTok (Beauty) | $0.60–$0.90 | $6.00–$10.00 | 1.20–1.50% | 2.12:1 |
| Google Ads (Beauty) | $1.50–$3.20 | $14.00–$22.00 | 3.00–4.50% | 4.00:1+ |
Beauty Advertising Spend Is Surging — and Creative Decides Who Wins
The global beauty industry is not slowing down, and neither is its advertising budget. Cosmetics and personal care ad spend is projected to grow 5.5% in 2026, outpacing the broader consumer goods category by a meaningful margin. Beauty brands now route roughly 25–35% of their digital marketing budget into influencer and creator partnerships, up from the high-20s in 2024, reflecting a broader shift toward performance-oriented creative strategies.
That shift matters because in beauty, creative quality is the primary growth lever. Brands that invest in data-driven ad creative — not just media buying — consistently outperform competitors at the same spend level. This comprehensive guide breaks down every verified benchmark, platform by platform, so your campaigns can compete with industry leaders.
Whether you run Meta Ads management in-house or partner with a performance creative services team, these statistics reveal where beauty advertising dollars deliver real returns in the current market.
UGC vs. Branded Creative: The Performance Data Is Clear
User-generated content has become the dominant creative format for beauty and skincare brands across all major advertising platforms. The numbers tell a compelling story about why production polish matters less than authenticity in 2026.
Beauty UGC ads achieve 4.5× higher click-through rates than branded creative on Meta platforms. Brands using UGC on product pages also report 21% lower return rates, because customers develop more realistic product expectations from peer-led content rather than studio-produced campaigns. Across the entire beauty advertising landscape, 36.8% of all top-performing ads used UGC-style creative, making it the most dominant format in 2026 performance datasets analyzed by Evolut Agency.
That said, the beauty category ROAS averages 2.12, below the cross-industry figure of 2.41. The gap is not in hooks and clicks — it is in post-click conversion, which means creative volume and variant testing matter as much as creative quality. Brands solving for both production velocity and landing page alignment consistently close that gap.
| Metric | UGC Creative | Branded Creative | Difference |
|---|---|---|---|
| CTR (Meta) | 4.5× higher | Baseline | +350% |
| Return Rate | 21% lower | Baseline | −21% |
| Engagement Rate | +161% lift | Baseline | +161% |
| Share of Top Ads | 36.8% | 63.2% | Largest single format |
Meta Ads Benchmarks for Beauty Brands
Meta remains the primary paid social channel for beauty advertising, but cost dynamics are shifting rapidly. Meta CPMs for beauty have inflated 30–40% year-over-year, according to Blueprint Media's 2026 State of DTC report. Despite the cost increases, the platform's targeting precision and conversion intent keep it central to most beauty media plans.
Beauty brands on Meta pay an average CPC of $1.81 — roughly 4× higher than apparel — to compete for high-intent buyers. Average CTR sits at 1.16%, with conversion rates reaching 7.10%. That combination delivers a ROAS of 3.00:1 or higher for campaigns with strong creative.
Format selection matters significantly: Reels-native creative outperforms average cold CTR by 20–40%, making it the best format for awareness and new product launches. Static images underperform cold audiences by 5–20% but hold steady in retargeting campaigns using offers and DPA catalog creative.
For brands investing between $3M and $15M in annual revenue, the recommended split is 60–65% of paid spend on Meta-led prospecting, with TikTok amplifying breakout creative angles at 25–30% of budget. Explore our detailed Facebook Ads costs breakdown for deeper context on how these platform economics compare.
TikTok Ads Performance for Beauty & Skincare
TikTok is reshaping beauty advertising economics at a structural level. The platform's CPC for beauty dropped 22% year-over-year to the $0.60–$0.90 range, making it the most cost-efficient paid social channel for skincare and cosmetics brands seeking new customer acquisition.
Average TikTok ad conversion rates hover near 2% industry-wide, but beauty-specific campaigns using short-form video creative and TikTok Spark Ads regularly exceed that baseline. TikTok Shop beauty sales reached $980 million in Q2 2026, an increase of 82% from the same period a year prior. The platform is now the fourth-largest health and beauty e-commerce retailer in the United States, with total beauty sales surpassing $4.4 billion annually.
The creative playbook for TikTok is distinctly different from Meta. Production volume now matters more than production polish. Brands shipping 8–12 net-new creator assets monthly consistently outperform those recycling 2–3 hero videos — even at identical spend levels. TikTok Spark Ads, which boost organic creator content as paid campaigns, deliver the highest engagement rates when combined with authentic, unpolished product demonstrations.
Influencer Marketing and Creator-Led Campaign Data
Beauty brands are betting heavily on influencer-driven ad creative. Approximately 25–35% of beauty digital marketing budget now flows into influencer and creator partnerships, up from the high twenties in 2024.
Macro influencers with 250K–500K followers grew +22.6% YoY in the beauty vertical — the strongest-growing tier in the industry. TikTok macro creators generate 3.5× more earned media value per post than their Instagram equivalents, tilting creator investment toward video-first social media platforms.
Marketing spend intensity varies by brand maturity and product strategy: e.l.f. Beauty spends 21.4% of revenue on marketing, Coty allocates 26.7%, and Beauty Health commits 31.1%, all per 2025–2026 10-K filings. These benchmarks help smaller DTC beauty brands calibrate their own creator budgets against proven public-company performance data.
| Brand | Marketing % of Revenue | Primary Channel | Creator Focus |
|---|---|---|---|
| e.l.f. Beauty | 21.4% | TikTok + Meta | Micro + macro influencers |
| Coty | 26.7% | Meta + retail media | Celebrity + macro |
| Beauty Health | 31.1% | Meta + Google | Dermatologist-led UGC |
Creative Fatigue and Production Cadence Benchmarks
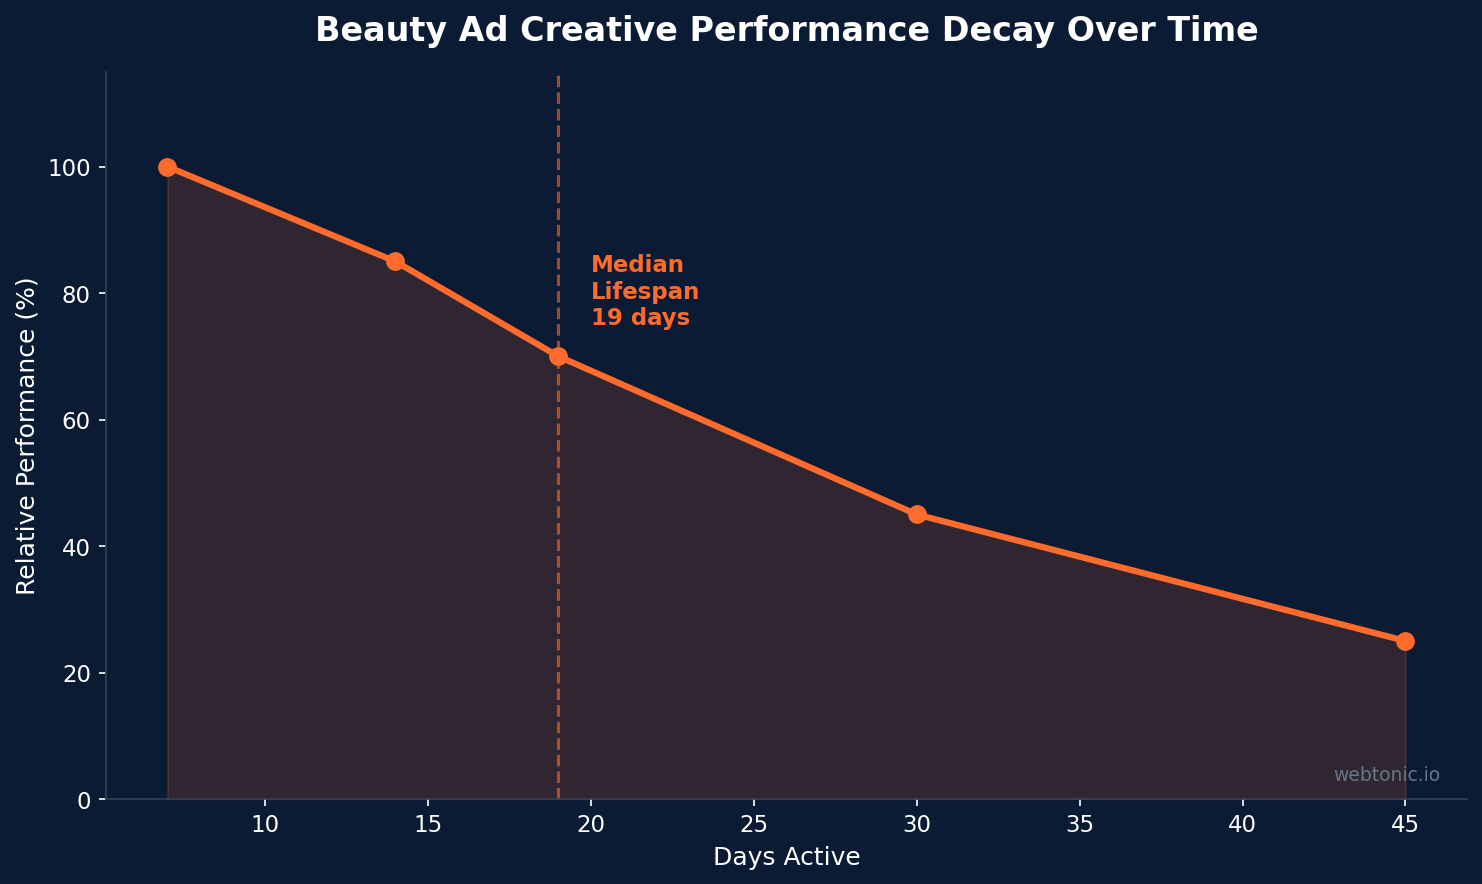
Creative fatigue hits beauty ads faster than most industries due to high audience overlap and intense competition. The median skincare ad creative stays active for just 19 days before advertisers pause or replace it, and 31.6% of creative is replaced within the first two weeks. That means beauty brands need a constant pipeline of fresh assets to maintain campaign performance.
High-performing beauty advertisers maintain a minimum cadence of 8–12 new creative assets per month. This cadence is not optional — it is the statistical threshold where paid social campaigns reliably outperform. Brands that test fewer than 4 net-new assets per month see measurable performance degradation in their paid media results, as ad fatigue compounds with each day beyond the 19-day median.
For a performance creative strategy that scales, pair UGC production with structured A/B testing. Lead with hooks in the first 3 seconds, use before-and-after demonstrations for skincare products, and rotate social proof elements (customer reviews, case studies, clinical data) across creative variants.
Google Ads and Search Performance for Beauty Creative
While social platforms dominate beauty advertising budgets, Google Ads still delivers strong returns for high-intent search queries. Beauty brands on Google Search see CTRs of 3.00–4.50%, with CPCs ranging from $1.50 to $3.20 depending on keyword competitiveness and product category.
Performance Max campaigns in beauty benefit from strong product feed creative — high-quality product photography, lifestyle imagery, and video assets all contribute to higher asset group scores. Brands running Google Shopping alongside Google Ads campaigns typically achieve ROAS of 4:1 or higher on branded and high-intent product queries.
The cross-channel data-driven approach is what separates top beauty advertisers from average performers. Creative that succeeds on Meta often requires reformatting for Google — what works as a 9:16 TikTok-style video rarely transfers directly to YouTube pre-roll or Search responsive ad formats.
Ad Creative Benchmarks by Format and Placement
| Format | Cold CTR vs Avg | Retargeting CTR vs Avg | Best Use Case |
|---|---|---|---|
| Reels Native | +20% to +40% | +5% to +15% | Awareness, new product launch |
| In-Feed Video | +10% to +25% | +10% to +20% | Consideration, product demos |
| Carousel | +5% to +15% | +15% to +30% | Multi-product, shade ranges |
| Static Image | −20% to −5% | +0% to +15% | Retargeting with offer, DPA catalog |
| TikTok Spark Ads | +15% to +35% | +5% to +10% | Authentic reviews, unboxing |
What These Statistics Mean for Your Beauty Brand Strategy
The data points to three clear priorities for beauty brands investing in ad creative in 2026:
- Prioritize UGC and creator-led content over studio production. With 4.5× higher CTRs and 21% lower return rates, authentic content wins on every metric that matters for revenue growth and customer acquisition.
- Diversify across TikTok and Meta with platform-native creative. TikTok's 22% CPC decline makes it essential for prospecting, while Meta's higher-intent audience justifies its premium CPMs for retargeting and conversion campaigns.
- Maintain a minimum of 8–12 new assets per month. Creative fatigue at 19 days means quarterly campaign refreshes are dangerously inadequate. Build a production system, not a production event.
If you are looking for a Facebook Ads ROI analysis tailored to your specific vertical, or want to benchmark your current creative performance against these industry standards, the statistics above provide the analytical framework your team needs.
What is the average ROAS for beauty ads on Meta in 2026?
Beauty brands on Meta achieve an average ROAS of 3.00:1 or higher when using strong creative. The average CPC is $1.81 with a 7.10% conversion rate, though results vary significantly based on creative format and audience targeting strategy.
How often should beauty brands refresh their ad creative?
The median beauty ad stays active for only 19 days before performance declines. Top-performing brands ship 8–12 net-new creator assets per month to maintain competitive performance across paid social campaigns and combat creative fatigue.
Does UGC really outperform branded content for beauty advertising?
Yes. Beauty UGC ads achieve 4.5× higher click-through rates than branded creative on Meta platforms. UGC also reduces return rates by 21% because it sets more realistic product expectations for consumers considering a purchase.
What is the best ad format for beauty brands on TikTok?
Short-form video and TikTok Spark Ads deliver the strongest results for beauty brands. Spark Ads boost organic creator content as paid campaigns, combining authenticity with targeting precision. TikTok beauty CPC has dropped 22% year-over-year to the $0.60–$0.90 range.
How much do beauty brands spend on marketing as a percentage of revenue?
Beauty marketing intensity is among the highest in DTC. Public company benchmarks include e.l.f. Beauty at 21.4%, Coty at 26.7%, and Beauty Health at 31.1% of revenue, per 2025–2026 annual filings.
Data-Driven Creative Strategy and Revenue Growth
The most effective beauty brands build their ad creative strategy around real performance data rather than assumptions about what consumers want. Case studies from leading skincare companies demonstrate that campaigns integrating customer reviews, social proof, and creator testimonials consistently achieve higher conversion rates and better return on ad spend across paid social and paid media channels.
Building a sustainable creative production pipeline requires investment in both content creation infrastructure and performance measurement. DTC beauty brands should allocate dedicated resources toward creator partnerships, short-form video production capabilities, and structured A/B testing frameworks that enable rapid creative iteration across Instagram, TikTok, and Google advertising channels. The brands that build this production infrastructure achieve measurably better campaign results than those treating creative as an afterthought to media buying strategy.
Related reading
- What Auto Repair Ad Creatives Convert Best Right Now?
- Where Car Dealership and Powersports Ad Spend Is Heading
- Where Landscaping Ad Creative Budgets Are Going This Year
- Branding services at Web Tonic
Sources
pennock.co — Skincare Advertising Benchmarks 2026
benly.ai — Skincare Ad Creative Benchmarks Q1 2026
foundrycro.com — DTC Beauty Marketing Benchmarks 2026
adlibrary.com — Cosmetics Meta Ad Benchmarks 2026
evolutagency.com — 2026 Top Beauty Ads Intelligence Report
eevy.ai — Beauty UGC vs Branded Content Statistics
eightx.co — Beauty Influencer Spend Benchmarks 2026
trendtrack.io — Meta Ad Spend by Industry 2025
wearisma.com — Beauty Influence Index 2026
dxglobal.com — Cosmetics Ad Spend Surge 2026
billo.app — UGC for Beauty & Skincare Brands
digitalapplied.com — TikTok Ads Benchmarks 2026


