Table of contents
Net revenue retention, not lead volume, is the number that separates growing B2B SaaS companies from shrinking ones, and four independent subscription-metrics panels agree on where the median actually sits in 2026. This page benchmarks churn and retention across Recurly, ChartMogul, KeyBanc/Sapphire Ventures and Benchmarkit, and treats lifecycle marketing as the function that defends the retention line, not the one that fills the top of funnel.
Key Takeaways
- Median B2B SaaS net revenue retention is 82% (ChartMogul, 2025, ~2,700 companies).
- Upper-quartile B2B SaaS NRR reaches 97%.
- B2C SaaS median NRR is only 49% on the same dataset.
- AI-native companies posted 40% median gross revenue retention, up from 27% in January 2025.
- Recurly's software-industry median annual churn is 3.04%, top quartile 1.78% or below.
- B2B professional-services churn runs 3.21% median on the same network.
- Enterprise accounts ($250+ ARPC) churn at 3.54%, but involuntary churn is just 0.18%.
- Benchmarkit's CY-2025 panel splits NRR at 95% (seat-based) vs 108% (usage-based).
- Gross revenue retention fell from 88% to 84% year over year (Benchmarkit CY-2025).
- Expansion revenue supplies 40% of net new ARR industry-wide.
- Median CAC payback is 16 months, top quartile 6 months or less.
- LTV:CAC sits at 4.1x median (vertical SaaS higher, at 5.6x).
- KeyBanc/Sapphire's 16th annual survey shows gross retention nearing 90%, up from 86% in 2023.
- Net retention has stayed above 100% for private SaaS in the same survey.
- ARR growth is accelerating from 15% to 20% year over year (2024 to 2025).
- A 5-point retention gain lifts profit 25% to 95% (Bain/Reichheld, 2001, still cited).
- 89% of leaders call personalization invaluable to growth (Twilio Segment, 2024, n=521).
- 73% agree AI will change personalization strategy in the same survey.
Benchmarks at a glance
| Metric | Median | Top quartile | Source (year) |
|---|---|---|---|
| Net revenue retention, B2B SaaS | 82% | 97% | ChartMogul (2025) |
| Net revenue retention, seat-based | 95% | — | Benchmarkit CY-2025 |
| Net revenue retention, usage-based | 108% | — | Benchmarkit CY-2025 |
| Gross revenue retention, private SaaS | ~90% (from 86% in 2023) | — | KeyBanc/Sapphire (2025) |
| Annual churn, software industry | 3.04% | 1.78% or below | Recurly (2026) |
| Annual churn, B2B professional services | 3.21% | 1.83% or below | Recurly (2026) |
Why net revenue retention is the lifecycle marketing scoreboard
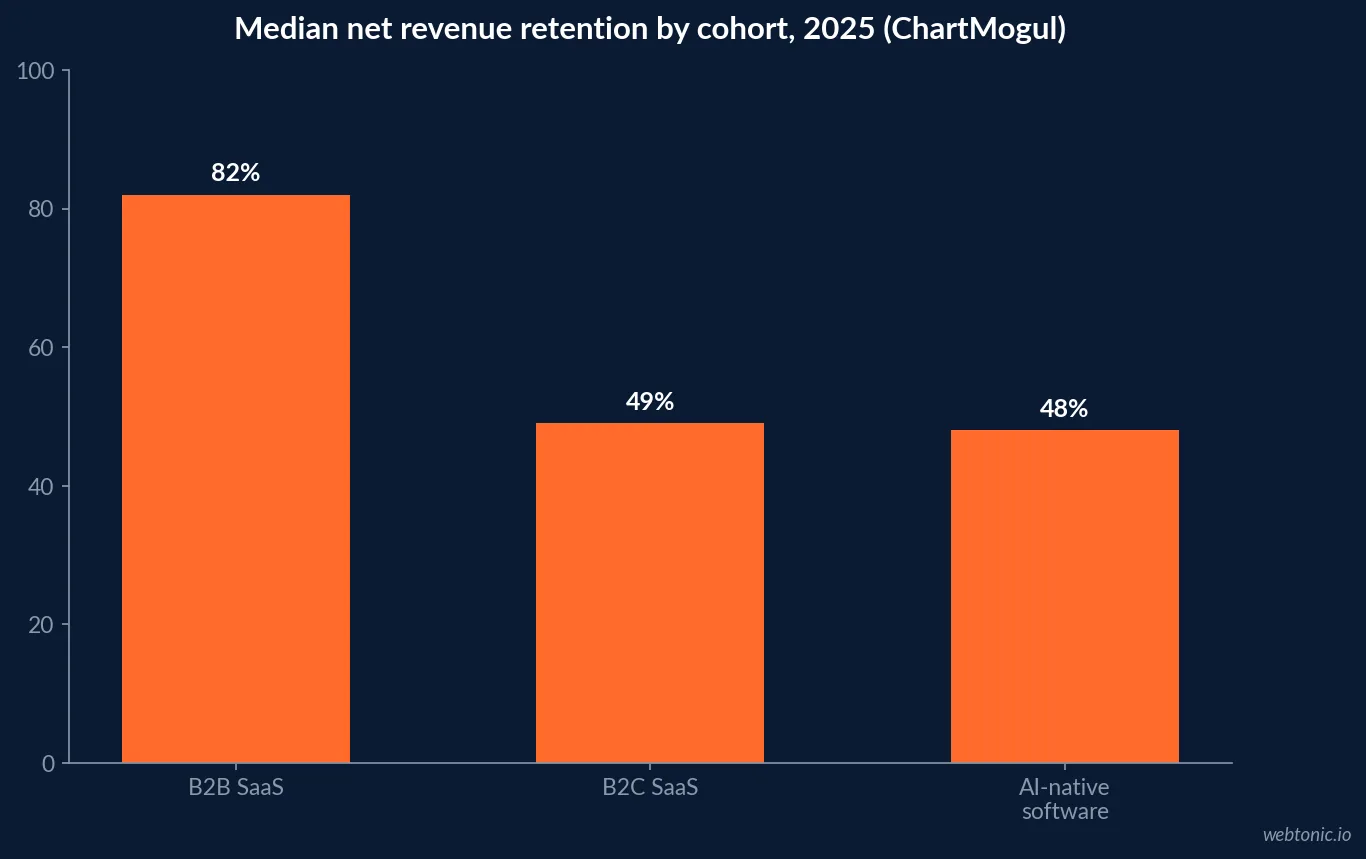
Every dollar a B2B SaaS company spends on new-logo acquisition is measured against how much of last year's revenue base survives without any new deals at all. ChartMogul's 2025 analysis of roughly 2,700 B2B SaaS companies with at least USD 250,000 in ARR found a median NRR of 82%, with the upper quartile at 97%. That is a company-level scoreboard for onboarding, adoption and renewal messaging, not for the acquisition channel that got the account in the door.
The same analysis is a caution against assuming every subscription business behaves the same way: B2C SaaS median NRR was only 49%, and AI-native companies (a mix of B2B and B2C) posted 40% median gross revenue retention, though that figure had already recovered from 27% in January 2025 as low-commitment early adopters churned out and more durable production usage replaced them.
Churn benchmarks by segment
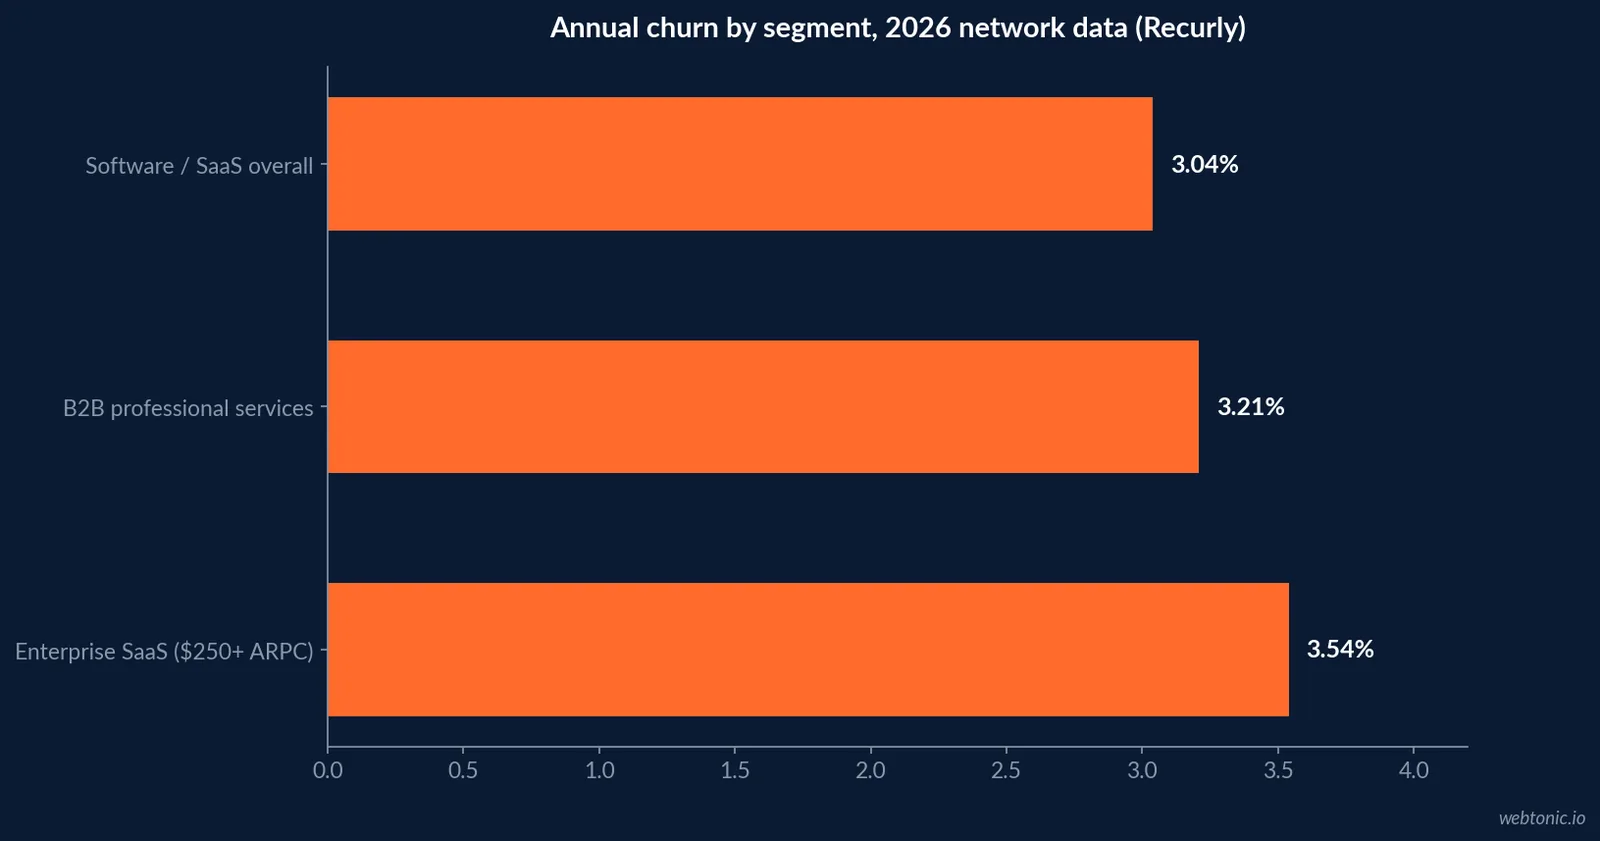
Recurly's churn-rate benchmarks, updated with July 2026 network data across its subscription-billing customer base, break the picture down by segment rather than reporting one blended number.
| Segment | Median annual churn | Top-quartile churn | Note |
|---|---|---|---|
| Software / SaaS overall | 3.04% | 1.78% or below | Recurly network, 2026 |
| B2B professional services | 3.21% | 1.83% or below | Longer contracts, higher switching cost |
| Enterprise SaaS ($250+ ARPC) | 3.54% | — | Involuntary churn only 0.18% |
| Ecommerce / D2C subscriptions | 4.25% | — | Shown for contrast, not B2B SaaS |
The enterprise-tier finding is counter-intuitive at first read: higher-ARPC accounts churn at a slightly higher headline rate than the software median, but almost none of it is involuntary, meaning failed-payment recovery flows matter far less at that tier than proactive renewal and expansion conversations do.
What the growth-stage panels add: CAC payback, LTV:CAC and expansion share
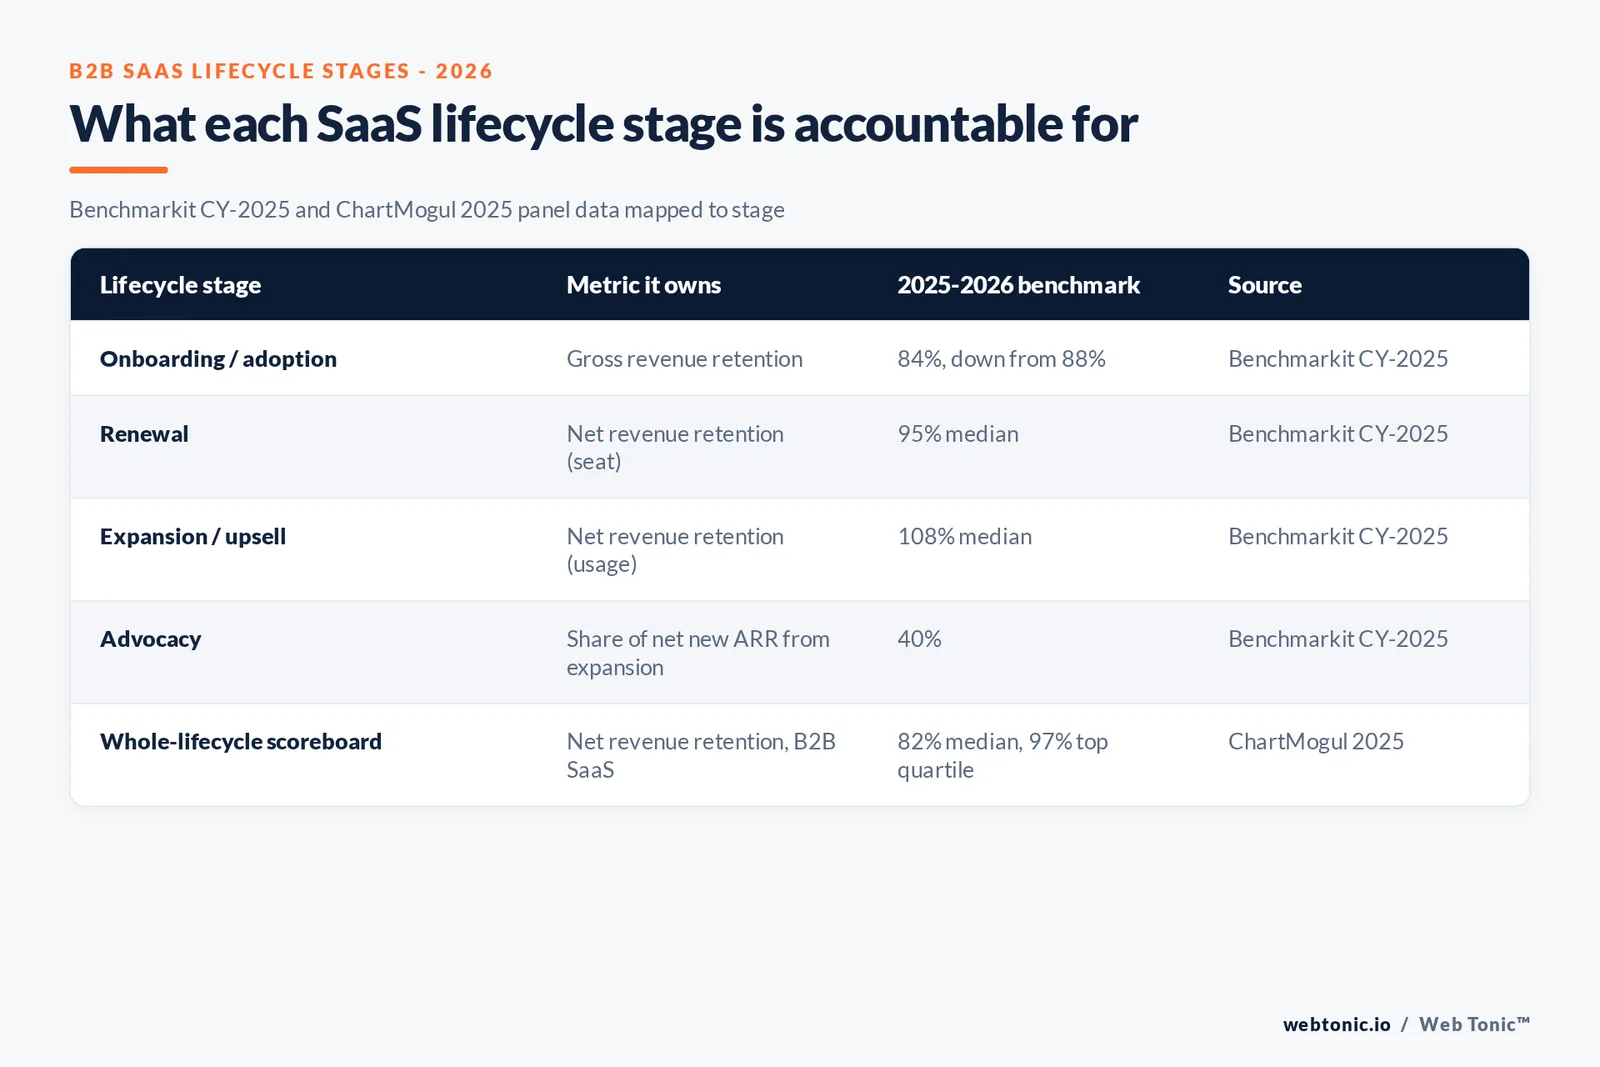
Benchmarkit's CY-2025 panel of primarily venture-backed software companies puts median CAC payback at 16 months (top quartile at 6 months or less, weak quartile at 24), LTV:CAC at 4.1x median (vertical SaaS higher, at 5.6x), and gross revenue retention falling from 88% to 84% year over year even as net revenue retention holds up. Expansion revenue now supplies 40% of net new ARR industry-wide, which is the clearest evidence that lifecycle marketing to the existing base, not new-logo marketing, is carrying growth.
The KeyBanc Capital Markets / Sapphire Ventures 16th annual Private SaaS Survey corroborates the direction: gross retention is approaching the 90% threshold after declining to 86% in 2023, net retention has stayed above 100%, and ARR growth is accelerating from 15% to 20% year over year from 2024 to 2025.
| Growth-panel metric | 2025 figure | Direction vs prior year | Source |
|---|---|---|---|
| CAC payback, median | 16 months | Up from 14 months (2023) | Benchmarkit CY-2025 |
| LTV:CAC, median | 4.1x | Vertical SaaS: 5.6x | Benchmarkit CY-2025 |
| Gross revenue retention | 84% | Down from 88% | Benchmarkit CY-2025 |
| Expansion share of net new ARR | 40% | 44% at low-growth firms | Benchmarkit CY-2025 |
| Gross retention, private SaaS | ~90% | Up from 86% (2023) | KeyBanc/Sapphire 2025 |
| ARR growth YoY | 20% | Up from 15% | KeyBanc/Sapphire 2025 |
Where lifecycle marketing budget should sit in the funnel
Twilio Segment's 2024 State of Personalization report, based on a survey of 521 senior B2B and B2C decision-makers at companies with 500+ employees, found 89% call personalization invaluable to business success over the next three years and 73% agree AI adoption will change personalization and marketing strategy. Neither figure is SaaS-specific, but both describe the exact motion lifecycle marketing depends on: matching message and timing to where an account sits in onboarding, adoption, renewal or expansion, not treating every contact as a cold lead.
Set against the retention data above, the budget case is straightforward: an account already inside the funnel that churns at 3 to 4% a year is cheaper to defend than it is to replace, and expansion revenue supplying 40% of net new ARR means the marketing function touching renewals and upsells is no longer a support role to acquisition marketing — on the numbers, it is a growth engine in its own right.
B2B SaaS vs. the average subscription business
| Dimension | B2B SaaS | B2C SaaS | AI-native software |
|---|---|---|---|
| Median NRR | 82% | 49% | 48% |
| Median GRR | Not separately reported | Not separately reported | 40% (up from 27%) |
| Typical annual churn | 3.04–3.21% | Higher (D2C ~4.25%) | Still stabilizing |
| What drives retention | Contract terms, switching cost, multi-seat | Self-serve, low switching cost | Usage maturing into production |
Where lifecycle email automation revenue actually comes from
Klaviyo's 2026 email marketing benchmarks, drawn from over 183,000 Klaviyo customers (vendor data, ecommerce-weighted but the clearest public flow-vs-campaign split available), found automated flows generate nearly 41% of total email revenue from just 5.3% of sends, with average revenue per recipient roughly 18 times higher than one-off campaigns. Flows also post 3x higher click rates (5.58% vs. 1.69%) than campaigns. For a B2B SaaS lifecycle program, that is the argument for building onboarding, renewal and win-back flows before spending more on one-off campaign sends. Mailchimp's own industry benchmark data, by contrast, reports blended average open rates around 35.6% and click rates around 2.6% across all industries and send types — useful as a floor to compare a SaaS flow program against, not a lifecycle-specific number.
Paddle's own SaaS Market Report series (via the ProfitWell Churn Index it maintains) recorded MRR churn hitting an all-time high of -1.85 in December 2023, a 7% year-over-year increase, before recovering — a reminder that the aggregate churn medians above move with the macro cycle, not just with lifecycle-program quality.
| Email motion | Share of total email revenue | Relative RPR | Source |
|---|---|---|---|
| Automated flows | ~41% | ~18x campaigns | Klaviyo 2026 (n=183,000) |
| One-off campaigns | ~59% (from 94.7% of sends) | Baseline | Klaviyo 2026 (n=183,000) |
| All-industry blended open rate | 35.6% avg. | — | Mailchimp benchmark data |
| All-industry blended click rate | 2.6% avg. | — | Mailchimp benchmark data |
Lifecycle marketing checklist for B2B SaaS teams
- Track NRR and GRR separately — Benchmarkit's gap (95% seat vs 108% usage) shows pricing model changes what "good" looks like.
- Segment churn reporting by ARPC tier; Recurly's data shows enterprise accounts need renewal conversations, not payment-recovery automation.
- Instrument the onboarding-to-adoption handoff — it is the stage most cited in growth-panel commentary as where expansion revenue is won or lost.
- Report expansion revenue as a growth metric to the board, not a retention footnote — it is already 40% of net new ARR industry-wide.
- Revisit personalization investment at the renewal and expansion stages before adding acquisition spend, per Segment's 89% invaluable-to-growth finding.
Common mistakes in B2B SaaS lifecycle marketing
- Reporting NRR without segmenting by pricing model, which hides whether the real driver is usage growth or seat growth.
- Treating involuntary churn as the whole churn problem at the enterprise tier, where Recurly's data shows it is only 0.18% of the 3.54% figure.
- Under-resourcing renewal-stage messaging while gross revenue retention slides, as it has from 88% to 84% industry-wide on Benchmarkit's panel.
- Citing the 25-to-95% Bain/Reichheld profit lift as if it were new research — it is decades old and industry multipliers vary; use it directionally, not as a specific ROI promise.
Related benchmarks
For channel-specific retention data that complements the account-level figures above, see Web Tonic's customer retention statistics, customer lifetime value statistics and email marketing statistics pages, or the data intelligence service page for how this kind of retention reporting gets built.
Frequently Asked Questions
What is a good net revenue retention rate for B2B SaaS?
ChartMogul's 2025 scrape of roughly 2,700 B2B SaaS companies puts the median NRR at 82%, with the upper quartile at 97%. Benchmarkit's CY-2025 survey of primarily venture-backed software companies splits it further: 95% median NRR for seat-based pricing against 108% for usage-based pricing. Above 100% means expansion revenue from existing accounts is outrunning contraction and churn combined; below 90% is the range where most boards start asking pointed questions about the lifecycle motion.
What is the average SaaS churn rate in 2026?
Recurly's July 2026 network data, drawn from its subscription-billing customer base, shows a median annual churn rate of 3.04% for software businesses, with top-quartile performers at 1.78% or below. B2B-specific: Business and Professional Services on the same network runs a 3.21% median. Enterprise accounts paying $250 or more in average revenue per customer churn at 3.54% annually but only 0.18% of that is involuntary (failed payments), against far higher involuntary shares at lower price points.
Is B2C SaaS retention really that much worse than B2B?
On ChartMogul's dataset, yes. Median NRR for B2C SaaS was 49% against 82% for B2B, and AI-native companies (a mix of B2B and B2C) came in even lower on gross revenue retention, at 40% median, though that figure had already climbed from 27% in January 2025 as early low-commitment users churned out. The gap is a business-model story, not a tactics story: B2B contracts carry switching costs and renewal cycles that B2C subscriptions do not.
Does higher retention really change SaaS valuation?
Reichheld's Bain-published research, cited since the 2001 book Loyalty Rules! and still the reference point 25 years later, found that a five-percentage-point increase in customer retention lifts profits by 25% to 95%, with the range driven by how expensive acquisition is in that category. It is old research and industry-specific multipliers vary, but the direction has not been overturned by newer subscription data: Benchmarkit's CY-2025 panel shows expansion revenue from existing accounts now supplies 40% of net new ARR industry-wide.
Where should B2B SaaS lifecycle marketing spend concentrate first?
On the numbers that move fastest: Benchmarkit's CY-2025 panel puts median CAC payback at 16 months (top quartile at 6 months or less) and gross revenue retention has fallen from 88% to 84% year over year, which is the line lifecycle marketing is meant to defend before it becomes a churn problem. Twilio Segment's 2024 survey of 521 senior marketing/CX decision-makers found 89% call personalization invaluable to growth over the next three years, which tracks with onboarding and renewal-stage messaging carrying more weight than acquisition-stage messaging in a seat-based or usage-based motion.
Sources
ChartMogul — The SaaS Retention Report: The AI Churn Wave (2025)
Recurly — Churn Rate Benchmarks (2026 network data)
Recurly — State of Subscriptions 2026
KeyBanc Capital Markets / Sapphire Ventures — 16th Annual Private SaaS Survey (2025)
Bain / Frederick Reichheld — Loyalty Rules! (Harvard Business School Press, 2001)
Twilio Segment — State of Personalization 2024 (n=521)
Klaviyo — 2026 Email Marketing Benchmarks (n=183,000 customers)
Paddle — SaaS Market Report, ProfitWell Churn Index
Mailchimp — Email Marketing Benchmarks & Industry Statistics