Table of contents
A conversion in marketing is any visitor action you decided in advance counts as progress: a purchase, a form fill, a call, a signup. The rate is simply conversions divided by the audience that could have converted.
Key Takeaways
- A conversion is a pre-defined action, not a feeling — if it is not written down and tracked, it is not a conversion.
- Average macro conversion rate across industries sits near 2.9%, while search ads average 7.52% because intent is higher.
- Micro conversions happen 10-50x more often than macro ones, which makes them the faster feedback loop for testing.
- Google Analytics renamed conversions to key events, so the same action can carry two different names in two reports.
- Most conversion reporting disputes come from 5 repeatable measurement traps, not from creative or bidding.

What is a conversion in marketing?
A conversion in marketing is a single, pre-defined action that a person takes in response to your marketing — buying, submitting a form, calling, booking, subscribing or downloading — which your business has agreed to count as a step toward revenue. It is a definition you choose, not a metric the platform chooses for you.
That last point is where most confusion around conversion marketing starts. Two teams looking at the same website can report wildly different conversion numbers because one counts every newsletter signup and the other counts only paid orders. Neither is wrong. They are answering different questions with the same word.
So a usable definition of a conversion has three parts: the action (what the user did), the trigger (the technical event that records it) and the value (what that action is worth to the business). Drop any one of the three and your conversion data stops being decision-grade.
| Component | Question it answers | Example | What breaks without it |
|---|---|---|---|
| Action | What must the visitor do? | Submit the quote request form | Teams argue about what counts |
| Trigger | How is it recorded? | generate_lead event on thank-you page | Numbers cannot be audited |
| Value | What is it worth? | $180 average closed value | Bidding optimises to the wrong action |
| Window | How long after the click does it count? | 30-day click, 1-day view | Channels get credited unevenly |
| Owner | Who defends the number? | Growth lead, reviewed monthly | Definitions drift silently |
Macro vs micro conversions
Nielsen Norman Group splits conversions into two tiers: macro conversions that directly serve a business goal, and micro conversions that precede them. Their research puts the average macro conversion rate at just 2.9%, which is why teams that track only macro conversions in marketing wait weeks before a test produces a readable signal. Micro conversions — scroll depth, pricing-page views, add-to-cart, video completions — fire constantly and let you diagnose which step of the journey leaks. NN/g's macro vs micro conversion framework is the cleanest starting point, and VWO's CRO breakdown maps each tier to KPIs.
| Conversion tier | Typical rate | Frequency | Best used for | Risk if used alone |
|---|---|---|---|---|
| Macro — purchase | 1-3% | Low | Revenue reporting, ROAS | Slow test read-outs |
| Macro — qualified lead | 3-8% | Low-medium | Smart bidding targets | Lead quality drift |
| Micro — add to cart | 8-12% | High | Checkout diagnostics | Optimises to browsers |
| Micro — pricing page view | 15-25% | High | Intent segmentation | No revenue link |
| Micro — email click | 2-5% | Very high | Creative and subject testing | Vanity reporting |
The conversion types marketers actually track
The word conversion covers a dozen different marketing actions, and the mix you choose determines which campaigns look successful. A B2B team with a 90-day sales cycle and an ecommerce team shipping same-day should not be tracking the same primary conversion.
| Conversion type | Counts as | Where it fires | Assign value how |
|---|---|---|---|
| Purchase | Macro | Order confirmation | Dynamic order value |
| Quote or demo request | Macro | Form thank-you | Close rate x average deal |
| Phone call over 60 seconds | Macro | Call tracking platform | Same as a form lead |
| Booked appointment | Macro | Scheduler webhook | Show rate x deal value |
| Free trial start | Macro | Signup success | Trial-to-paid rate x LTV |
| Newsletter signup | Micro | Form submit | Email revenue per subscriber |
| Add to cart | Micro | Cart event | Cart-to-order rate x AOV |
| Content download | Micro | Gated asset | MQL rate x lead value |
| Store or directions click | Micro | Maps interaction | Visit-to-sale rate |
| Chat conversation started | Micro | Widget open plus reply | Chat-to-lead rate |
How to calculate conversion rate
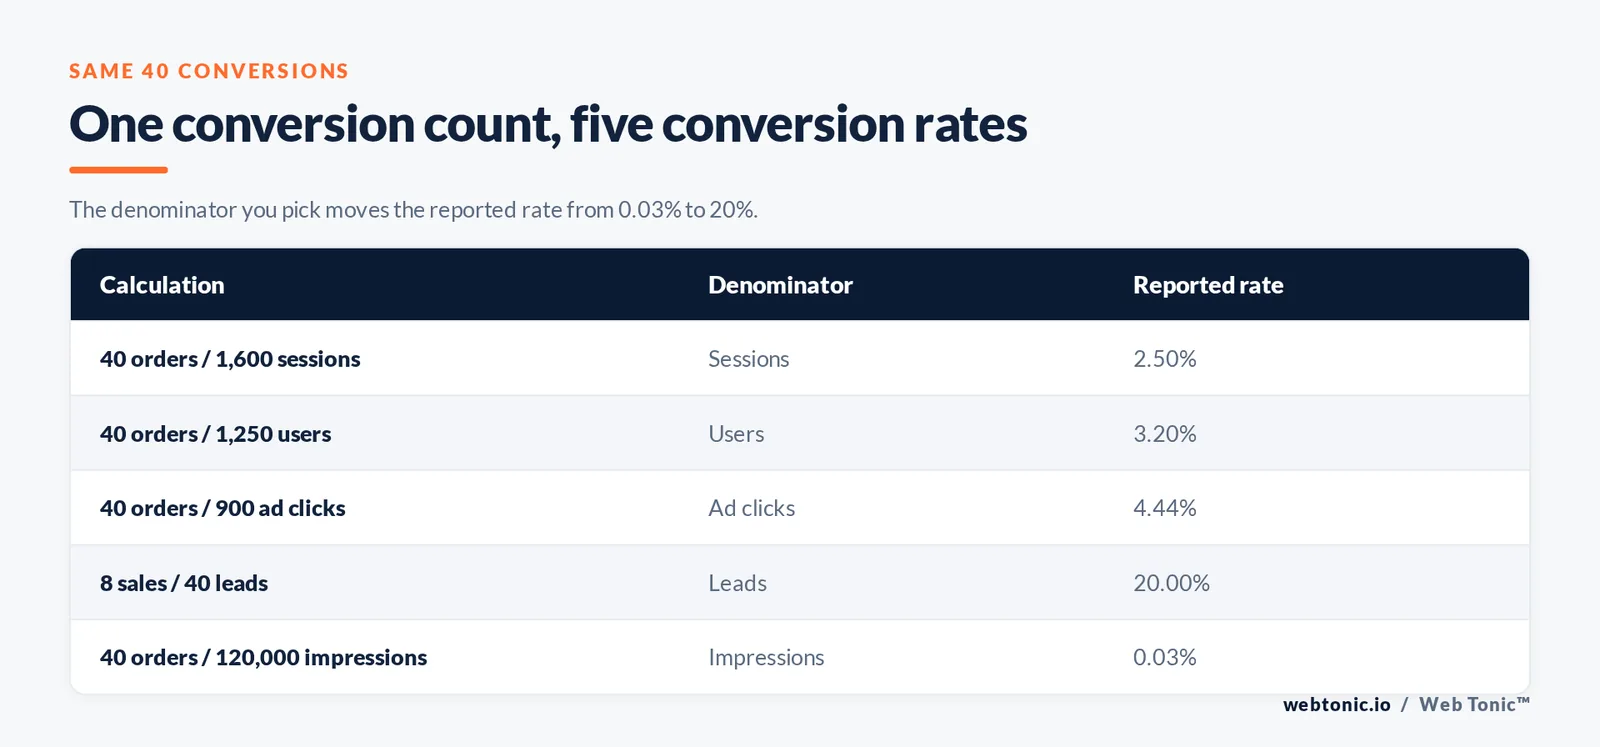
Conversion rate is conversions divided by the denominator you choose, times 100. The formula is trivial; the denominator is where reporting fights start. Sessions, users, clicks and impressions all produce a different conversion rate from identical conversions.
| Denominator | Formula | Worked example | Resulting rate | Use it for |
|---|---|---|---|---|
| Sessions | 40 orders / 1,600 sessions | Website reporting | 2.50% | Site and landing page trends |
| Users | 40 orders / 1,250 users | Person-level view | 3.20% | Cohorts and retention |
| Ad clicks | 40 orders / 900 clicks | Paid media reporting | 4.44% | Bidding and channel comparison |
| Leads | 8 sales / 40 leads | Sales-stage view | 20.00% | Lead quality checks |
| Impressions | 40 orders / 120,000 impressions | Awareness view | 0.03% | Reach-heavy campaigns only |
Rule 1 — publish the denominator next to every conversion rate in your reporting. The same 40 conversions above produced rates from 0.03% to 20% without a single number changing.
Conversion rate benchmarks by channel
Benchmarks are context, not targets. Still, they stop teams from celebrating a 1% ecommerce rate or panicking over a 4% B2B rate. WordStream's 2025 analysis puts the average Google Ads conversion rate at 7.52% across 23 categories, with automotive repair at 14.67% and finance and insurance at 2.55% — a 5.8x spread driven almost entirely by intent and friction, not by ad quality. See the full Google Ads benchmark study, and our own breakdown of average click-through rates for the step before the conversion.
| Marketing channel | Typical conversion rate | Primary conversion | Why it lands there |
|---|---|---|---|
| Paid search (high intent) | 7.5% | Lead or purchase | User is actively searching |
| Email to existing list | 4-6% | Repeat purchase | Pre-existing relationship |
| Organic search | 2-4% | Mixed micro and macro | Broad research intent |
| Paid social | 1-3% | Purchase or lead | Interruption, not intent |
| Display and video | 0.1-1% | Assisted conversions | Upper-funnel role |
How conversion tracking actually works
Every conversion you report is the output of a tracking chain: a user action fires an event, the event is sent to a platform, the platform matches it to a click or a session, then attributes credit. Google Analytics now calls these key events and reserves the word "conversion" for actions imported into Google Ads, which is why one action can appear under two names — the key event setup guide and the GA4 event reference spell out the split. On the ads side, conversion tracking setup and counting and window settings decide whether one purchase counts once or every time.
| Tracking method | How it records the conversion | Strength | Weakness |
|---|---|---|---|
| Client-side tag | Browser fires event via gtag or GTM | Fast to deploy | Lost to blockers and consent |
| Server-side tagging | Event relayed from your server | More durable, controllable | Engineering cost |
| Offline import | CRM uploads closed deals back to the ad platform | Optimises to revenue, not forms | Needs clean click IDs |
| Call tracking | Dynamic number swaps per source | Captures phone-led buyers | Extra vendor and cost |
| Coupon or self-report | Buyer states the source at checkout | Works without cookies | Sparse, biased sample |
Rule 2 — one primary conversion per campaign objective. Accounts that hand smart bidding 6 or 7 equally weighted conversion actions almost always end up optimising toward the cheapest, least valuable one. Attribution settings compound that: read the attribution model documentation before comparing two channels' conversion counts.
Conversion goals by business model
The right primary conversion depends on how money reaches your bank account. This is the table we build with clients during measurement setup before a single campaign goes live.
| Business model | Primary conversion | Secondary conversion | Value method | Watch out for |
|---|---|---|---|---|
| Ecommerce | Purchase with value | Add to cart | Dynamic revenue | Returns inflating ROAS |
| Local services | Call over 60 seconds | Form submit | Booked-job value | Spam and wrong-number calls |
| B2B SaaS | Qualified demo | Trial start | Pipeline stage value | Free-mail signups |
| Marketplace | First completed transaction | Profile completion | Take rate x GMV | Supply-side conversions mixed in |
| Publisher or media | Paid subscription | Newsletter signup | Retained months x price | Ad revenue counted twice |
| Nonprofit | Donation | Volunteer signup | Average gift x repeat rate | One-off campaign spikes |
Conversions by funnel stage
A conversion is not only a bottom-of-funnel purchase. Mapping one measurable conversion action to each stage of the journey is what turns a marketing funnel from a slide into a dashboard, and it is the backbone of the growth marketing programmes we run.
| Funnel stage | Conversion action | Realistic rate | Optimisation lever |
|---|---|---|---|
| Awareness | Engaged session over 30 seconds | 35-55% | Message-to-audience match |
| Interest | Pricing or product page view | 15-25% | Navigation and proof |
| Consideration | Add to cart or configurator use | 8-12% | Objection handling |
| Action | Purchase, call or booked demo | 2-8% | Friction removal |
| Retention | Second order or renewal | 20-30% | Lifecycle email |

Seven ways to lift your conversion rate
Once conversions in marketing are defined and tracked, improvement is a queue of experiments ranked by effort against expected lift. Structured testing beats opinion: both Optimizely and VWO publish the statistical ground rules, and NN/g's product-page research covers the usability side.
| Lever | What to change | Typical lift | Effort |
|---|---|---|---|
| Form length | Cut fields from 8 to 3-4 | High | Low |
| Headline clarity | State the offer in plain language | Medium-high | Low |
| Message match | Mirror the ad promise on the page | High | Medium |
| Page speed | Compress media, defer scripts | Medium | Medium |
| Social proof placement | Reviews beside the CTA | Medium | Low |
| Checkout or booking steps | Remove one step, add guest option | High | High |
| Offer framing | Test guarantee, bundle or financing | High | Medium |
Limit 3 — do not run a landing page test on fewer than 200 conversions per variant unless you accept a coin-flip result. Small samples produce big, fake winners. Claims on those pages also have to hold up: the FTC's advertising guidance applies to conversion copy as much as to ads, and plain wording usually wins anyway per federal plain-language guidelines.
Five traps that corrupt conversion data
Almost every "our conversions dropped" escalation traces back to one of these five, not to the market. Work the list top-down before touching bids or creative — and if you are moving from measurement into optimisation, our guide to conversion rate optimization picks up where this page stops.
| Trap | Symptom | Root cause | Fix |
|---|---|---|---|
| Trap 1 — double counting | Conversion rate above 30% | Tag fires on reload or two tools count once each | Set counting to one per click |
| Trap 2 — definition drift | Overnight jump with no traffic change | Someone added a micro action as primary | Version-control conversion definitions |
| Trap 3 — window mismatch | Platform and CRM disagree by 20-40% | 7-day vs 30-day windows | Align windows before comparing |
| Trap 4 — consent gaps | Slow, steady decline in tracked conversions | Consent banner blocks tags | Server-side tagging plus modelling |
| Trap 5 — spam leads | Cheap conversions, flat revenue | Bot form fills counted as leads | Honeypot, CAPTCHA, qualified-lead import |
Step 4 — audit the chain quarterly. In our experience roughly 1 in 3 accounts we inherit has at least one broken or duplicated conversion action, and every optimisation decision made before that fix is built on sand. If you want a second pair of eyes on your setup, that is what our measurement audits exist for, alongside the landing page build work that follows.

FAQ
What counts as a conversion in marketing?
Any action you defined in advance as valuable and can record: a purchase, a lead form, a qualifying phone call, a booking, a trial start, a subscription or a meaningful download. If it is not defined and tracked, it is traffic, not a conversion.
What is the difference between a conversion and a conversion rate?
A conversion is one completed action. A conversion rate is the share of a defined audience that completed it — conversions divided by sessions, users, clicks or leads, times 100. Always state which denominator you used.
What is a good conversion rate?
It depends on channel and industry. Search ads average around 7.52%, ecommerce sites typically land between 1% and 3%, and lead-gen landing pages often sit between 4% and 9%. Compare against your own trailing 12 months first, benchmarks second.
Are micro conversions worth tracking?
Yes. They occur far more often than purchases, so they show which stage of the journey leaks and give tests a readable signal within days. Just never let a micro conversion become the bidding target for a revenue campaign.
Why do Google Analytics and Google Ads report different conversions?
Different attribution models, different lookback windows, different counting rules and different names — Analytics logs key events while Ads reports conversions. Align windows and models before you treat the gap as an error.
Sources: Nielsen Norman Group, Macro vs. Micro Conversions (2024) · WordStream, Google Ads Benchmarks 2025 · Google Analytics Help, Set up a key event · Google Ads Help, About conversion tracking and conversion counting · Google Analytics Help, About attribution models · Optimizely and VWO A/B testing documentation · U.S. Federal Trade Commission, Advertising and Marketing Business Guidance · plainlanguage.gov, Federal Plain Language Guidelines. Figures reflect the most recent published data at time of writing.