



Table of contents

Website analytics benchmarks only help when the metric definitions and populations match. Contentsquare’s 2025 Digital Experience Benchmarks analyzed more than 90 billion sessions across 6,000 websites and reported that slow-loading content contributed to 53% of users exiting after a single page view. That is a specific reported finding, not a universal bounce-rate target.
Key Takeaways
- Contentsquare analyzed 90 billion+ sessions across 6,000 websites in its 2025 report.
- 53% of users exited after one page view when content loaded slowly, according to Contentsquare’s 2025 report.
- Conversion rates fell 6.1% year over year in the Contentsquare benchmark’s 2024 dataset.
- Ruler reported a 5.13% overall conversion average for 2026 across 13 industries.
- Ruler’s dataset included 110 million+ sessions and 5 million+ conversions.
- WordStream analyzed more than 16,000 search-ad campaigns for its 2025 CTR benchmarks.
- Google organic CTR varies by query, position, device and SERP features; position alone is insufficient context.
- Analytics bounce, ad CTR and organic search CTR have different denominators.
Three metric families, three different denominators
“Bounce rate” describes session behavior; click-through rate describes clicks relative to impressions or deliveries; conversion rate describes a defined outcome relative to visitors, sessions or leads. Those distinctions sound obvious until a dashboard places all three beside each other without naming the denominator.
For every reported rate, document numerator, denominator, deduplication, date range and eligible population. A metric dictionary is not overhead: it makes trend comparisons reproducible when analytics platforms or consent settings change.
Bounce rate depends on the product definition
Analytics tools do not all define a bounce identically. Google Analytics 4’s bounce rate is the inverse of engagement rate: the share of sessions that were not engaged. A session counts as engaged under GA4 rules when it lasts longer than 10 seconds, includes a key event, or has at least two page or screen views. This is different from older universal analytics interpretations of a one-page visit.
Contentsquare’s 2025 report found that 53% of users exited after viewing one page when content loaded slowly. That is a user-experience observation in its dataset, not the same measurement as GA4 bounce rate. Label both accurately.
| Metric family | Source and year | Published result | Comparable only when |
|---|---|---|---|
| Experience sessions | Contentsquare 2025 | 90B+ sessions / 6,000 sites | Segment + study period align |
| Visitor conversion | Ruler 2026 | 5.13% overall average | Same conversion event and sector |
| Search ad CTR | WordStream 2025 | 6.66% Google search ads | Search campaign/network match |
| Organic CTR | Backlinko analysis | 27.6% position-one result | Rank, query and SERP features match |
| Mobile bounce | Fullstory 2025 index | 48.04%, up from 31.18% | Same platform definition/device cohort |
Contentsquare’s digital experience context
Contentsquare’s 2025 Digital Experience Benchmarks analyzed more than 90 billion sessions, 389 billion page views and 6,000 websites, covering same-site activity primarily from Q4 2023 through Q4 2024. The report says conversion rates declined 6.1% year over year while the cost of an online visit rose 9% in the analyzed period.
Its dataset is broad, but it represents organizations using Contentsquare and has a platform-level methodology. Treat it as a view into observed digital experiences, not as a probability sample of every website.
CTR is not one metric
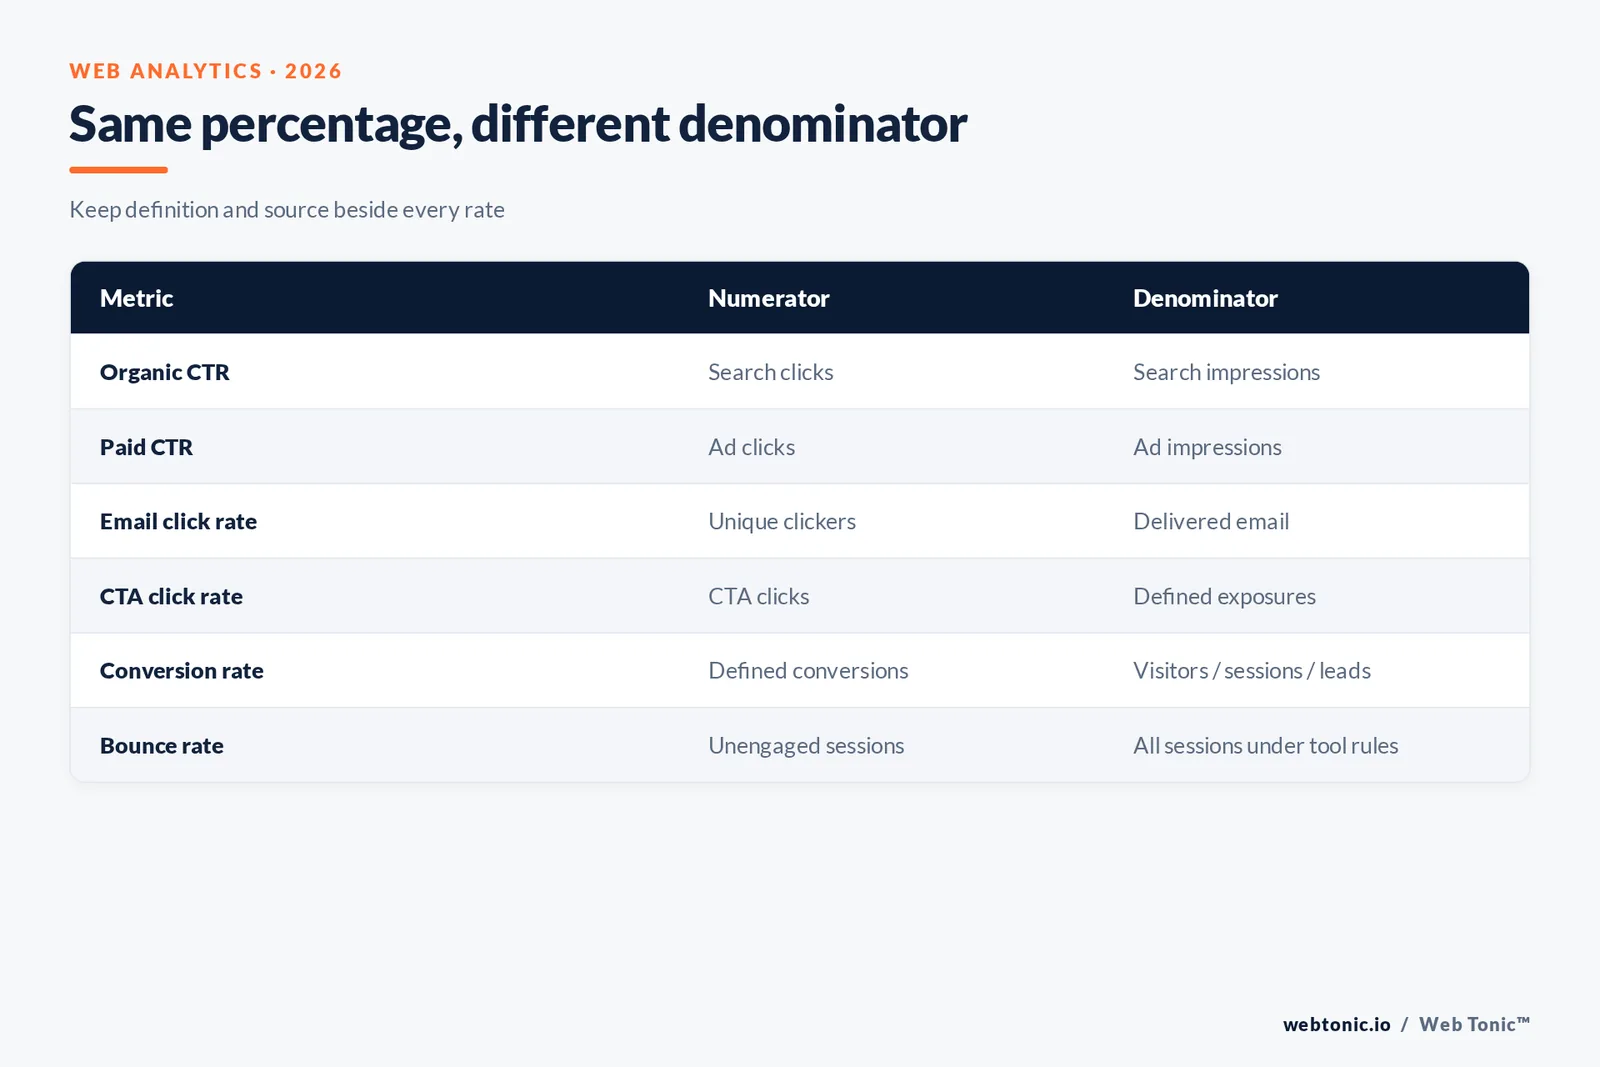
Search result CTR is clicks divided by impressions in a search-results context. Paid ad CTR is clicks divided by ad impressions. Email click rate is unique recipients clicking divided by delivered emails, depending on the publisher’s definition. Onsite CTA CTR may mean clicks divided by page views, sessions or button exposures. Each answers a different question.
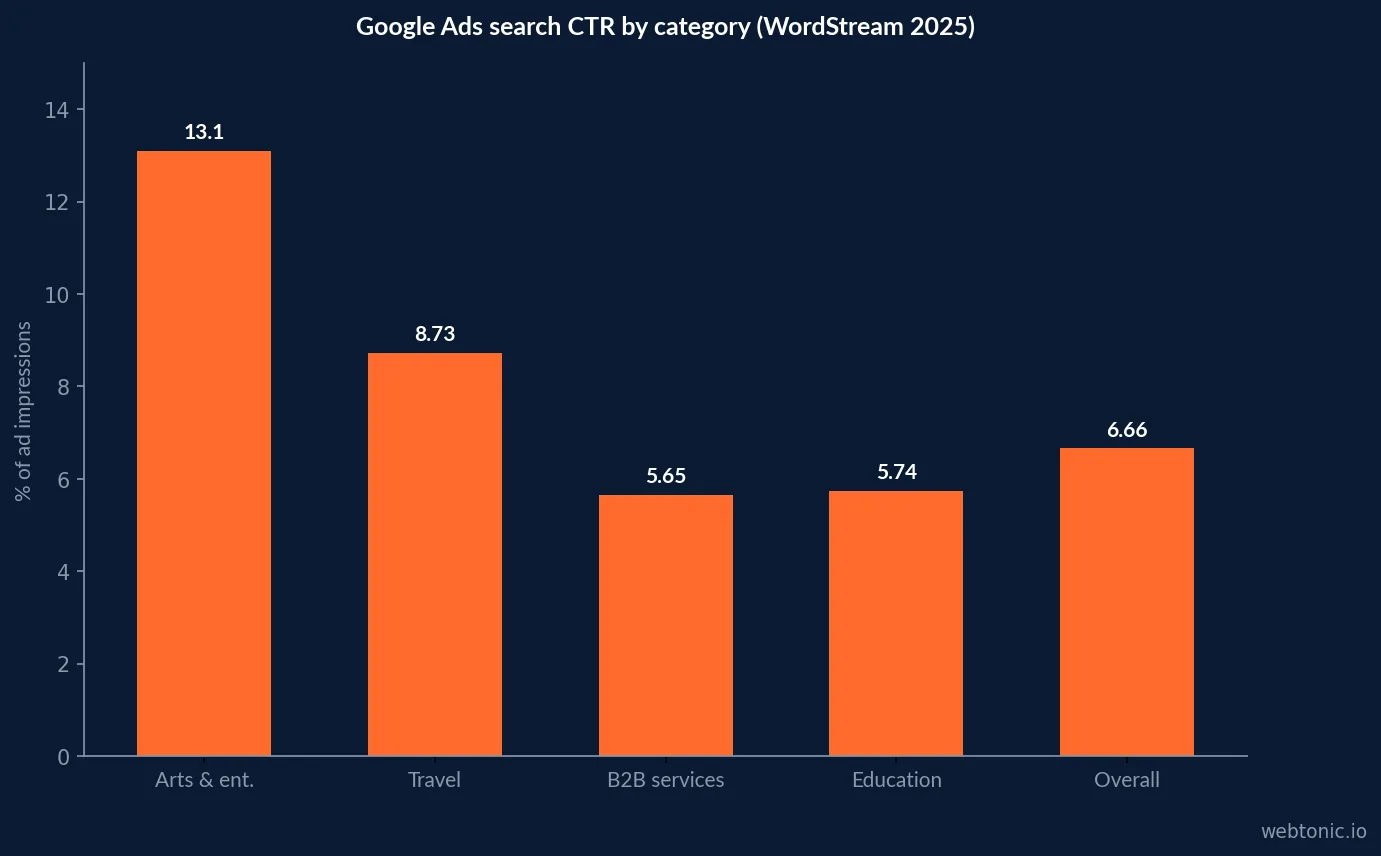
For paid search, WordStream’s 2025 benchmarks analyzed more than 16,000 campaigns and report an average Google Ads search CTR of 6.66%. That is an advertising metric; do not put it beside organic search CTR as though they were the same sample.
Benchmark table: definitions before comparisons
The external figures below come from distinct studies. Their populations and definitions must remain attached to each value. Use the table to orient a diagnosis, then build the comparison against your own consistent segment.
| Metric / issuer | Published figure | Measurement context | Do not infer |
|---|---|---|---|
| Contentsquare 2025 | 90B+ sessions; 6,000 websites | 2024 experience data | Random sample of all web |
| Contentsquare 2025 | Conversion rate -6.1% YoY | Observed across report dataset | Every site declined equally |
| Contentsquare 2025 | 53% single-page exits when content slow | Reported speed/friction finding | GA4 bounce rate equals 53% |
| Ruler Analytics 2026 | 5.13% conversion average | 13 industries; 110M+ sessions | Universal ecommerce target |
| WordStream 2025 | 6.66% Google Ads search CTR | 16,000+ ad campaigns | Organic search CTR |
Conversion benchmarks: audience and event matter
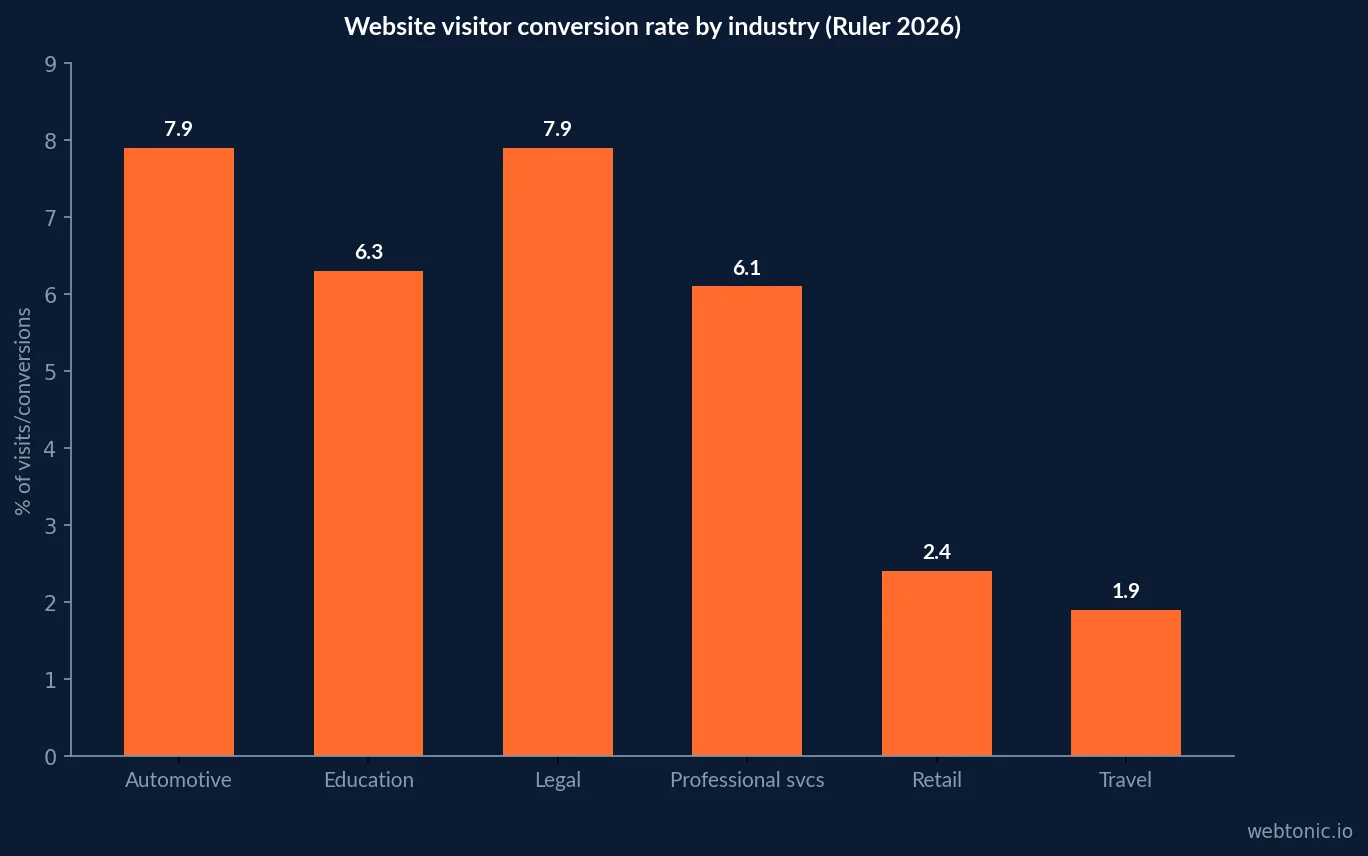
Ruler Analytics’ 2026 conversion-rate analysis reports an overall average of 5.13% across 13 industries, based on more than 110 million sessions, five million conversions and tracked spend. Ruler describes its global database as primarily higher-budget advertisers and marketers pursuing high-value leads; the measure captures website visitor conversion as defined in its reporting.
That is not a universal ecommerce checkout benchmark. Lead-generation sites can count calls, forms and chats; online stores count orders; SaaS sites may measure trial starts or paid upgrades. State the conversion event and whether the rate is session- or visitor-based.
| CTR type | Numerator | Denominator | Best comparison |
|---|---|---|---|
| Organic search CTR | Search clicks | Search impressions | Query, position, device and SERP |
| Paid search CTR | Ad clicks | Ad impressions | Campaign type and network |
| Email click rate | Unique email clickers | Delivered emails | Audience and email purpose |
| On-page CTA CTR | CTA clicks | Defined exposures or sessions | Page, device and CTA placement |
| Conversion rate | Defined conversions | Visitors, sessions or leads | Same event and attribution window |
Averages conceal channel and device mix
Aggregate bounce or conversion rates can move because traffic mix moved. A paid-social campaign may bring a different intent profile from branded search; mobile sessions may behave differently from desktop. Contentsquare’s research reported paid social traffic increases alongside higher bounce rates and lower conversions for sites increasing reliance on the channel. The relationship should be interpreted as observed association in the study, not a causal effect for every account.
Segment by channel, device, landing page and new-versus-returning status before recommending a site redesign. Compare like with like, then inspect the journey where the change appears.
Fullstory’s 2025 Behavioral Data Index analyzed 9.5 billion web sessions, 4.1 billion mobile sessions and 945 billion events. It reported mobile bounce rising from 31.18% in 2024 to 48.04% in 2025 in the report’s dataset. This behavioral platform sample is a device-specific observation, not a target for all mobile websites. See Fullstory’s methodology and findings.
The practical analytics scorecard
A compact monthly scorecard should pair acquisition and experience measures: sessions by source, engaged-session rate, bounce rate with the platform definition, landing-page conversion rate, revenue or qualified-lead rate, and tracking coverage. Show both rate and volume so a change from a tiny base does not masquerade as a major business shift.
Add data-quality status beside the trend: consent rate, missing campaign parameters, event delivery, duplicate conversions and referral exclusions. If instrumentation changes, mark the break in the series rather than presenting the post-change value as a seamless continuation.
How to interpret an outlier
Start by checking whether the definition, tag, consent mode, campaign mix or site release changed. Then compare page speed, landing-page relevance and device cohorts. A high bounce may be acceptable for a one-answer help page; a low bounce may simply reflect an event configuration that fires on every interaction.
Use behavior tools and server-side records as corroboration, not as a replacement for the measurement contract. Confirm that the event represents user intent and that automated traffic is handled consistently.
| Diagnostic signal | Check first | Useful segment | Validation metric |
|---|---|---|---|
| Bounce rises | GA4 definition, consent, event tags | Channel × landing page × device | Engaged sessions and conversion |
| CTR falls | Impression mix, rank, SERP changes | Query × position × device | Clicks and qualified visits |
| Conversion falls | Form/checkout errors, traffic intent | Landing page × source | Completed qualified outcomes |
| Rate rises abruptly | Duplicate or broadened event firing | Event name × release date | Server/CRM reconciled count |
| Channels shift | UTM loss and referral attribution | Source × medium × campaign | Tagged session coverage |
Click-through benchmarks and search changes
Organic search CTR depends on rank and the visible result page, including ads, AI summaries, maps, featured snippets, branded intent and device. Advanced Web Ranking’s 2025 quarterly analysis compares CTR across thousands of sites and millions of keywords, illustrating that position-level CTR changes with query and device context. GrowthSRC’s 2025 GSC study of more than 200,000 keywords across 30 sites reported a 17.92% average decline across positions one to five year over year in its sample.
Do not use a single position-one CTR as a forecast for all queries. Compare matched query sets over the same period and segment by SERP appearance where the data permits.
For organic CTR, Backlinko’s analysis of four million Google results reported a 27.6% average CTR for position one, while later work and SERP features change what a result actually receives. Consider this a historical study result last updated in 2025, not a 2026 universal rate. The underlying study uses a distinct search-result sample. A useful companion is an internal paid-search measurement guide, which covers paid performance rather than organic rankings.
| Change signal | Likely measurement issue | Likely experience issue | First validation step |
|---|---|---|---|
| Bounce jumps on one day | Tag, consent or route change | Campaign landing mismatch | Check deploy and source cohort |
| CTR drops at stable rank | SERP display changed | Title no longer fits intent | Segment query + device |
| Conversion halves | Duplicate/missing event | Form or payment friction | Compare browser and backend |
| Mobile only worsens | Responsive tag failure | Speed/layout issue | Test real device and network |
| Direct rises sharply | UTM loss or referrer stripping | Offline/media spike unlikely | Inspect redirects and landing URLs |
A repeatable quarterly benchmark method
Freeze the metric definitions, data source, dates and segment rules. Keep an internal baseline for the same quarter in the previous year and for the preceding quarter. Add an external comparison only when its population and event definitions are close enough to be meaningful. Report medians and distributions where the data is skewed.
After diagnosing the signal, test one intervention—page relevance, speed, CTA placement or campaign targeting—and evaluate the cohort on a declared outcome. Benchmarking tells you where to investigate; it does not explain why a metric moved.
For conversion definitions, pair this benchmark with a documented analytics and data model, an acquisition plan from growth marketing, and a review of the paid-search investment context. These internal resources do not substitute for matching the external studies’ populations.
When a dashboard reports a benchmark, preserve the query or export, the source system and the calculation. A screenshot without the underlying denominator makes it impossible to establish whether the number changed because of visitor behavior or because the instrumentation changed.
Frequently Asked Questions
What is a good website bounce rate in 2026?
There is no universal target because analytics products define engagement differently and site purpose changes expected behavior. Contentsquare’s 2025 Digital Experience Benchmarks reported that slow-loading content was associated with 53% of users exiting after viewing one page. Treat that as a reported observation, not a target for every site.
What is a good conversion rate?
It depends on the conversion event and population. Ruler Analytics’ 2026 analysis reported a 5.13% overall average across 13 industries using more than 110 million sessions and five million conversions, but that platform dataset includes lead-based businesses and is not interchangeable with ecommerce conversion benchmarks.
How should I benchmark click-through rate?
Separate organic search CTR, paid ad CTR, email click rate and onsite CTA CTR. They have different denominators. For example, the 2025 WordStream search-ad benchmark is based on 16,000+ campaigns, while Google organic click-through studies use search-result impressions.
Why can my bounce rate rise while conversions improve?
A change in traffic mix, landing-page purpose, consent or event instrumentation can alter bounce rate independently of conversion quality. Segment by channel, landing page and device, verify analytics definitions, and inspect the conversion event before drawing a causal conclusion.
How often should analytics benchmarks be reviewed?
Review monthly for changes in your own stable cohort and annually against external research. Preserve definitions, date ranges and traffic mix. External reports help explain context, but your internal baseline determines whether a change is meaningful.
Sources
Contentsquare — 2025 Digital Experience Benchmarks
Contentsquare — Digital Experience Benchmark Explorer
Ruler Analytics — 2026 conversion benchmarks
WordStream — 2025 search advertising benchmarks
Advanced Web Ranking — Google CTR Q4 2025
Seer Interactive — 2025 organic and paid CTR study
Google Analytics — engagement and bounce rate definitions
Fullstory — Behavioral Data Index 2025
Backlinko — Google organic CTR study


