



Table of contents

Google Analytics is the single most important free tool for understanding how people find and interact with your website. Yet fewer than 30% of businesses use it beyond checking basic traffic numbers — leaving a massive data advantage untapped.
Key Takeaways
- GA4's default data retention is only 2 months — change it to 14 months immediately under Admin → Data Settings → Data Retention, or you will lose all historical Explore report data.
- Engagement rate replaced bounce rate in GA4, and the industry median engagement rate sits at 55.18% across all verticals, according to Databox's benchmark study of over 1,400 GA4 properties.
- Custom audiences in GA4 can be exported directly to Google Ads for remarketing, with up to 100 audience segments per standard property — making first-party data the backbone of cookieless advertising.
- Setting up GA4 explorations for funnel analysis can reveal where 40–60% of users drop off in multi-step conversion paths, giving you specific friction points to fix.
- Connecting Google Search Console to GA4 provides organic keyword data that GA4 cannot capture on its own — including exact search queries, click-through rates, and average positions.
Whether you manage a small business website or run enterprise-level analytics, these tips will help you extract more actionable insights from your GA4 setup — covering everything from initial configuration to advanced reporting techniques that drive real business decisions.
Set Up Your GA4 Property Correctly From Day One
A correct GA4 implementation starts before any tag fires. Over 60% of GA4 data quality issues trace back to improper initial setup, according to a 2026 Waftr analysis of enterprise GA4 implementations. The three highest-impact configuration steps are data retention, enhanced measurement, and cross-domain tracking.
First, change your data retention setting to 14 months. GA4's default 2-month retention deletes all Explore report data after just 60 days. Standard reports remain unaffected, but any custom exploration — funnels, path analysis, cohort reports — will reference only the last two months unless you extend retention. Navigate to Admin → Data Settings → Data Retention and select 14 months. This single change gives you year-over-year comparison capability in Explore.
Second, enable enhanced measurement on your data stream. This automatically tracks page views, scrolls, outbound clicks, site search, video engagement, and file downloads without any additional code or Google Tag Manager configuration. Under Admin → Data Streams → select your stream → Enhanced Measurement, toggle on all events your team will actually use.
| Configuration Setting | Default | Recommended | Impact |
|---|---|---|---|
| Data Retention | 2 months | 14 months | Enables year-over-year Explore reports |
| Enhanced Measurement | Partial | All events on | Tracks scrolls, clicks, video, search automatically |
| Google Signals | Off | On (with consent) | Cross-device user tracking and demographics |
| Internal Traffic Filter | Off | Active with IP rules | Prevents team visits from inflating metrics |
| Cross-Domain Tracking | Off | Configure for multi-domain | Unified user journey across subdomains |
| Consent Mode v2 | Off | Required for EEA advertisers | Privacy compliance and modeled conversions |
Third, set up an internal traffic filter. Without one, every page view from your team — developers testing, marketers reviewing content, executives checking the homepage — inflates your traffic data. Under Admin → Data Streams → Configure Tag Settings → Define Internal Traffic, add your office IP ranges and any VPN addresses your team uses.
Master GA4 Reports That Actually Drive Decisions
The GA4 reporting interface organizes data into five report categories: Realtime, Life Cycle (Acquisition, Engagement, Monetization, Retention), and User (Demographics, Tech). The three most actionable reports for most businesses are the Traffic Acquisition report, the Pages and Screens report, and the Engagement Overview.
The Traffic Acquisition report shows you where your visitors come from broken down by channel group — organic search, paid search, direct, referral, social, email, and display. Use this report to identify which channels deliver the highest engagement rate and conversion rate, not just the most traffic. A channel driving 10,000 sessions with a 1% conversion rate is less valuable than one driving 2,000 sessions at a 5% conversion rate if your goal is lead generation.
The Pages and Screens report reveals which pages users actually engage with. Sort by average engagement time per session to find your stickiest content, then sort by bounce rate to find pages losing visitors immediately. The gap between these two lists tells you exactly where your content strategy is working and where it needs improvement.
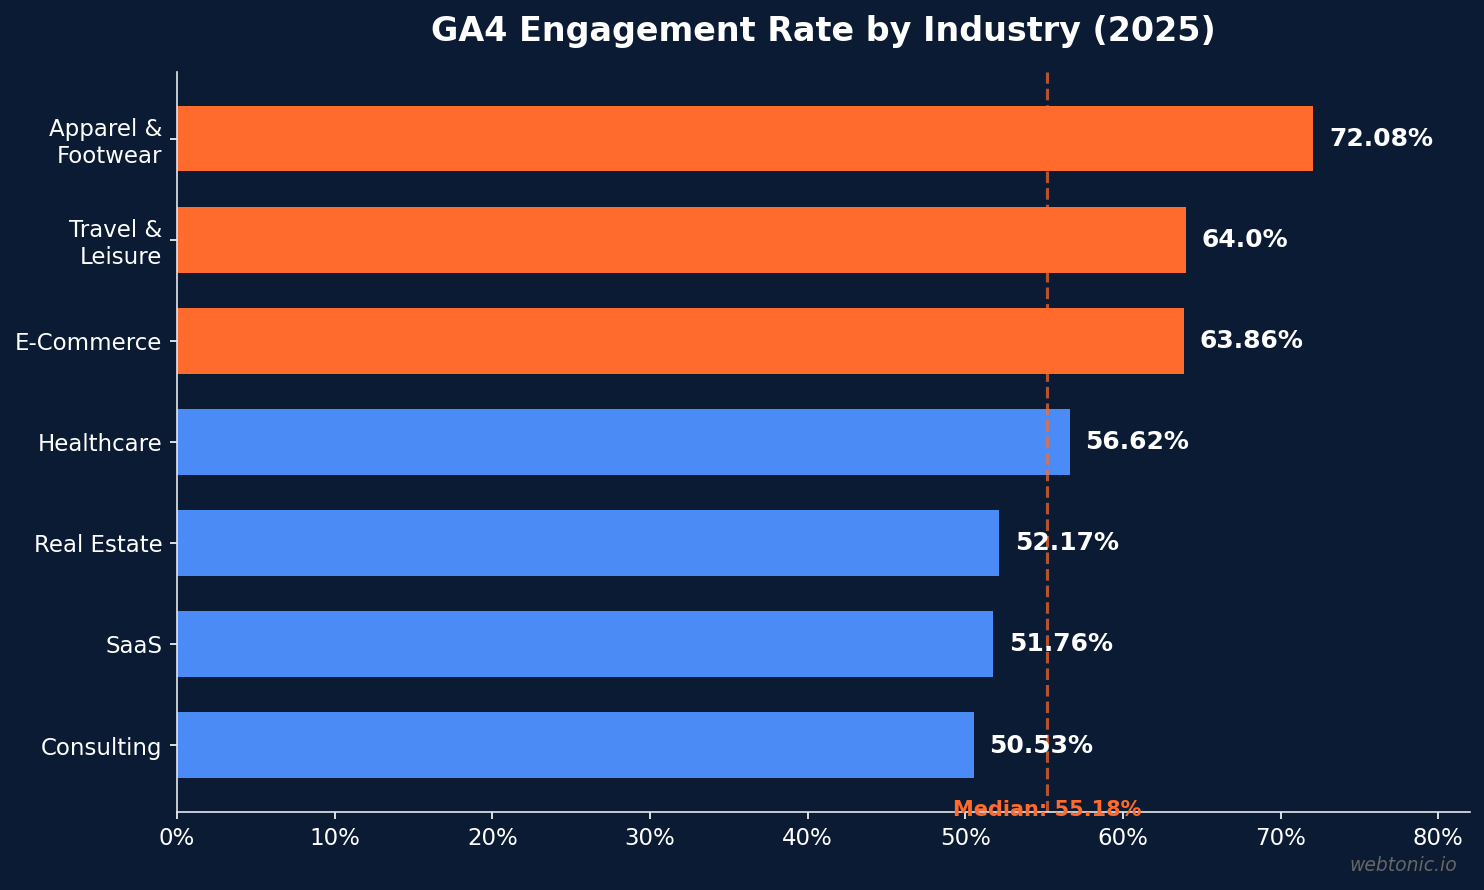
GA4's engagement rate metric replaced the legacy bounce rate from Universal Analytics. An engaged session is one that lasted longer than 10 seconds, triggered a conversion event, or included 2 or more page views. The industry median engagement rate is 55.18%, according to Databox's analysis — but this varies significantly by vertical.
| Industry | Median Bounce Rate | Median Sessions | Median Engagement Rate |
|---|---|---|---|
| Apparel & Footwear | 27.92% | 12,400 | 72.08% |
| E-Commerce | 36.14% | 18,200 | 63.86% |
| Travel & Leisure | 36.00% | 9,800 | 64.00% |
| Healthcare | 43.38% | 6,500 | 56.62% |
| Real Estate | 47.83% | 4,200 | 52.17% |
| SaaS | 48.24% | 7,900 | 51.76% |
| Consulting | 49.47% | 3,100 | 50.53% |

Build Custom Explorations for Deeper Insights
Standard reports in GA4 give you the overview. Explorations give you the answers. The Explore section is where you build custom analyses that go beyond what pre-built reports can show — including funnel explorations, path explorations, segment overlap, and cohort analysis.
The Funnel Exploration is the single most valuable custom report for conversion-focused businesses. It lets you define a multi-step user journey (e.g., landing page → product page → add to cart → checkout → purchase) and see exactly where users drop off. Most businesses discover that 40–60% of users abandon at a specific step — often the checkout page or a form submission step — and fixing that single friction point can lift conversions by 15–25%.
To build a funnel exploration: navigate to Explore → Blank → set your date range → add Steps. Each step should represent a key event (page_view with specific page_location, or a custom event like begin_checkout). Enable "Show elapsed time" to see how long users take between steps — if the median time between "add to cart" and "purchase" exceeds 48 hours, your checkout process has friction worth investigating.
The Path Exploration shows you the actual sequence of pages or events users follow after a starting point. Use it to discover unexpected navigation patterns — you might find that 35% of your homepage visitors go straight to your pricing page, bypassing your carefully designed product tour. That behavior tells you to feature pricing more prominently.
Track Conversions That Actually Matter to Your Business
GA4 uses an event-based model where any event can be marked as a conversion (called a "key event" since March 2024). The mistake most businesses make is either tracking too few conversions (just "purchase" or "form submit") or too many (every button click, every page view). The optimal approach is to track 3–7 key events that represent meaningful business outcomes.
For lead generation businesses, recommended key events include: form submissions, phone calls (via Google call tracking or a tool like CallRail integration), chat initiations, email signups, and content downloads. For e-commerce, track purchases, add-to-cart actions, begin-checkout events, and successful payment completions.
Configure conversion values even for non-revenue events. If 1 in 10 form submissions becomes a $5,000 customer, assign a conversion value of $500 to each form submission. This lets GA4 and Google Ads optimize bidding toward higher-value leads, not just higher volume. According to Google's own documentation, advertisers using value-based bidding see up to 14% more conversion value at the same budget.
After setting up key events, create a custom conversion report in Explore. Compare conversion rates by traffic source, device, and landing page to identify which combinations deliver the most valuable users — not just the most users. This segmented view often reveals that mobile organic traffic converts at half the rate of desktop, pointing to a mobile UX problem rather than a traffic quality issue, as HubSpot's analytics guide confirms.
Use Audiences and Segments for Smarter Marketing
GA4 audiences are dynamic user groups based on conditions you define — and they automatically sync to Google Ads for remarketing when your accounts are linked. Standard GA4 properties support up to 100 audiences, and each audience can include conditions based on dimensions, metrics, events, and time ranges.
The most powerful audience types for marketing performance are:
Purchase-intent audiences — users who viewed a product page 3+ times in 7 days but did not purchase. These users show high intent and convert at 3–5x the rate of cold audiences when retargeted.
High-value customer audiences — users whose lifetime revenue exceeds your average order value by 2x or more. Export these to Google Ads as seed audiences for lookalike targeting in Demand Gen campaigns.
Abandoned funnel audiences — users who completed step N of your conversion funnel but did not complete step N+1. These micro-segments let you serve targeted messaging for each specific drop-off point rather than generic retargeting.
One often-overlooked feature: GA4 audiences are retroactively populated with up to 30 days of historical data when created. This means you can create a new audience today and immediately have a usable remarketing list in Google Ads, rather than waiting weeks for the list to build from scratch.
Connect Google Search Console for Organic Keyword Intelligence
GA4 does not capture organic search query data on its own — all organic traffic appears under the "(not provided)" label. Connecting Google Search Console to your GA4 property unlocks the actual search queries people use to find your site, along with impressions, click-through rates, and average positions.
To link Search Console: navigate to Admin → Product Links → Search Console Links → Link. You need admin access to both the GA4 property and the Search Console property. Once linked, a new "Search Console" section appears in your GA4 reports under Acquisition, containing two reports: Queries (what people searched) and Google Organic Search Traffic (which pages received clicks).
Use the Search Console Queries report to find high-impression, low-CTR keywords — these are search terms where your pages appear frequently in results but fail to attract clicks. Improving the title tag and meta description for these queries can increase CTR by 20–40% without any change in rankings. Similarly, find keywords ranking in positions 8–15 (bottom of page 1 or top of page 2) where a small content improvement could push them into the top 5 positions, where click-through rates jump from under 3% to over 10%.
Advanced Tips for Power Users
Beyond the fundamentals, several advanced GA4 features deliver outsized returns for teams willing to invest the setup time.
Custom channel groupings — GA4's default channel definitions may not match your business. If you run influencer campaigns, those clicks might land in "Referral" or "Social" depending on the link structure. Create custom channel groups under Admin → Data Display → Channel Groups to segment influencer, affiliate, partnership, and branded content traffic into their own channels. This gives you accurate attribution for non-standard marketing activities.
Calculated metrics — GA4 now supports custom calculated metrics (launched in late 2025) that combine existing metrics into new KPIs. Common examples: revenue per session (transaction revenue ÷ sessions), cost per engaged user (ad cost ÷ engaged sessions), and lead-to-close rate (closed deals from CRM ÷ GA4-tracked form submissions). These metrics appear in standard reports alongside native metrics.
BigQuery export — for businesses with GA4 360 or those willing to use the free BigQuery sandbox (1 TB queries/month), exporting raw GA4 data to BigQuery enables SQL-level analysis that the GA4 interface cannot perform. Common use cases include sessionization analysis, custom attribution modeling, and joining GA4 data with CRM or revenue data for true ROI calculation.
Predictive audiences — GA4 automatically generates predictive metrics (likely 7-day purchasers, likely 7-day churning users, predicted revenue) when your property has sufficient conversion data (1,000+ positive examples and 1,000+ negative examples in 28 days). Build audiences from these predictive segments and export them to Google Ads for proactive remarketing — targeting users before they convert or churn, rather than after.
Common GA4 Mistakes That Waste Your Data
Even experienced marketers make configuration mistakes in GA4 that silently corrupt their data. Here are the most frequent errors and how to fix them.
Duplicate events from both gtag.js and GTM. If you have the GA4 configuration tag in Google Tag Manager AND the gtag.js snippet hardcoded on your site, every event fires twice. Check your Realtime report — if page_view counts are roughly 2x your actual traffic, you have duplicate tags. Remove the hardcoded snippet and manage everything through GTM.
Not filtering internal traffic. Without IP-based filters, your team's browsing inflates sessions, page views, and engagement metrics. For a 20-person team browsing the site daily, this can inflate total traffic by 5–15% and severely distort engagement rate calculations on low-traffic pages.
Ignoring Consent Mode v2. Since March 2024, Google requires Consent Mode v2 for any advertiser targeting users in the European Economic Area. Without it, you lose the ability to use modeled conversions in Google Ads — meaning 30–35% of conversion data from EEA traffic simply disappears from your reports and bidding models.
Using too many custom dimensions. Standard GA4 properties allow 25 custom event-scoped parameters and 25 user-scoped properties. Teams that add custom dimensions for every possible data point quickly hit this ceiling and can't track new attributes without removing old ones. Plan your custom dimension strategy around business-critical attributes only — user role, subscription tier, content category, and lead source are common high-value dimensions.


Related reading
- Google Analytics Event Tracking: Complete GA4 Setup Guide
- Google Analytics Goals: Setup Guide, Key Events & GA4 Migration
- Merchant Center and Google Ads Linking: The Full Checklist
- Marketing Analytics services at Web Tonic
Frequently Asked Questions
What is the difference between GA4 and Universal Analytics?
GA4 uses an event-based data model where every interaction is an event, while Universal Analytics used a session-based model with hit types (pageviews, events, transactions). GA4 tracks users across websites and apps in a single property, offers machine learning-powered insights and predictive metrics, and is built for a privacy-first world with Consent Mode and cookieless measurement. Universal Analytics was officially sunset in July 2024 and no longer processes data.
How do I check if my GA4 is set up correctly?
Use GA4's DebugView (Admin → DebugView) with the Google Tag Assistant Chrome extension installed. This shows you every event firing in real time, including parameters. Check that page_view events fire once per page load (not twice), that your key events record the correct parameters, and that your data retention is set to 14 months. Also verify that your internal traffic filter is active and that enhanced measurement events match your tracking plan.
How many conversions should I track in GA4?
Track 3–7 key events that represent meaningful business outcomes. For lead generation sites, this typically includes form submissions, phone calls, chat initiations, and high-value page visits (like pricing page views). For e-commerce, focus on purchase, add-to-cart, begin-checkout, and payment completions. Tracking too many conversions dilutes your data and confuses automated bidding algorithms that optimize toward your key events.
Can GA4 track users across devices?
Yes, GA4 uses three identity methods: User-ID (logged-in users), Google Signals (opted-in Google account users), and device ID (cookie-based). When Google Signals is enabled, GA4 can connect the same user across phone, tablet, and desktop — giving you a more accurate user count and cross-device conversion paths. However, Google Signals requires user consent under Consent Mode v2 for EEA audiences.
What is a good engagement rate in GA4?
The industry median engagement rate is 55.18% across all verticals. However, benchmarks vary significantly: apparel and footwear sites see engagement rates above 72%, while consulting and SaaS businesses average around 50–52%. A "good" engagement rate depends on your industry, traffic sources, and content type. Focus on improving your own engagement rate over time rather than chasing an arbitrary benchmark.
Sources
Waftr — How to Set Up GA4 the Right Way (2026)
Databox — GA4 Industry Benchmarks
Google — Create and Edit Audiences in Analytics
Google — GA4 Setup Instructions
OptimizeSmart — GA4 Complete Guide
Focus Digital — Display Ad CTR Benchmarks


