Table of contents

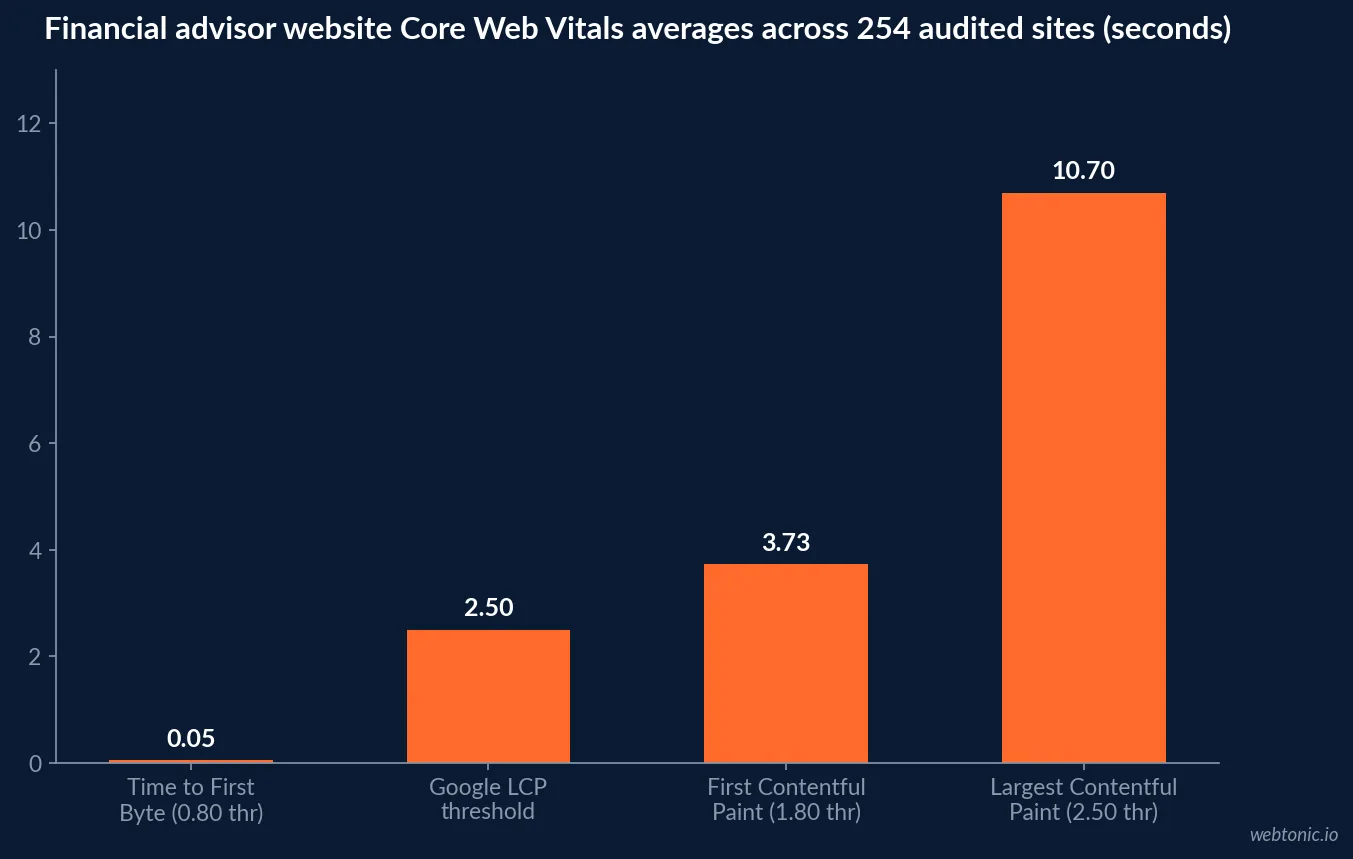
The average financial advisor website takes 10.7 seconds to render its main content while its server responds in 0.05 seconds. That gap is the entire technical SEO story of the wealth management sector: the hosting is fine, the front end is not. The statistics below come from 254 audited US advisory sites plus independent audit datasets, and they point to a fix list most firms could clear in a fortnight.
Key Takeaways
- Average LCP on advisor sites is 10.7 seconds against Google's 2.5-second threshold - 8.2 seconds over.
- Average TTFB is 0.05 seconds versus a 0.80-second threshold, proving the failure is front-end rather than server-side.
- 73% of advisory sites score below 70 on PageSpeed, with 38.7% in the critical 0-49 band and only 17.6% reaching 90-100.
- Only 57.3% publish any JSON-LD structured data and just 52.5% have a populated meta description.
- 42.7% have no sitemap and 40% have no robots.txt - crawl-layer failures that cost nothing to fix.
- Slow main content affects 75.3% of sites and duplicate titles 71.8%, the two most common issues in the dataset.
- 17.6% of advisor sites still run without SSL (82.4% adoption), which triggers a Chrome warning on a page asking for personal financial details.
- Core Web Vitals failures affect roughly 60% of advisory sites audited, suppressing rankings in competitive metros.
Core Web Vitals: one metric is doing all the damage
Borah Labs ran full diagnostics on 254 US financial advisor websites in July 2026 - PageSpeed, SSL inspection, technology detection and structured-data parsing on live production sites. The result is unusually clean diagnostically: three of the four vitals are close to acceptable and one is catastrophic.
| Core Web Vital | Advisor site average | Google threshold | Status |
|---|---|---|---|
| Largest Contentful Paint | 10.7s | 2.50s | Fails by 8.2s |
| First Contentful Paint | 3.73s | 1.80s | Fails by ~1.9s |
| Cumulative Layout Shift | 0.11 | 0.10 | Marginal fail |
| Time to First Byte | 0.05s | 0.80s | Passes comfortably |
A 0.05-second TTFB with a 10.7-second LCP means the server delivers the first byte almost instantly and then the browser spends ten seconds assembling the page. In practice that is uncompressed hero imagery, render-blocking scripts, chat widgets, calendar embeds, market-data tickers and tag managers - the standard advisory website stack. Nothing in that list requires a re-platform, which is why speed remains the cheapest competitive advantage in the category.
The PageSpeed distribution: a long tail, not a few outliers
The average score of 59 out of 100 hides a bimodal market. Nearly two in five advisory sites are in the critical band, and the minority that invested properly sit at the top - there is very little middle ground in the 70-89 range, which is where most industries cluster.
| PageSpeed band | Share of advisor sites | What it means commercially |
|---|---|---|
| Critical (0-49) | 38.7% | Losing traffic to faster competitors |
| Needs work (50-69) | 34.4% | Rankings capped in competitive metros |
| Decent (70-89) | 9.4% | Competitive but not differentiated |
| Good (90-100) | 17.6% | Clear technical advantage |
The commercial read-through is straightforward. Google's own data shows bounce rate climbing sharply past a three-second load, and a one-second delay is commonly measured as a 7% reduction in conversions. On an advisory site where a single converted consultation can lead to a seven-figure relationship, a 10.7-second render is not a technical debt item - it is the largest single leak in the funnel.
SEO hygiene: the table stakes half the industry skipped
The same audit measured adoption of baseline signals. These are one-time implementations, most of them under an hour of work, and adoption sits between 52% and 90%.
| Signal | Adoption across 254 advisor sites | Why it matters |
|---|---|---|
| Viewport meta tag | 89.8% | Without it Chrome renders desktop zoom on phones |
| Open Graph tags | 65.1% | Controls link previews on LinkedIn and iMessage |
| Canonical tag | 63.9% | Prevents duplicate-content dilution across URL variants |
| JSON-LD structured data | 57.3% | Unlocks rich results and feeds AI answer engines |
| Meta description | 52.5% | Controls the snippet Google shows in results |
| SSL / HTTPS | 82.4% | 45 of 254 sites trigger a Chrome insecure warning |
The SSL number deserves emphasis: 45 of the 254 sites analysed had no SSL certificate in 2026. On a page where the visitor is being asked to share retirement details and book a call, a browser-level "Not secure" warning is a conversion problem before it is a ranking problem.

Quick wins ranked by frequency
The audit ranked issues by how often they appeared, which is a better prioritisation input than severity alone: a high-impact issue on 75% of sites is where an agency earns its retainer.
| Issue | Found on | Category | Impact |
|---|---|---|---|
| Main content takes too long to appear | 75.3% of sites | Speed | High |
| Two or more pages share the same title | 71.8% of sites | SEO | Medium |
| No sitemap found | 42.7% of sites | SEO | High |
| No robots.txt found | 40% of sites | SEO | High |
| Broken links (1,927 detected in sample) | 36.9% of sites | Hygiene | Medium |
Duplicate titles at 71.8% usually indicate the same failure mode: templated service pages and location pages generated without unique metadata. That is also the pattern most likely to create internal cannibalisation, where three near-identical "financial planning" pages split the same ranking signal three ways. Advisor-specific audit checklists place schema review and title de-duplication in the same first pass for exactly this reason.
The technology stack behind the numbers
Platform detection across the sample found Cloudflare on 13.2%, Google Analytics on 13.1%, jQuery on 12.4%, HSTS on 11.8%, PHP on 9.2%, Google Tag Manager on 8.9%, HTTP/3 on 8.2% and WordPress on 8.0% of detected technologies, with jQuery Migrate still present on 7.1%. Two observations follow. jQuery Migrate is a compatibility shim for deprecated code - its presence is a reliable marker of a theme that has not been rebuilt in years. And HTTP/3 adoption at 8.2% means most advisory sites are not using the transport-layer improvements that come free with a modern CDN.
Social linking is similarly thin: only 43.9% of advisor sites link to any social profile from the homepage, 41.2% to LinkedIn and 31% to Facebook. Those outbound links are part of how search engines and answer engines reconcile a firm's entity across the web, so a homepage with no profile links is harder to disambiguate from the dozens of similarly named practices.
Why YMYL raises the stakes
Financial advice sits in Google's Your Money or Your Life category, where quality thresholds are applied more aggressively than in ordinary commercial verticals. Audit data reports Core Web Vitals failures on roughly 60% of advisory sites directly suppressing rankings in competitive metros, and notes that crawl blocks, slow load times and missing schema suppress rankings silently - without the obvious symptoms that prompt a firm to investigate.
The practical consequence is that technical work carries credential weight here. Core Web Vitals function as threshold requirements for finance sites rather than polish, and RIA-specific guidance treats an LCP above 2.5 seconds or a CLS above 0.1 as an active ranking constraint. Structured data that states who the advisers are, what credentials they hold and which jurisdictions they serve is the machine-readable version of the expertise Google is trying to verify.
Conversion consequences of the same technical debt
Speed and structure show up twice - once in rankings, once in bookings. Advisory conversion analysis puts the converting pattern at a niche-specific headline, an embedded booking calendar rather than a contact form, above-fold trust signals such as credentials and assets under management, compliant social proof, and a mobile-first build scoring 85 or better on PageSpeed. Only 17.6% of the audited market clears that last requirement.
| Fix | Typical effort | Expected visibility timeline | Order |
|---|---|---|---|
| Sitemap, robots.txt, crawl access | 1-2 hours | Indexation within 2-4 weeks | 1 |
| Image compression and lazy loading | 1-2 days | Speed metrics in 4-6 weeks | 2 |
| Render-blocking script cleanup | 2-4 days | Speed metrics in 4-6 weeks | 3 |
| Unique titles and meta descriptions | 1-2 days | Click-through lift in 4-8 weeks | 4 |
| JSON-LD schema for firm and advisers | 1-2 days | Rich results in 4-8 weeks | 5 |
| Content and local authority work | Ongoing | Impressions from months 3-6 | 6 |
How to run this on your own site
Start with a crawl, not a speed test: confirm the sitemap exists and is submitted, that robots.txt is not blocking anything valuable, and that key service pages return 200 status codes and are indexed. Then measure LCP on a throttled mobile connection rather than on office wifi, because the 10.7-second average is what real visitors experience. Fix the front end before touching content. Our growth marketing team runs this audit sequence for regulated firms, and our data intelligence practice connects the technical fixes to booked-consultation data so the work is defensible. For related reading, our paid strategy guide covers what happens to CPCs when landing page experience improves.
Frequently Asked Questions
How fast should a financial advisor website load in 2026?
Largest Contentful Paint should be under 2.5 seconds on mobile, Cumulative Layout Shift under 0.1 and Interaction to Next Paint under 200 milliseconds. Across 254 audited US financial advisor sites the average LCP is 10.7 seconds - 8.2 seconds over the threshold - with an average PageSpeed score of 59 out of 100. Because Time to First Byte averages 0.05 seconds against a 0.80-second threshold, the delay is almost entirely front-end: images, render-blocking scripts and third-party embeds.
What percentage of advisory websites fail Core Web Vitals?
Most of them. In the 254-site benchmark, 38.7% of advisor sites score in the critical 0-49 PageSpeed band and 34.4% in the 50-69 needs-work band, so 73% sit below 70. Only 17.6% reach the 90-100 good band. Independent audit work reports Core Web Vitals failures on roughly 60% of advisory sites, directly suppressing rankings in competitive metros. Average CLS across the sample is 0.11 against a 0.10 threshold, so layout stability fails narrowly while speed fails badly.
Which technical SEO fixes matter most for wealth management sites?
Ranked by how often the problem appears: slow main content rendering (75.3% of sites), duplicate page titles (71.8%), a missing sitemap (42.7%), a missing robots.txt (40%) and broken links (36.9%). Only 57.3% of advisor sites publish any JSON-LD structured data and 52.5% have a populated meta description, so schema and metadata are usually the cheapest available wins. Fix crawl access first, then speed, then structured data, then content.
Does structured data matter for financial advisors?
It matters more here than in most verticals, because financial advice is a YMYL category where Google leans on entity and credential signals. Only 57.3% of audited advisor sites publish JSON-LD at all, and 65.1% have Open Graph tags, which means correct FinancialService, Person, Organization and FAQPage markup with credentials and review data is still a differentiator rather than table stakes. It is also the machine-readable layer AI answer engines parse when deciding which firm to name.
How long does technical SEO take to show results for an advisory firm?
Faster than content work, which is why it goes first. Documented audit timelines put mobile speed improvements showing within 4 to 6 weeks and major crawl fixes within about 8 weeks, with new content assets typically indexing and accumulating impressions between months 3 and 6. The sequencing rule is unchanged: on-page work cannot help pages Google struggles to crawl, and local work compounds only once the on-page layer is sound.
The verdict
Wealth management has the most fixable technical SEO problem of any professional services vertical. TTFB passes at 0.05 seconds while LCP fails at 10.7 seconds, 73% of sites score below 70 on PageSpeed, 42.7% have no sitemap and only 57.3% publish structured data. None of that requires a rebuild - it requires compressed images, fewer blocking scripts, unique titles and a schema block. In a YMYL category where Core Web Vitals failures hit roughly 60% of audited advisory sites, being in the 17.6% that score 90+ is a durable advantage. Talk to our team for a technical audit benchmarked against this dataset.
Sources
Borah Labs - financial advisor website benchmarks, 254 sites, July 2026
Authority Specialist - financial advisor SEO audit guide
Authority Specialist - financial advisor SEO statistics
Dash SEO - complete SEO guide for RIA firms
ProfileTree - SEO for finance websites and Core Web Vitals
OJay Media - financial advisor website design that converts
AdvisorSEOMax - advisor website SEO audit checklist
SoftScotch - Core Web Vitals and load time impact on conversions