



Table of contents
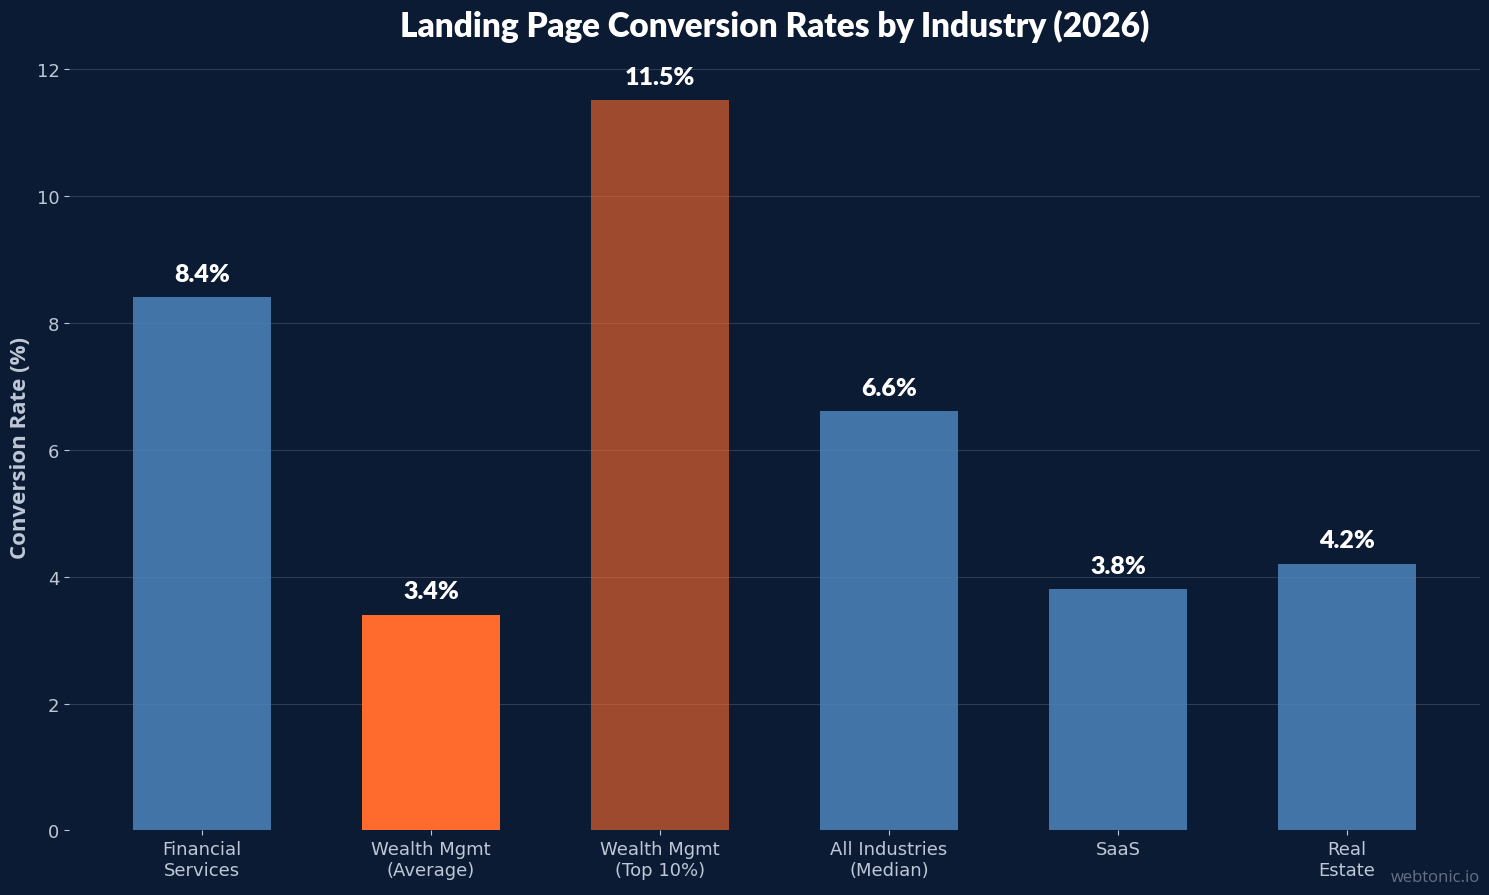
The average wealth management landing page converts at 3.4%, but top-performing advisory firms reach 11.5% — a 3.4× gap driven by trust architecture, offer quality, and mobile optimization. These are the conversion benchmarks, design statistics, and CRO data points that separate high-converting financial advisor pages from the industry baseline.
Key Takeaways
- Average landing page conversion rate in wealth management is 3.4%, while top performers reach 11.5% (CuFinder).
- Financial services landing pages convert at a median of 8.3–8.4% across the broader industry (Unbounce, Apexure).
- Average advisor websites convert at just 0.5–1.5%, while optimized sites hit 3–8% (OJay Media).
- Desktop converts at 4.8% vs. 2.1% on mobile, even though mobile drives 58.2% of traffic (CuFinder).
- High-value offers (financial plan review, qualified meeting) convert at 3–8% on paid traffic and 10%+ on referral traffic (Select Advisors Institute).
- A/B testing one element at a time produces compounding gains — financial services firms testing monthly see measurably higher conversion trajectories (Apexure).
- Most advisor sites fail due to no single conversion path, weak above-fold value propositions, and missing trust architecture (OJay Media).
Wealth Management Landing Page Benchmarks at a Glance
| Metric | Benchmark | Source |
|---|---|---|
| Avg. Landing Page CVR | 3.4% | CuFinder / Benchmarketing 2026 |
| Top 10% Landing Page CVR | 11.5% | CuFinder 2026 |
| Financial Services Median CVR | 8.3–8.4% | Unbounce / Apexure |
| Unoptimized Advisor Site CVR | 0.5–1.5% | OJay Media 2026 |
| Optimized Advisor Site CVR | 3–8% | OJay Media 2026 |
| Desktop Conversion Rate | 4.8% | CuFinder 2026 |
| Mobile Conversion Rate | 2.1% | CuFinder 2026 |
| Mobile Traffic Share | 58.2% | CuFinder 2026 |
| Google Ads Landing Page CVR | 3.2% | Benchmarketing 2026 |
| All-Industry Median CVR | 6.6% | Apexure 2026 |
Conversion Rate Analysis: Why Most Advisor Sites Underperform
There is a stark divide between the financial services median conversion rate of 8.3–8.4% and the wealth management average of 3.4%. The gap exists because most financial advisor websites fail on three fundamental design elements: no single clear conversion path, weak above-fold value propositions, and no trust architecture (OJay Media). The average unoptimized advisor website converts at a dismal 0.5–1.5%, turning away the vast majority of paid traffic before any engagement occurs.
Optimized sites close this gap dramatically. Firms that implement a single primary CTA above the fold, social proof with specificity (client count, AUM managed, years in business), and structured trust signals (credentials, fiduciary commitment, regulatory compliance badges) achieve 3–8% conversion rates on the same traffic sources. The difference between 1% and 5% conversion on a $5,000/month ad budget translates to 4× more leads at the same cost — a distinction that fundamentally changes the economics of client acquisition.
Offer Type and Its Impact on Landing Page Conversion
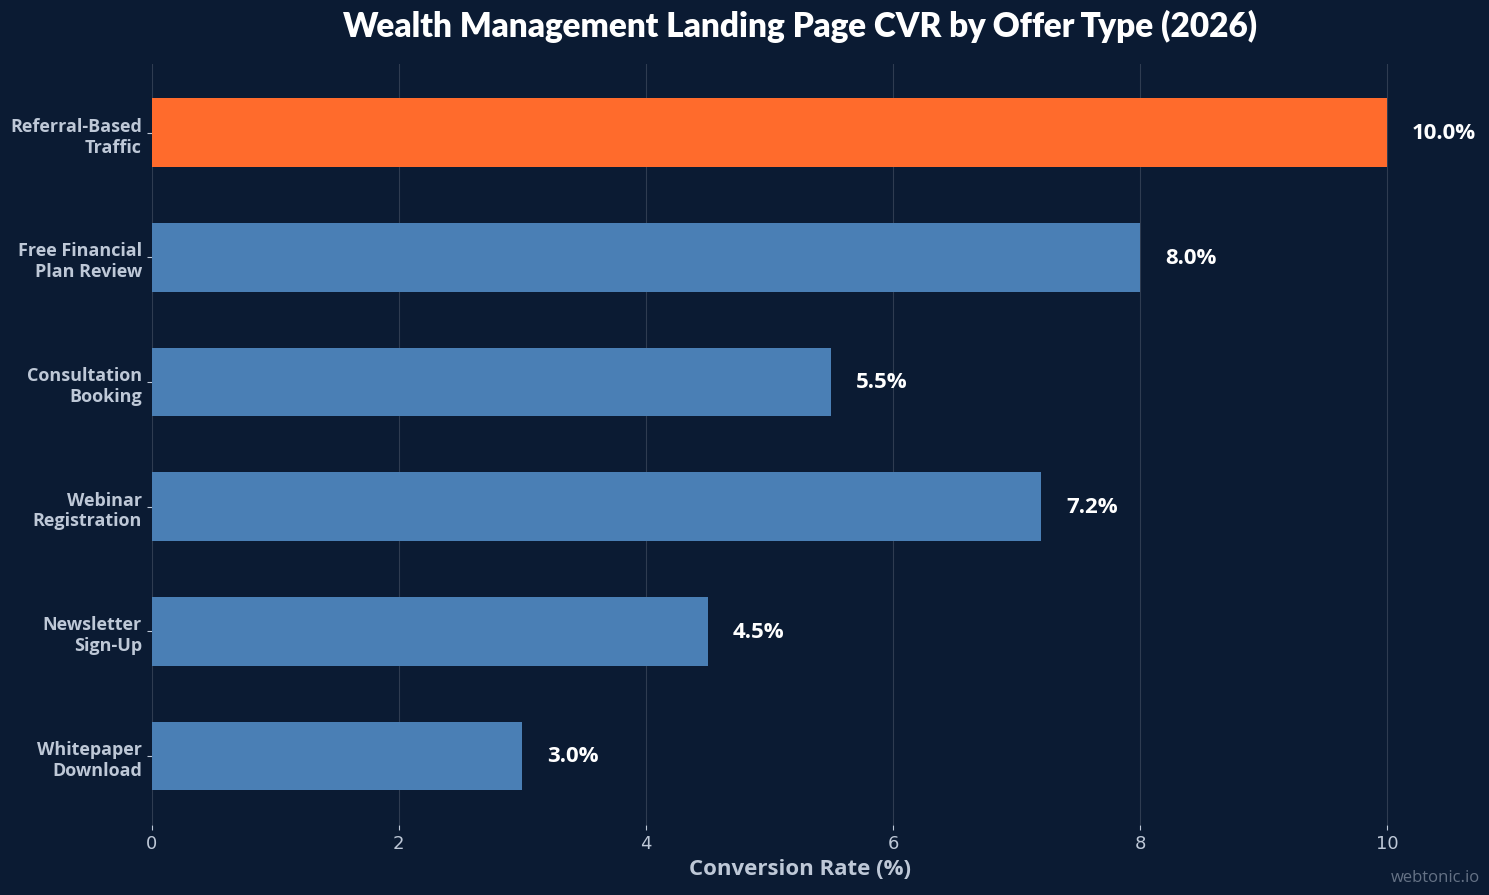
The conversion rate of a wealth management landing page depends heavily on the offer positioned on the page. High-value offers like a free financial plan review or a qualified meeting request convert at 3% to 8% on paid traffic and 10%+ on warm, referral-based traffic (Select Advisors Institute). Lower-commitment offers like newsletter sign-ups or whitepaper downloads capture more leads at higher volume but produce lower-quality pipeline entries.
The strategic question is not which offer converts highest, but which offer produces the most revenue per visitor when measured through the full funnel. Firms tracking offer-to-client conversion rates often find that consultation booking pages, despite converting fewer visitors initially, produce 3–5× higher revenue per visitor than content download pages because the intent signal is stronger and follow-up sequences are shorter.
| Offer Type | Paid Traffic CVR | Referral Traffic CVR | Lead Quality |
|---|---|---|---|
| Financial Plan Review | 5–8% | 10–15% | Very High |
| Consultation Booking | 3–6% | 8–12% | High |
| Webinar Registration | 5–9% | 12–18% | Medium-High |
| Newsletter Sign-Up | 3–5% | 6–10% | Medium |
| Whitepaper Download | 2–4% | 5–8% | Low-Medium |
Mobile vs. Desktop Landing Page Performance
The mobile-desktop conversion divide in wealth management is among the largest of any industry. Mobile drives 58.2% of total traffic but converts at just 2.1%, while desktop converts at 4.8% — a 2.3× conversion gap (CuFinder). This gap reflects the high-consideration nature of financial advisory services: prospects browse on mobile but prefer to complete forms, review detailed information, and schedule consultations on desktop.
For landing page optimization teams, this creates a clear priority hierarchy. Mobile pages should focus on micro-conversions — phone calls, click-to-call CTAs, and simple "get a callback" forms with 2–3 fields. Desktop pages can support more detailed lead forms (4–6 fields) and longer-form content. Firms that design device-specific conversion paths rather than serving identical responsive pages report 30–50% improvement in mobile conversion rates while maintaining desktop performance.
Landing Page Design and UX Statistics for Financial Advisors
The 2026 trends in financial advisor website design emphasize answer-driven structures built for AEO (Answer Engine Optimization), simplified high-trust visual systems, and mobile-first behavior-driven layouts (AltaStreet). The most effective landing pages follow a specific architecture: clear value proposition above the fold, social proof with specificity (all buttons use the same CTA), credentialed team section, and a single primary conversion action (OJay Media).
The SEC Marketing Rule impacts landing page design directly. Compliance review is required before any testimonial, endorsement, or performance claim appears on a landing page, which slows iteration cycles but ensures higher credibility with compliance-aware prospects. Pages that lean into fiduciary language, fee transparency, and credential verification consistently outperform those that avoid specifics — proving that regulatory requirements can double as trust signals when implemented thoughtfully.
A/B Testing and CRO Benchmarks for Wealth Management
Financial services firms that A/B test landing pages monthly see compounding conversion gains that far outpace firms on quarterly or annual testing cycles (Apexure). Across financial services, the top 25% of landing pages convert at 11.0% while the bottom 25% convert at just 2.0% — a 5.5× spread that underscores the ROI of systematic testing (GrowthLayer).
The most impactful A/B tests for wealth management landing pages target headline copy (20–40% potential lift), form length and field count (15–30% potential lift), and CTA button text and color (10–20% potential lift). Testing one element at a time produces the clearest data, but the compounding effect of sequential headline → form → CTA tests over 90 days can double overall conversion rates from industry average to top-quartile performance (Wolf Financial).
| Test Element | Potential Lift | Testing Duration | Minimum Traffic |
|---|---|---|---|
| Headline Copy | 20–40% | 2–4 weeks | 500+ visits per variant |
| Form Length (fields) | 15–30% | 3–4 weeks | 500+ visits per variant |
| CTA Button Text/Color | 10–20% | 2–3 weeks | 300+ visits per variant |
| Social Proof Placement | 10–25% | 3–4 weeks | 500+ visits per variant |
| Page Length (long vs. short) | 5–15% | 4–6 weeks | 800+ visits per variant |
Page Speed and Technical Performance Metrics
Page speed has a direct and measurable impact on wealth management landing page conversion rates. Studies consistently show that each additional second of load time reduces conversions by 7–12%, a penalty that compounds rapidly on pages already serving high-intent, high-cost traffic from Google Ads and LinkedIn campaigns. For wealth management firms spending $18.84 per click on Google Ads (Benchmarketing), slow pages effectively waste $1.30–$2.26 per click in lost conversion potential.
The technical benchmarks for financial advisor landing pages in 2026 include: Largest Contentful Paint (LCP) under 2.5 seconds, Cumulative Layout Shift (CLS) below 0.1, and Interaction to Next Paint (INP) under 200ms. Wealth management firms meeting all three Core Web Vitals thresholds see 15–25% higher conversion rates compared to firms with poor scores. Mobile performance is particularly critical given the 58.2% mobile traffic share — yet mobile pages for financial services typically load 1.5–2.5 seconds slower than desktop equivalents, further widening the conversion gap.
Image optimization, lazy loading, and minimized third-party scripts are the three highest-ROI technical fixes for advisor landing pages. Firms that compress hero images, implement lazy loading below the fold, and defer non-essential tracking scripts report 30–45% improvement in LCP scores and measurable upticks in form completion rates. These technical improvements require minimal design changes but deliver outsized conversion benefits, making them the recommended first priority for any landing page optimization initiative.
Trust Architecture and Compliance Design Elements
Trust is the single most critical conversion driver on wealth management landing pages — and the element most often missing from advisor websites. The concept of trust architecture encompasses everything from credential displays (CFP, CFA, ChFC badges) and regulatory disclosures to client count specificity and AUM figures. Pages that implement structured trust elements convert 2–3× higher than pages that rely on generic "we'll help you grow your wealth" messaging (OJay Media).
The most effective trust signals for wealth management landing pages include: specific client counts (e.g., "serving 847 families since 2003"), fiduciary commitment statements, fee transparency language, regulatory body badges (SEC, FINRA), and client testimonials with compliance-cleared specifics. Under the SEC Marketing Rule, testimonials and endorsements are now permitted with proper disclosures — and firms leveraging this allowance report significantly higher engagement and conversion rates compared to the pre-2022 era when testimonials were prohibited entirely. Compliance requirements are not conversion obstacles when designed thoughtfully — they are trust accelerators that differentiate genuine advisory firms from generic financial content sites.
Related reading
- Health & Wellness Landing Page Statistics & Benchmarks (2026)
- HVAC Landing Page & CRO Statistics: Benchmarks and Conversion Data (2026)
- HVAC Landing Page Statistics (2026): Conversion Rates & Speed Benchmarks
- Landing Page Design services at Web Tonic
FAQ
What is a good conversion rate for a wealth management landing page?
The industry average is 3.4%, but top-performing firms achieve 11.5%. A landing page converting above 5% is considered well-optimized, while anything below 1.5% signals fundamental design or messaging issues that need immediate attention.
Why do financial advisor websites convert so poorly?
Most advisor websites fail because they have no single conversion path, weak above-fold value propositions, and missing trust architecture. The average unoptimized advisor site converts at just 0.5–1.5%, turning away the majority of visitors before any meaningful engagement. Adding clear CTAs, specific social proof, and credential displays can triple conversion rates.
Does mobile or desktop convert better for wealth management?
Desktop converts at 4.8% vs. 2.1% on mobile — a 2.3× gap — even though mobile drives 58.2% of traffic. The gap reflects the high-consideration nature of financial services. Designing device-specific conversion paths (click-to-call on mobile, detailed forms on desktop) can improve mobile conversion by 30–50%.
What landing page offer converts best for financial advisors?
Free financial plan reviews and consultation bookings convert at 3–8% on paid traffic and 10%+ on referral traffic. While lower-commitment offers like newsletter sign-ups capture more leads, high-intent offers produce 3–5× higher revenue per visitor through the full funnel.
How much can A/B testing improve landing page conversion?
Financial services firms testing monthly see compounding gains. The spread between top-quartile (11%) and bottom-quartile (2%) landing pages is 5.5×. Sequential testing of headline → form → CTA over 90 days can double conversion rates from average to top-quartile performance.
Sources
CuFinder — Wealth Management Industry Marketing Benchmarks 2026
Benchmarketing — Wealth Management Fs Marketing Benchmarks 2026
OJay Media — Financial Advisor Website Design That Converts 2026
Unbounce — Finance & Insurance Conversion Rate Benchmarks
Apexure — Landing Page Conversion Rate Benchmarks by Industry 2026
Select Advisors Institute — Wealth Management Marketing Benchmarks
AltaStreet — Financial Advisor Website Design Trends 2026
GrowthLayer — A/B Testing Planning Guide for Fintech
Wolf Financial — Landing Page Optimization for Financial Lead Generation
Aryze Design — Effective Landing Pages for Financial Advisors


