Table of contents
Audited water damage restoration websites respond in 0.07 seconds and then take 9.91 seconds to render their main content - roughly four times Google's 2.5-second threshold. The servers are not the problem. The build is. That is the honest frame for a Webflow decision: the platform will not make your site fast, it will make it hard for you to make it slow.
Key Takeaways
- Restoration sites average 9.91s LCP against a 0.07s time to first byte (16-site US sample, July 2026) - a front-end weight problem, not a hosting problem.
- 67% of Webflow sites pass mobile Core Web Vitals versus 35% of WordPress sites (HTTP Archive analysis, 2025), with mobile LCP near 2.4s against 3.2s.
- 65% of restoration sites score below 70 on PageSpeed and only 5.9% score 90 or above.
- Webflow Premium is USD 25 per month billed yearly with hosting, CDN, SSL, backups and DDoS included - add-ons that cost USD 50 to USD 200 monthly on WordPress.
- WordPress maintenance runs USD 100 to USD 300 a month; three-year totals land near USD 1,500 to USD 2,500 for simple sites and USD 3,500 to USD 6,000 for complex ones on Webflow.
- Webflow raised its CMS ceiling to 1,000,000 items in January 2026, which is what makes templated service-area pages practical for multi-city operators.
- A one-second mobile delay cuts conversion by about 7% - on 50 leads a month at a USD 500 average value, that is roughly USD 1,750 in monthly revenue.
Where restoration websites actually stand
The benchmark below comes from a July 2026 diagnostic crawl of 16 US water damage restoration websites. Sixteen sites is a small sample and should be read as directional, but the shape is consistent with every larger home-services dataset we have reviewed: infrastructure is fine, page weight is not.
| Metric | Restoration average | Google threshold | Verdict |
|---|---|---|---|
| Largest Contentful Paint | 9.91s | 2.50s | Failing by 4x |
| First Contentful Paint | 3.75s | 1.80s | Failing |
| Time to First Byte | 0.07s | 0.80s | Excellent |
| Cumulative Layout Shift | 0.02 | 0.10 | Excellent |
| PageSpeed score | 59 / 100 | 80+ competitive | Below par |
| Sites scoring under 70 | 65% | - | Market-wide weakness |
| Sites scoring 90 or above | 5.9% | - | The opportunity |
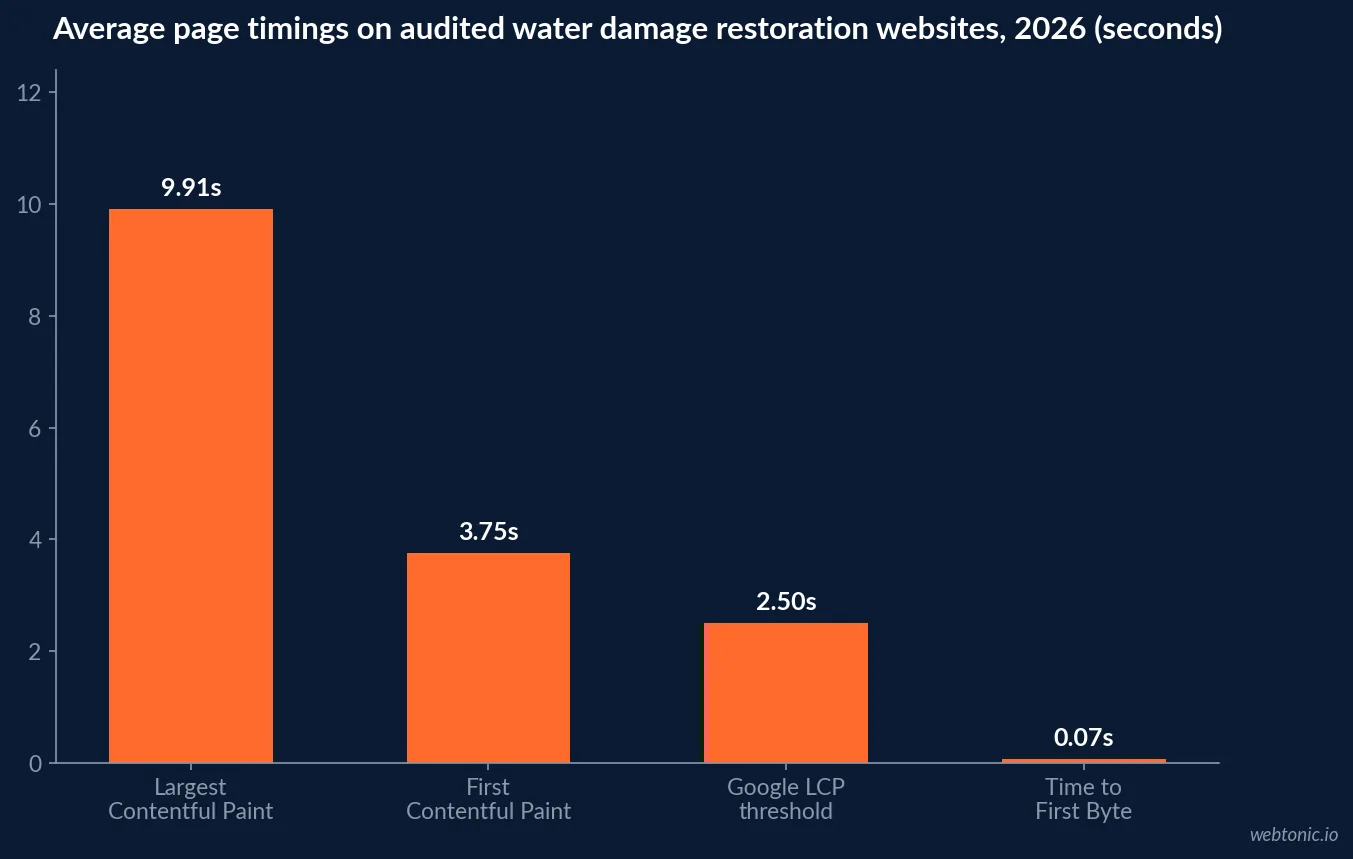
A 0.07-second time to first byte means the host delivers the first byte more than ten times faster than Google requires. Everything after that byte - uncompressed hero images, render-blocking scripts, chat widgets, review sliders, three tracking pixels - is what produces a ten-second page. Changing platform only helps if the new platform prevents those decisions, which is the actual Webflow argument.
The platform data: Webflow versus WordPress in 2026
| Dimension | Webflow | WordPress | Why it matters for restoration |
|---|---|---|---|
| Mobile CWV pass rate | 67% | 35% | 60-70% of contractor traffic is mobile |
| Median mobile LCP | ~2.4s | ~3.2s | Emergency visitors do not wait |
| Market share of all sites | ~0.8% | ~43% | Talent availability favours WordPress |
| CMS market share | ~1.2% | 62-65% | Hiring a maintainer is easier on WP |
| Plugins required | None | 60,000+ available | Plugin sprawl is the main failure mode |
| Security exposure | Managed platform | 7,966 CVEs in 2025, 96% in plugins | Downtime during a storm is lost revenue |
| Hosting, CDN, SSL, backups | Included | USD 50-200/mo add-ons | Hidden cost of the cheaper platform |
| Build time | ~50% faster than custom theme | 200+ hours custom theme | Speed to launch before season |
Note the tension in rows three and four. WordPress's dominance is a real advantage: when something breaks on a Sunday during a flood event, a WordPress developer is available in every market. Webflow's ecosystem is far smaller - roughly 493,000 active sites and 0.8% of the web, up 54% year over year but still a niche. Trade the ecosystem for the guardrails only if the guardrails are what you need.
Three-year cost of ownership, restoration-sized
Platform fees are the least interesting line in the budget. What separates the two options is who absorbs maintenance and what happens when nobody does.

| Cost line | Webflow | WordPress | Note |
|---|---|---|---|
| Platform or hosting | USD 180-468 / yr | USD 60-2,400 / yr | Webflow Basic USD 15/mo yearly; Premium USD 25 |
| Design and build | USD 2,000-5,000 | USD 2,000-5,000 | Comparable for a professional contractor site |
| Plugins and licences | USD 0 | USD 100-400 / yr | Forms, SEO, caching, image tooling |
| Maintenance | Included | USD 100-300 / mo | The line most operators forget |
| Security incident | Platform-managed | USD 4,000-8,000 cleanup | Malware remediation, when it happens |
| Three-year total, simple site | USD 3,500-6,000 | USD 1,500-2,500 | WordPress wins on simple |
| Three-year total, 50+ pages | USD 3,500-6,000 | USD 5,760-10,800 | Webflow wins on complex |
The break-even point in the contractor data sits around 15 to 20 pages with professional maintenance. A single-location restoration company with eight pages should probably stay where it is and spend the difference on demand generation. A three-county operator running mitigation, mold, fire and reconstruction pages per city crosses the line immediately.
The real Webflow argument: templated service-area pages
Restoration is a geography business. The searches that matter are city-plus-service, they arrive at 2am, and they convert three to four times better than planned-service queries. That means the page count grows multiplicatively, and the platform's CMS becomes the constraint. Webflow raised its CMS ceiling to 1,000,000 items in January 2026, so the arithmetic below is a content problem rather than a technical one.
| Footprint | Services | Cities | CMS pages | Practical approach |
|---|---|---|---|---|
| Single location | 4 | 1 | 4 | Static pages, no CMS needed |
| Metro operator | 4 | 8 | 32 | CMS collection, per-city fields |
| Regional, 3 counties | 5 | 25 | 125 | CMS plus unique local proof per page |
| Franchise group | 6 | 60 | 360 | CMS, localisation, strict QA gate |
| Multi-state | 6 | 150 | 900 | CMS plus programmatic content review |
The failure mode is identical on every platform: pages that differ only by the city name. Google has treated that pattern as thin content for years, and the restoration vertical is one of the worst offenders. Each city page needs at least three genuinely local elements - a named response time, crew or truck photography from that market, local review counts, a reference to the last major loss event in the area. Our local SEO benchmarks cover what earns map pack visibility once those pages exist.
Technical hygiene: what the crawl finds before you rebuild
A platform migration will not fix a content architecture problem, and the crawl data shows most restoration sites carry both.
| Issue | Share of restoration sites | Impact | Fixed by a rebuild? |
|---|---|---|---|
| Main content renders too slowly | 81.3% | High | Yes, if the build is disciplined |
| Duplicate page titles | 50% | Medium | No - content decision |
| No sitemap found | 43.8% | High | Yes, generated automatically |
| No robots.txt found | 37.5% | High | Yes |
| Broken links present | 31.3% | Medium | Only with a proper redirect map |
| No SSL certificate | 12.5% | Severe | Yes, included |
| Missing meta descriptions | 31.2% | Medium | No - content decision |
Two of the seven rows above are content problems that survive any migration. Budget editorial time alongside design time, or you will pay USD 4,000 to move the same duplicate titles onto a faster platform. The technical SEO benchmarks for this vertical go deeper on fix order.
Migration, without losing the season
| Phase | Timeline | Cost | Deliverable | Stop condition |
|---|---|---|---|---|
| URL inventory and crawl | 1-2 weeks before | USD 0-200 | Full URL export, redirect map, ranking baseline | More than 10% of URLs unmapped |
| Build and content port | 2-3 weeks | USD 2,500-5,000 | CMS collections, templates, forms, tracking | Forms not tested on mobile |
| Pre-launch QA | 3-5 days | - | 301 map verified, schema present, click-to-call live | Any 404 in the top 50 URLs |
| Launch | Off-season only | - | DNS cutover, sitemap resubmission | Named storm forecast within 14 days |
| Post-launch watch | 90 days | - | Lead volume, cost per lead, ranking recovery | Leads down more than 15% at day 30 |
Webflow has no WordPress importer, so content moves by CSV export and re-import. That is tedious but predictable. The unpredictable part is the redirect map, which is why the crawl comes first and why the launch window matters more than the build quality. A restoration company that goes dark for six hours during a flood watch loses more than the migration cost.
What the speed gain is worth in leads
Google's own research puts a one-second mobile delay at roughly a 7% conversion loss, and bounce probability rises about 32% moving from a one-second to a three-second load. Applied to restoration economics the numbers stop being abstract.
| Scenario | Monthly leads | Average job value | Modelled monthly gain |
|---|---|---|---|
| 1s faster, 50 leads/mo | +3.5 | USD 500 | USD 1,750 |
| 1s faster, 120 leads/mo | +8.4 | USD 3,200 | USD 26,880 |
| 9.9s to 2.5s, mitigation-only | +15-25% | USD 3,200 | Model against your own close rate |
| No change, plugin bloat returns | -7% per added second | - | The default outcome |
Use your own close rate and average job value before quoting any of this internally. The last row is the one worth arguing about in a planning meeting: on WordPress, speed is a state you maintain; on Webflow, it is closer to a state you inherit.
Frequently Asked Questions
Is Webflow faster than WordPress for a restoration website?
On aggregate, yes, but not because the rendering engine is magic. HTTP Archive data analysed in 2025 found 67% of Webflow sites pass mobile Core Web Vitals against 35% of WordPress sites, with median mobile Largest Contentful Paint near 2.4 seconds versus 3.2 seconds. The difference is structural: Webflow ships AWS hosting, a Fastly CDN, automatic image compression and no plugin layer, so the fast configuration is the default. A well-maintained WordPress site on managed hosting can match it - the problem is that a typical restoration site is not well maintained, which is exactly why the industry average LCP sits at 9.91 seconds.
What does a Webflow restoration website cost in 2026?
Platform fees are the small part: Webflow Basic is USD 15 per month billed yearly and the CMS-capable Premium plan is USD 25 yearly or USD 39 monthly, with hosting, CDN, SSL, DDoS protection, daily backups and scaling included - features that cost USD 50 to USD 200 a month as WordPress add-ons. Design and build for a professional contractor site runs USD 2,000 to USD 5,000 on either platform. Over three years, WordPress is typically cheaper for simple sites at USD 1,500 to USD 2,500 while Webflow tends to win on complex sites at USD 3,500 to USD 6,000 because maintenance is included rather than billed at USD 100 to USD 300 a month.
Can Webflow handle service-area pages for a multi-city restoration company?
That is its strongest use case in this vertical. The CMS on the Premium plan supports large collections and Webflow raised the CMS item ceiling to one million items in January 2026, so a restoration operator can generate water mitigation, mold remediation, fire and smoke and reconstruction pages across every city served from a single template with per-city fields for crew photos, response times, review counts and local schema. The discipline required is content, not technology: pages that differ only by city name compete with each other rather than ranking.
How long does migrating a restoration site to Webflow take?
Two to four weeks for a professional WordPress-to-Webflow migration, at an agency cost of roughly USD 2,500 to USD 5,000, or USD 0 to USD 200 in tooling if you do it yourself. Webflow has no direct WordPress importer, so content moves through CSV. The risk is not the build, it is the URL map: 42.7% of restoration sites have no sitemap and 50% carry duplicate page titles, so the pre-migration crawl usually finds more URLs than anyone expected. Never migrate during storm season - a redirect mistake during a flood event costs more than the whole project.
When should a restoration company stay on WordPress?
When the site is simple, someone competent already maintains it, and the money is better spent elsewhere. WordPress still holds roughly 43% of all websites and 62% to 65% of the CMS market, has more than 60,000 plugins, and runs a lightweight contractor site for under USD 300 a year if plugins are chosen carefully. Stay if you have a working maintenance relationship and pass Core Web Vitals. Move if your site is slow despite optimisation, updates require a developer, or plugin sprawl has made every change risky.
The verdict
Webflow is the right call for restoration companies with more than 15 to 20 pages, no reliable maintenance relationship, and a service-area page strategy that needs a real CMS - and it is overkill for a fast eight-page single-location site. The decisive statistics are 67% versus 35% on mobile Core Web Vitals, maintenance included versus USD 100 to USD 300 a month, and the 9.91-second industry average LCP that proves the market has not solved this on either platform. Fix page weight first, choose the platform that makes the fix permanent, and never launch in storm season. Talk to our team for a build-versus-migrate model on your own site.
Sources
Borah Labs - water damage restoration website benchmarks, July 2026
Onward Craft - WordPress vs Webflow for contractors, 2026
Enricher - Webflow market share and adoption statistics
Colorlib - CMS market share data 2026
Webflow - official plan pricing
Onward Craft - contractor website redesign guide and cost data
PipelineOn - contractor web design conversion benchmarks
WebFX - website cost benchmarks 2026
PipelineOn - water damage restoration marketing data