Table of contents
Referrals still carry 93% of restoration lead flow, but the adjuster and insurance-agent relationships that fed them fell from 68% to 55% of contractors in a single year. That is a branding problem wearing a sales-channel costume. Here are the 2026 numbers.
Key Takeaways
- Referrals remain the dominant lead source for 93% of restoration contractors (95% in 2025), while adjuster and agent relationships dropped from 68% to 55%.
- Experience and reputation is the primary differentiator for ~58% of contractors - brand perception, not price, is the stated battleground.
- 96% of homeowners say a recognisable brand matters when hiring a home services company; 79% prefer a company they perceive as local.
- Franchises carry 8-14 points lower net margin from 6-10% royalties plus 2-4% co-op fees - the price of borrowed recognition.
- Consistent brand presentation is linked to 23-33% revenue lifts, and 68% of businesses attribute 10-20% growth to consistency work.
- A wrapped truck generates 30,000-70,000 daily impressions at a ~USD 0.48 CPM, falling to USD 0.01-0.02 blended across a 5-7 year wrap life.
- 60% of consumers avoid companies with unappealing brand identities even when reviews are good, and 81% say trust is a prerequisite to purchase.
- Margin pressure overtook staffing as the industry’s top concern in 2026, with 19% of firms under 20% margins - up from 12% in 2025.
The market your brand is competing in
Scale first, because it explains the behaviour. The US damage-restoration niche - water, fire, mold and storm - is roughly USD 7.2 billion in annual revenue growing about 4% a year, split across roughly 62,582 firms, most of them small operators (Proofco). Demand is event-driven: the US absorbed 27 separate billion-dollar weather and climate disasters in 2024 totalling USD 182.7 billion, and insured catastrophe losses reached USD 115.6 billion.
Water is the everyday work. Water damage and freezing accounted for 22.6% of all homeowners insurance losses in 2023, the second-largest single cause, striking about 1 in 67 insured homes per year with an average claim severity of USD 15,400. Fire is rarer and larger (about 1 in 430 homes, USD 88,170 average). Translated to brand strategy: a homeowner will experience one water loss a decade, has no vendor shortlist, and will choose from whatever names are already in their head.
| Market metric | 2026 figure | Brand implication |
|---|---|---|
| US damage-restoration revenue | ~USD 7.2B, growing ~4%/yr | Fragmented - no dominant national mindshare outside franchises |
| US restoration firms | ~62,582 | Recognition, not capability, is the differentiator |
| Water damage share of homeowner losses | 22.6% (2023) | Water is the volume category worth owning |
| Average water & freezing claim | USD 15,400 | Ticket size supports real brand investment |
| Billion-dollar US disasters, 2024 | 27 events, USD 182.7B | Storm surges reward pre-built recognition |
| Most common revenue bracket | USD 1M-2.9M (28% of firms) | Brand budgets are SMB-sized - efficiency matters |
Referrals are holding. The relationships underneath them are not.
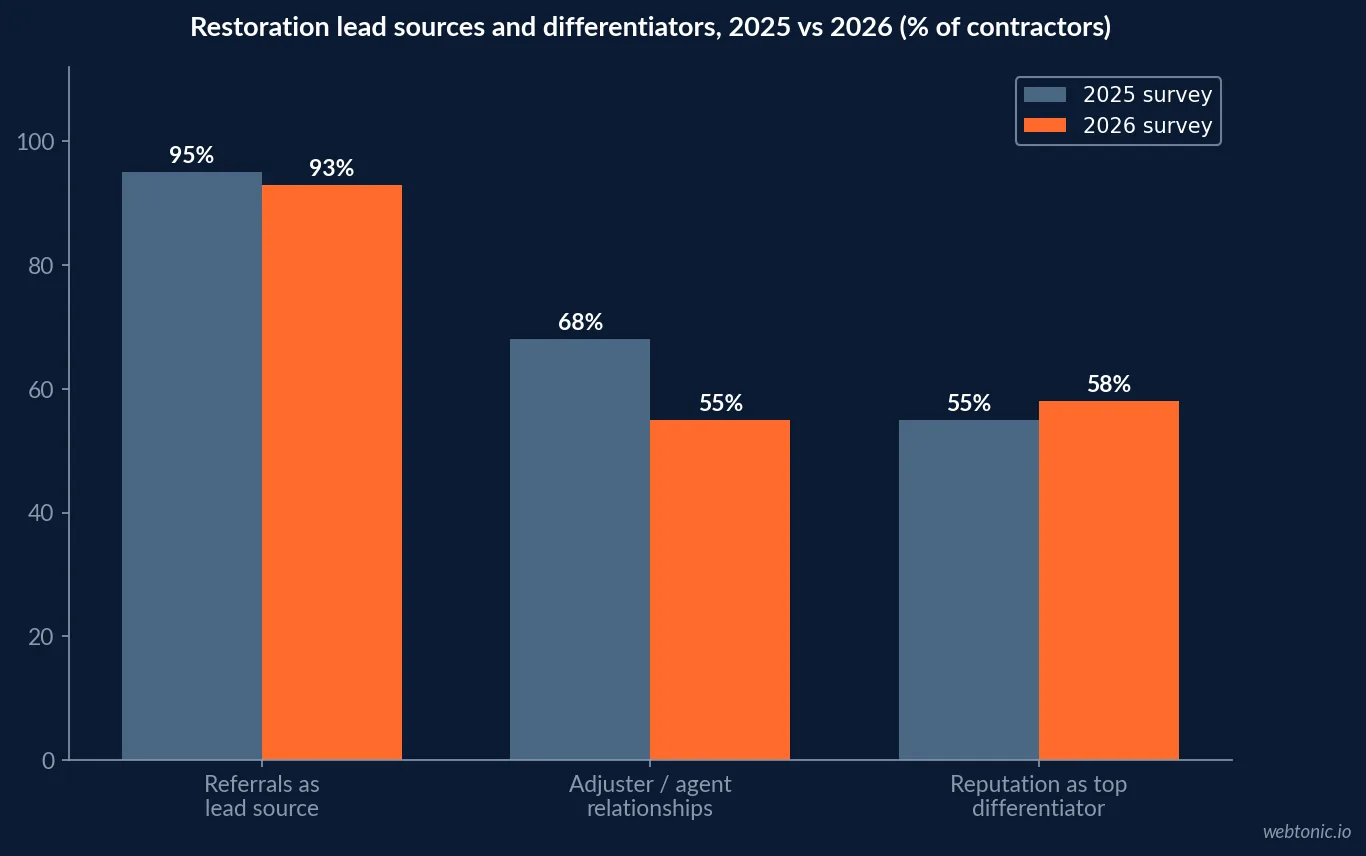
The 2026 Restoration Benchmarking Survey - 79% of respondents were owners or corporate management - found referrals cited as a lead source by 93%, nearly flat against 95% in 2025. The material shift is that adjuster and insurance-agent relationships registered at 55%, down from 68% in one year (Cleanfax). Meanwhile experience and reputation remains the primary differentiator for almost 58% of firms.
Read those three numbers together and the strategy writes itself. The channel that used to substitute for consumer brand - a named adjuster who sends you work - is thinning, while the thing being sold is still trust. That means restoration branding in 2026 is about being recallable to two audiences at once: the homeowner in a panic and the referral partner deciding whose card to hand over. Our water damage restoration SEO statistics cover the demand-capture half of that equation.
What homeowners say brand does to their choice
Home-services research is blunt on this point: 96% of homeowners say a recognisable brand is important when hiring, and 79% still prefer a company they perceive as local (Leads4Build). Nearly 70% of homeowners start their search for service professionals online, so "recognisable" now means recognisable in a search result, a map pack and a review profile at the same time (ServiceLine Pro).
General brand-trust research explains the mechanism. 81% of consumers say trust is a prerequisite for purchase, 68% report general trust in brands against 55% for institutions, and - the number restoration owners should sit with - 60% avoid companies with unappealing brand identities even when those companies have good reviews (Pivitt). A five-star contractor with a 2009 clip-art logo is losing jobs it already earned.
| Brand signal | Data point | Source type |
|---|---|---|
| Recognisable brand matters when hiring | 96% of homeowners | Home services research |
| Prefer a company perceived as local | 79% of homeowners | Home services research |
| Start the search online | ~70% of homeowners | Local growth research |
| Trust is a prerequisite to purchase | 81% of consumers | Forrester, 2025 |
| Avoid unappealing brand identities despite good reviews | 60% of consumers | Edelman Trust Barometer |
| Strong-brand B2B firms outperform weak-brand peers | +20% total shareholder return | McKinsey |
The franchise recognition premium, priced honestly
Franchising is the shortcut to recognition and it has a published price. Restoration franchise operators typically pay royalties of 6-10% of gross revenue plus marketing co-op fees of 2-4%, netting 8-14 percentage points lower net margin than independent competitors - while reaching higher revenue faster thanks to brand recognition and established TPA relationships (PushLeads). Top independent performers run 15-20% net margins, and franchise programmes also standardise the field presentation independents tend to neglect.
That trade lands differently in 2026 because maintaining margins and profitability moved to the top of the industry’s concern list, edging past recruiting. 19% of firms now report margins under 20%, up from 12% in 2025, while 22% report margins above 50%. Giving up 8-14 points of margin for recognition is a defensible trade when you are starting cold and an expensive one when you already own your market. The independent path is to buy the recognition directly - which is what the brand-consistency data prices.
| Path to recognition | Cost structure | Net margin impact | Speed to scale |
|---|---|---|---|
| National franchise | 6-10% royalty + 2-4% co-op | 8-14 points lower | Fastest |
| Independent, brand-invested | One-time identity + fleet + reviews | Top performers 15-20% net | Medium |
| Independent, referral-only | Relationship time | Highest per job, fragile | Slowest |
| Independent, paid-search-only | USD 610-1,700 per lead | Squeezed in storm months | Immediate, not durable |
Consistency beats redesign: the ROI evidence
The most quoted branding finding remains the most useful one: consistent brand presentation is associated with revenue increases of 23% (2016) to 33% (2019 update), and 68% of businesses report 10-20% revenue growth attributed to brand consistency initiatives. The counterweight is execution: 81% of companies still deal with off-brand content, and 40% of rebranding campaigns fail to deliver positive ROI. Meanwhile data-driven brand investment delivers efficiency gains of up to 30% without increasing the budget.
For a restoration company, consistency has a physical meaning: the same mark, colour and phone treatment on the truck, the uniform, the yard sign, the estimate PDF, the invoice and the Google Business Profile. A homeowner who sees the truck in the neighbourhood, then searches, then sees the same brand in the results converts at a materially higher rate than a cold searcher (PipelineOn). That is not a logo project; it is an asset-management project. For comparison across trades, see our roofing branding statistics.
Fleet graphics: the cheapest sustained impressions in restoration
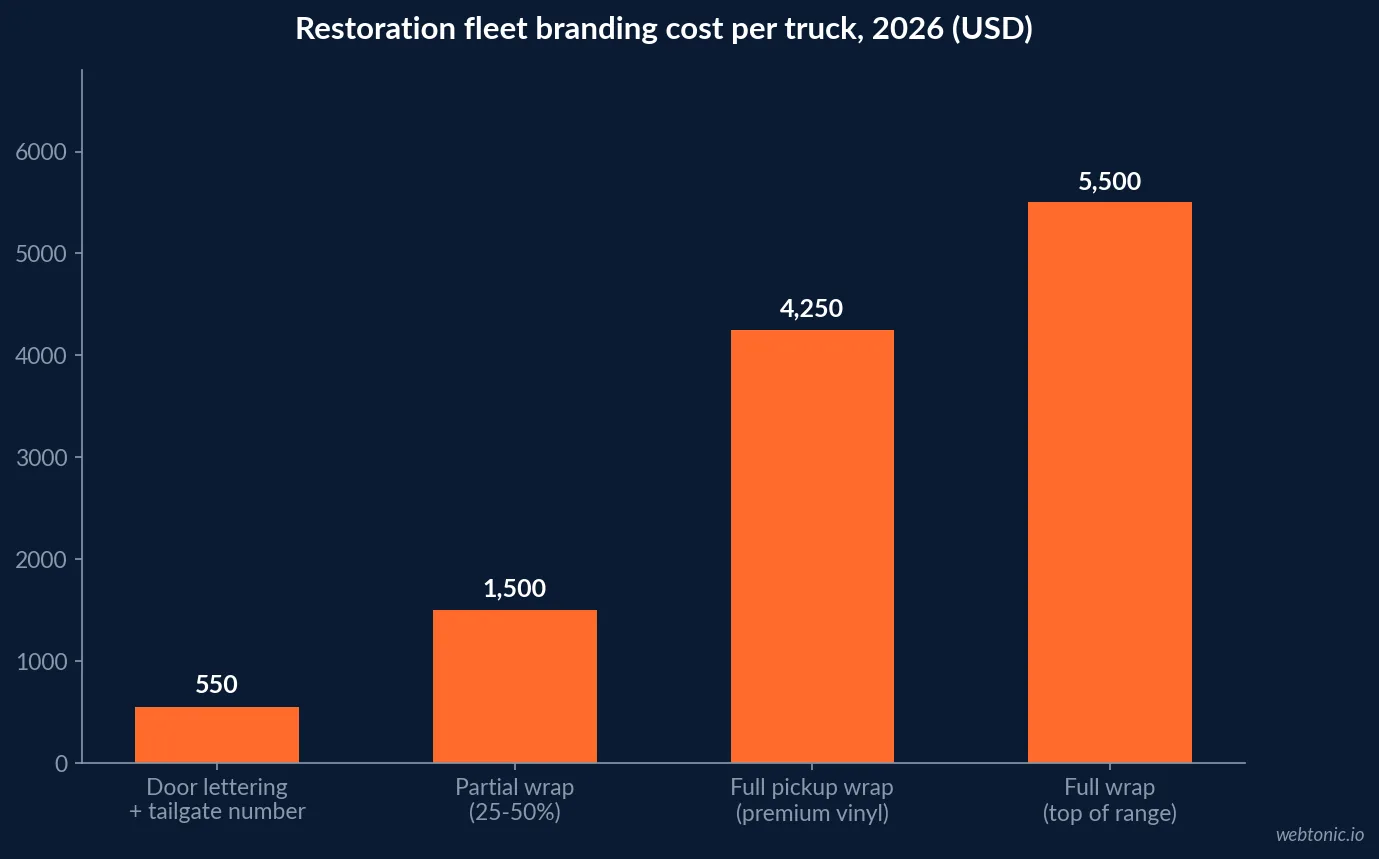
Restoration has an advantage most industries do not: the trucks are already parked in front of the customer’s neighbours for three days. Premium cast vinyl from 3M or Avery lasts 5-7 years on a daily-driven truck and generates 30,000-70,000 daily impressions at roughly a USD 0.48 CPM; spread across the wrap’s life with each truck producing 10-12 million annual impressions, the blended CPM lands in the USD 0.01-0.02 range. Pricing: USD 3,000-5,500 for a full pickup wrap, USD 1,000-2,000 partial, USD 400-700 for door lettering that still delivers 60-70% of the recall.
Contrast that with paid search in this vertical, where "water damage restoration" clicks reach USD 80 and cost per lead crosses USD 1,400 in competitive markets, peaking near USD 1,700 in storm months (99 Calls). Fleet branding does not replace lead generation - it lowers the cost of every lead you buy later by making the name familiar before the click.
| Fleet branding option | Cost per truck | Lifespan | Relative brand recall |
|---|---|---|---|
| Full wrap (premium cast vinyl) | USD 3,000-5,500 | 5-7 years | 100% (baseline) |
| Partial wrap (25-50% coverage) | USD 1,000-2,000 | 5-7 years | High |
| Door lettering + tailgate number | USD 400-700 | 5-7 years | 60-70% |
| 10-truck fleet: lettering programme | USD 4,000-7,000 total | 5-7 years | 70-80% at ~20% of wrap cost |
| 10-truck fleet: full wraps | USD 30,000-50,000 total | 5-7 years | 100% |
| UV protection layer | +15-20% of wrap cost | Extends wrap life | Protects recall over time |
A 2026 branding priority list for restoration owners
- Fix field consistency before the logo. Same mark and phone treatment on every truck, uniform and document - consistency is the 23-33% revenue lever, redesign is the 40% failure risk.
- Rebuild the referral surface. With adjuster and agent relationships down to 55%, give partners something branded and useful: response-time guarantees, documentation standards, a named contact.
- Buy fleet impressions. At USD 0.01-0.02 blended CPM this is the cheapest sustained media a contractor can own.
- Make the brand look local. 79% of homeowners prefer a company they perceive as local - lead with city, crew and years in market, not stock imagery.
- Treat reviews as brand assets. Reputation is the stated differentiator for 58% of firms; volume and recency do the work of a national ad budget.
- Price the franchise question properly. Recognition costs 8-14 points of net margin - model it against building the same recall yourself.
- Measure branded search and "saw the truck" answers. Add the question to the intake script; it is the only cheap attribution available for brand work. Talk to us via performance creative or contact.
Limits of this data
Two honest caveats. First, there is no published study measuring logo or brand-identity effects inside water damage restoration with statistical rigour; the strongest vertical numbers here are lead-source and margin data from the 2026 Restoration Benchmarking Survey and financial benchmarks, with the brand-effect figures drawn from home-services and general brand-trust research. Treat the 96% and 23-33% figures as directional cross-industry evidence, not restoration-specific causation. Second, the brand consistency studies are self-reported and now several years old, and 40% of rebrands fail to return - which is the clearest sign that these effects depend entirely on execution quality rather than on the decision to invest.
Frequently Asked Questions
Does branding actually matter in an emergency service like water damage restoration?
It matters precisely because the decision is fast. Homeowners are not comparing brand books at 2am; they are picking the name they already recognise. Roughly 96% of homeowners say a recognisable brand is important when hiring a home services company and 79% prefer a company they perceive as local. Referrals remain the dominant lead source for 93% of restoration contractors, and experience plus reputation is the primary differentiator for about 58% of them. Brand work in restoration is not aesthetics - it is the memory structure that gets you called first.
How much of restoration work still comes from referrals in 2026?
In the 2026 Restoration Benchmarking Survey, referrals were cited as a lead source by 93% of respondents, essentially unchanged from 95% in 2025. The change sits underneath that number: adjuster and insurance-agent relationships dropped to 55% from 68% a year earlier. So the pipeline is still relationship-driven, but one of the two relationship engines is weakening, which pushes weight onto homeowner-facing recognition, reviews and referral-partner brand recall.
Is a restoration franchise worth it just for the brand recognition?
It buys speed at a permanent margin cost. Franchise operators typically pay royalties of 6-10% of gross revenue plus marketing co-op fees of 2-4%, producing net margins roughly 8-14 points lower than comparable independents - but they reach higher revenue faster thanks to brand recognition and established TPA relationships. The independent counter-strategy is to build the recognition yourself: consistent brand presentation is associated with revenue lifts of 23-33%, and that compounds without a royalty attached.
What is the highest-ROI branding investment for a restoration company?
For most independents, the fleet. Premium cast vinyl lasts 5-7 years, and a wrapped truck generates 30,000-70,000 daily impressions at roughly a USD 0.48 CPM - blended over the wrap's life the effective CPM lands in the USD 0.01-0.02 range. A full pickup wrap costs USD 3,000-5,500; door lettering at USD 400-700 per truck delivers 60-70% of the recall. On a five-plus truck fleet, lettering plus a clean phone number produces roughly 70-80% of the brand lift at about 20% of the cost. Nothing else in restoration marketing prices that low per impression.
How do you know if a rebrand is a mistake?
Check whether the problem is recognition or reputation first. About 40% of rebranding campaigns fail to deliver a positive return, and 81% of companies still deal with off-brand content even after investing in guidelines - so a new logo on top of inconsistent execution changes nothing. In restoration specifically, if referrals are 93% of your pipeline and adjuster relationships are thinning, the higher-return work is usually review volume, response speed and consistent field presentation, not a wordmark.
Sources
Cleanfax - 2026 Restoration Benchmarking Survey Report
Proofco - The State of Restoration (June 2026)
PushLeads - Restoration Financial Benchmarks & KPIs
PipelineOn - Truck Wraps for Contractors 2026
Leads4Build - Home Services Industry Statistics
Pivitt - Brand Transformation Statistics
ServiceLine Pro - Branding for Home Services 2026
99 Calls - Google Ads Lead Costs for Water Damage Restoration
Water Restoration Marketing - Why Invest in Branding
Amra & Elma - Brand Consistency ROI Statistics