Table of contents
A solar website used to sell a discount. In 2026 it has to defend a 10.4-year payback - up from 7.4 years one quarter earlier - against a market forecast to shrink 21%. That makes the site a calculation and transparency machine. Here is what the data says about running it on Webflow.
Key Takeaways
- Webflow powers about 2.8% of websites in 2026, against 42.4% for WordPress.
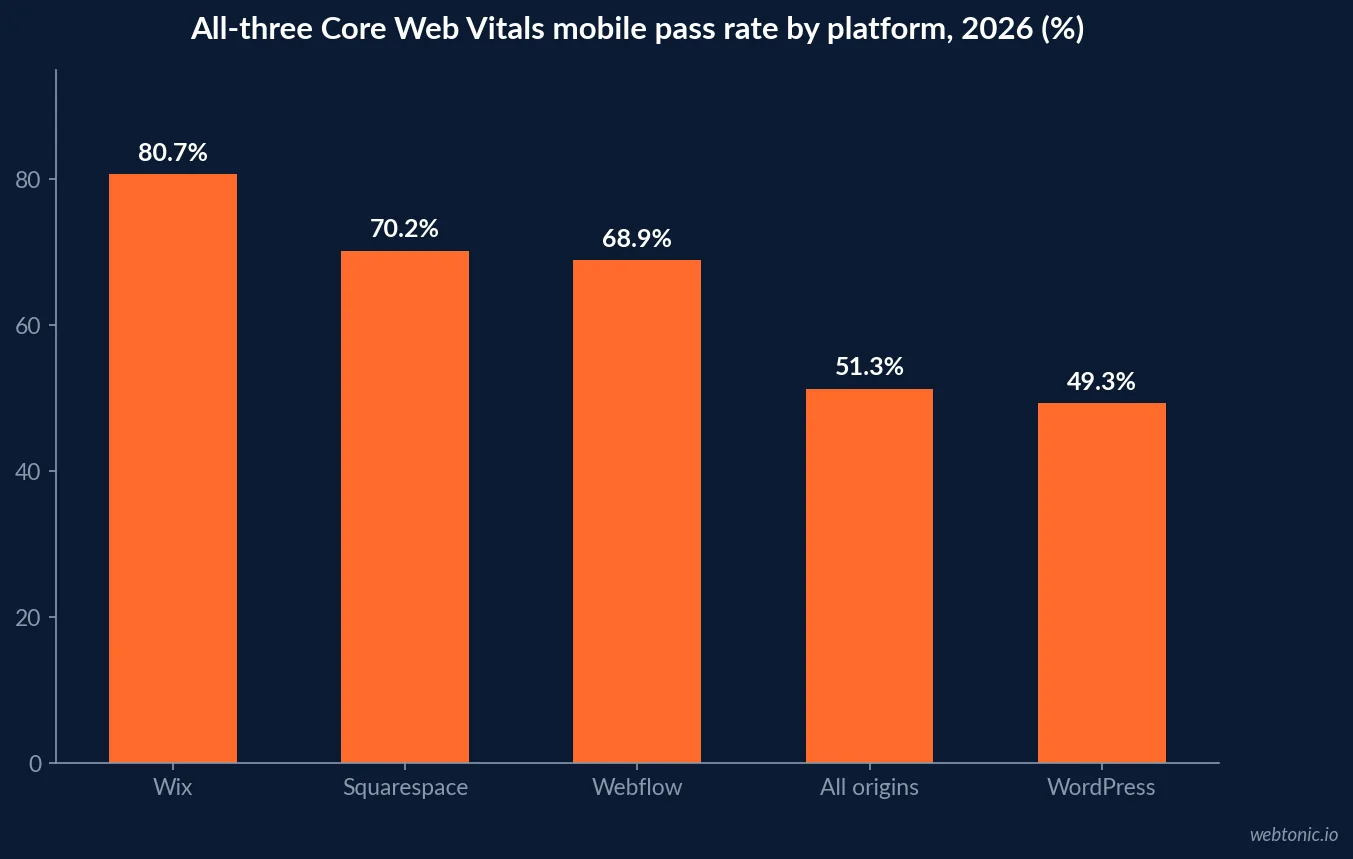
- 68.9% of Webflow sites pass all three Core Web Vitals on mobile, against 49.3% of WordPress sites.
- Wix (80.7%) and Squarespace (70.2%) beat Webflow on that pass rate - Webflow is fast, not fastest.
- Median Webflow LCP is about 1.8 seconds against 2.8 seconds on WordPress.
- Webflow ships roughly 918KB of JavaScript per page against 1,707KB on Wix.
- Only 51.3% of all origins pass all three Core Web Vitals on mobile in 2026.
- Bounce rate rises 32% at three seconds and 90% at five seconds.
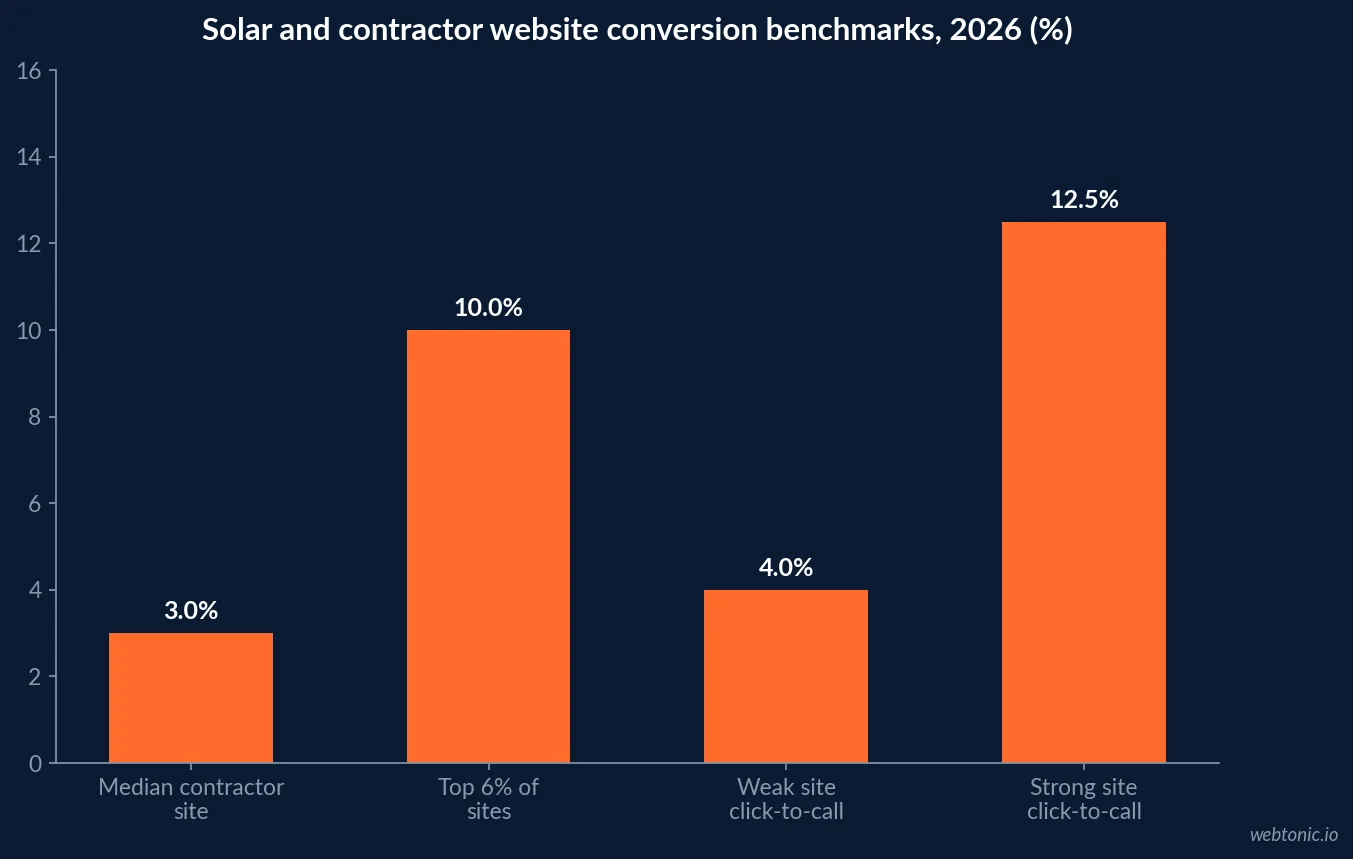
- Contractor sites convert 2% to 4% of visitors; the top 6% convert at 8% to 12%.
- Click-to-call runs 3% to 5% on weak sites against 10% to 15% on well-built ones.
- AEC and construction redesigns averaged 340% ROI with break-even at 8.3 months.
- Webflow plans in 2026: $14 Basic, $23 CMS, $25 Premium, $39 Business per month billed yearly.
- Webflow revenue reached $213 million in 2024, up 66%.
- 61.94% of 16 million studied pages were never indexed by Google.
- Payback periods moved from 7.4 years in Q3 2025 to 10.4 years in Q4.
- Median marketplace pricing was $2.49 per watt at an average system size of 11.8 kW.
- Battery attachment slipped from 41% to 38%.
- Installers publishing pricing convert 15% to 25% higher than those gating it.
- 88% of homeowners read reviews before hiring a solar company.
- Residential acquisition cost reached roughly $0.85 per watt, close to $10,000 per sale on larger systems.
- Community solar subscriber acquisition cost is $69 per kW, down 12%.
Platform benchmarks at a glance
Market share and speed figures come from 2026 website builder market share data, Webflow platform statistics and builder speed comparisons.
| Platform | Share of websites | All-3 CWV pass (mobile) | Median LCP | JS per page |
|---|---|---|---|---|
| Webflow | 2.8% | 68.9% | 1.8s | 918KB |
| WordPress | 42.4% | 49.3% | 2.8s | Varies by stack |
| Wix | - | 80.7% | - | 1,707KB |
| Squarespace | - | 70.2% | - | - |
| All origins | 100% | 51.3% | - | - |
Why speed matters more once payback gets longer
When the federal credit made the maths obvious, a slow site cost a percentage of leads. Now that payback has stretched to 10.4 years, the visitor arrives sceptical and comparison-shopping across three or four installers. Bounce rate rises 32% at three seconds and 90% at five seconds, and only 51.3% of origins pass Core Web Vitals on mobile at all. A calculator that takes six seconds to appear is a calculator nobody uses.
Webflow's hosting removes the usual causes - plugin bloat, unoptimised media, shared hosting - but not all of them. Solar sites carry heavy assets by nature: drone footage, panel imagery, 3D roof renders, embedded design tools. The platform is fast until you embed a 2MB proposal widget above the fold. Our solar technical SEO benchmarks cover what that does to crawling and AI visibility.
What the conversion data actually says
Independent contractor studies put median site conversion at 2% to 4%, with the top 6% of sites at 8% to 12%, per contractor website research and contractor conversion benchmarks. The gap is not template quality. It is whether the page answers the three questions a 2026 solar buyer arrives with.
| Buyer question | What most solar sites do | What the top decile does | Data point |
|---|---|---|---|
| What will this cost me? | Gate price behind a call | Publish price-per-watt and system ranges | 15%-25% higher conversion when pricing is published |
| When do I break even? | Vague savings claims | Estimator using the local utility rate | Payback moved 7.4 to 10.4 years |
| Can I trust the installer? | Stock photos and badges | Named crews, monitored production, review volume | 88% of homeowners read reviews first |
| Do I need a battery? | Upsell language | Honest attachment guidance and cost delta | Attachment slipped 41% to 38% |
| Is there an option without a roof? | Nothing | Community solar subscription path | $69 per kW subscriber CAC |
Click-to-call is the cheapest fix on the list: 3% to 5% on weak sites against 10% to 15% on well-built ones. A persistent call bar and a form under six fields move more revenue than a redesign.
The calculation layer Webflow does not give you
This is the honest limitation. Webflow has no plugin marketplace, so every piece of solar-specific functionality is an embed, an API call or a build. Plan for it rather than discovering it mid-project.
| Solar feature | Webflow approach | Effort | Worth it? |
|---|---|---|---|
| Savings and payback estimator | Custom code embed or third-party widget | Medium | Yes - the core asset |
| Utility rate lookup by ZIP | API call plus custom code | Medium-high | Yes in multi-utility markets |
| Instant proposal or roof design | Vendor embed (iframe) | Low | Yes, but keep it below the fold |
| Financing pre-qualification | Lender-hosted embed | Low | Yes |
| Live production dashboard from installs | Monitoring API plus CMS | High | Only for established brands |
| Community solar sign-up | Native Webflow forms plus CRM | Low | Yes where programmes exist |
The CMS trap: hundreds of fast pages nobody sees
Webflow's CMS makes 300 city pages a weekend of work, which is precisely the danger. In a study of 16 million pages, 61.94% were never indexed by Google. Solar is unusually exposed because ZIP-level templating feels justified - rates, incentives and permit rules genuinely differ - yet the pages usually differ only by name.
| Location page element | Templated (fails) | Substantive (works) |
|---|---|---|
| Utility | Generic mention | Named utility with its current residential rate |
| Incentives | Copy of federal text | State and municipal programmes with amounts and deadlines |
| Permitting | Omitted | Local permit and interconnection timelines in weeks |
| Proof | Stock roof photo | Two or three local installs with system size and production |
| People | Nothing | Named crew or regional manager |
| Volume | 300 ZIP pages | 20-40 real market pages |
Cost of ownership in 2026
Against the 2026 plan structure, platform cost is not a decision input for a company selling $25,000 to $35,000 systems. Webflow itself reached $213 million in 2024 revenue, up 66%, so platform durability is also not the risk it was in 2019.
| Line item | Typical 2026 cost | Notes |
|---|---|---|
| Site plan (Basic) | $14/month yearly | Brochure site, no CMS |
| Site plan (CMS) | $23/month yearly | Needed for location and project collections |
| Site plan (Business) | $39/month yearly | Higher traffic and form limits |
| Design and build | $8,000-$40,000 one-off | Where the actual money goes |
| Estimator or proposal embed | $0-$500/month | Vendor dependent |
| Content per market page | $150-$400 | The reason 300 pages is a bad idea |
Where Webflow costs a solar company something
Three real trade-offs, stated plainly: no plugin ecosystem, so every integration is engineering time; editor licensing costs add up if a large sales team publishes; and multilingual or multi-region setups are clumsier than on WordPress. For an installer running one language and one country with a marketing team of two, none of these bite. For a national developer with regional microsites, they do.
Measurement is the part most installers skip
A fast site that cannot tell you which market produced which sale is a cosmetic upgrade. With around 40% of home-services phone leads carrying no recorded source and phone converting at 46% against 1.7% for forms, call tracking and CRM source capture matter more than any layout choice. Wire them at launch - our solar attribution benchmarks and the data intelligence team cover the setup.
| Launch requirement | Why | Check before go-live |
|---|---|---|
| Call tracking on every number | 40% of phone leads have no source | Dynamic number insertion live |
| Form to CRM with source fields | Only 52% of CRM users fill lead source | Test submission end to end |
| Consent-mode analytics | Compliance plus data continuity | Tags fire in both consent states |
| Core Web Vitals on real devices | 51.3% of origins fail | Field data, not lab scores |
| Indexation monitoring | 61.94% of pages never get indexed | Coverage report weekly for 60 days |
| Review feed on key pages | 88% of homeowners read reviews | Live rating, not screenshots |
Migration order that protects lead flow
Rebuild in the order that protects revenue: money pages first, content library last. In a contracting market where acquisition cost is forecast to rise 40%, a two-week traffic dip is far more expensive than it was in 2024.
| Phase | Scope | Duration | Guardrail |
|---|---|---|---|
| 1 | Home, main service and quote pages | 2-3 weeks | 301 map written before launch |
| 2 | Estimator, financing and proof content | 2 weeks | Test on mid-range Android |
| 3 | 20-40 substantive market pages | 3-4 weeks | No page ships without local data |
| 4 | Blog and resource library | 2 weeks | Preserve URLs exactly |
| 5 | Measurement and review integrations | 1 week | Verify before turning ads back up |
Reputation carries more weight than any of it in a post-incentive market; the solar branding statistics put numbers on why review volume and published pricing beat visual refreshes.
Frequently Asked Questions
Is Webflow a good platform for a solar company website?
For most installers, yes - on speed, security and maintenance grounds rather than design ones. Webflow sites pass all three Core Web Vitals on mobile 68.9% of the time against 49.3% for WordPress, with a median largest contentful paint near 1.8 seconds versus 2.8 seconds, and ship about 918KB of JavaScript against 1,707KB on Wix. The trade-off is the missing plugin ecosystem: a solar design tool, utility-rate lookup or financing calculator has to be an embed or a custom integration rather than a plugin install.
How much does a Webflow site cost a solar installer?
After the 2026 pricing simplification, a Basic site plan is $14 per month billed yearly, Premium is $25, CMS is $23 and Business is $39, plus workspace seats if a marketing team edits. Against a $25,000 to $35,000 system price and a residential acquisition cost near $0.85 per watt - roughly $10,000 on a large system - the subscription is rounding error. The build, the calculator integration and the content are the real budget.
Will moving to Webflow increase solar leads?
Only through speed, clarity and honest numbers. Contractor sites convert 2% to 4% of visitors while the top 6% convert at 8% to 12%, and click-to-call rates run 3% to 5% on weak sites against 10% to 15% on well-built ones. Construction and AEC redesign programmes averaged 340% ROI with break-even at 8.3 months. Since payback periods moved from 7.4 to 10.4 years, the site now has to publish the arithmetic instead of hiding it - installers publishing pricing convert 15% to 25% higher than those gating price behind a sales call.
How should solar location pages be built in Webflow?
As a small number of substantial pages, not a ZIP-code template farm. In one study of 16 million pages, 61.94% were never indexed by Google, with templated location pages heavily represented. A solar CMS collection needs genuine per-market substance - the local utility and its current rate, net-metering rules, permit and interconnection timelines, real installed systems with production data - or it produces a large, fast, invisible site.
What does a solar site need that a generic contractor site does not?
A calculation layer and a proof layer. The buyer is comparing a 10.4-year payback against alternatives, so the site needs a savings or payback estimator, a transparent price-per-watt reference against the $2.49 per watt median, battery attachment options now that attachment has slipped from 41% to 38%, and monitored production data from real local installs. It also needs a community-solar subscription path in states that have one, since subscriber acquisition cost is $69 per kW against thousands per rooftop sale.
Sources
Colorlib - Website Builder Market Share 2026
Popupsmart - Webflow Statistics
Webflow - Simplified Plans and Updated Pricing 2026
PageSpeed Matters - WordPress vs Webflow vs Squarespace Speed
Onward Craft - Contractor Website Study
PipelineOn - Contractor Website Conversion Rates
Siana Marketing - Website Redesign ROI Statistics
pv magazine USA - Record 2025 Demand and 2026 Payback Data
Wood Mackenzie - Residential Solar CAC to Spike 40% in 2026
SurgePV - Building a Solar Brand That Outlasts Incentive Cycles