Table of contents
Residential solar payback stretched from 7.4 years to 10.4 years in a single quarter, and acquisition cost is forecast to spike 40% in 2026. In that market, an attribution error no longer trims margin - it decides whether the deal happens at all.
Key Takeaways
- The 30% Section 25D residential credit expired 31 December 2025, and Wood Mackenzie expects US residential volume to contract about 21% in 2026.
- Residential customer acquisition cost is forecast to rise about 40% in 2026 after falling 10% in 2025.
- Simple payback moved from 7.4 years in Q3 2025 to 10.4 years in Q4 2025, lengthening every consideration window a marketer has to measure.
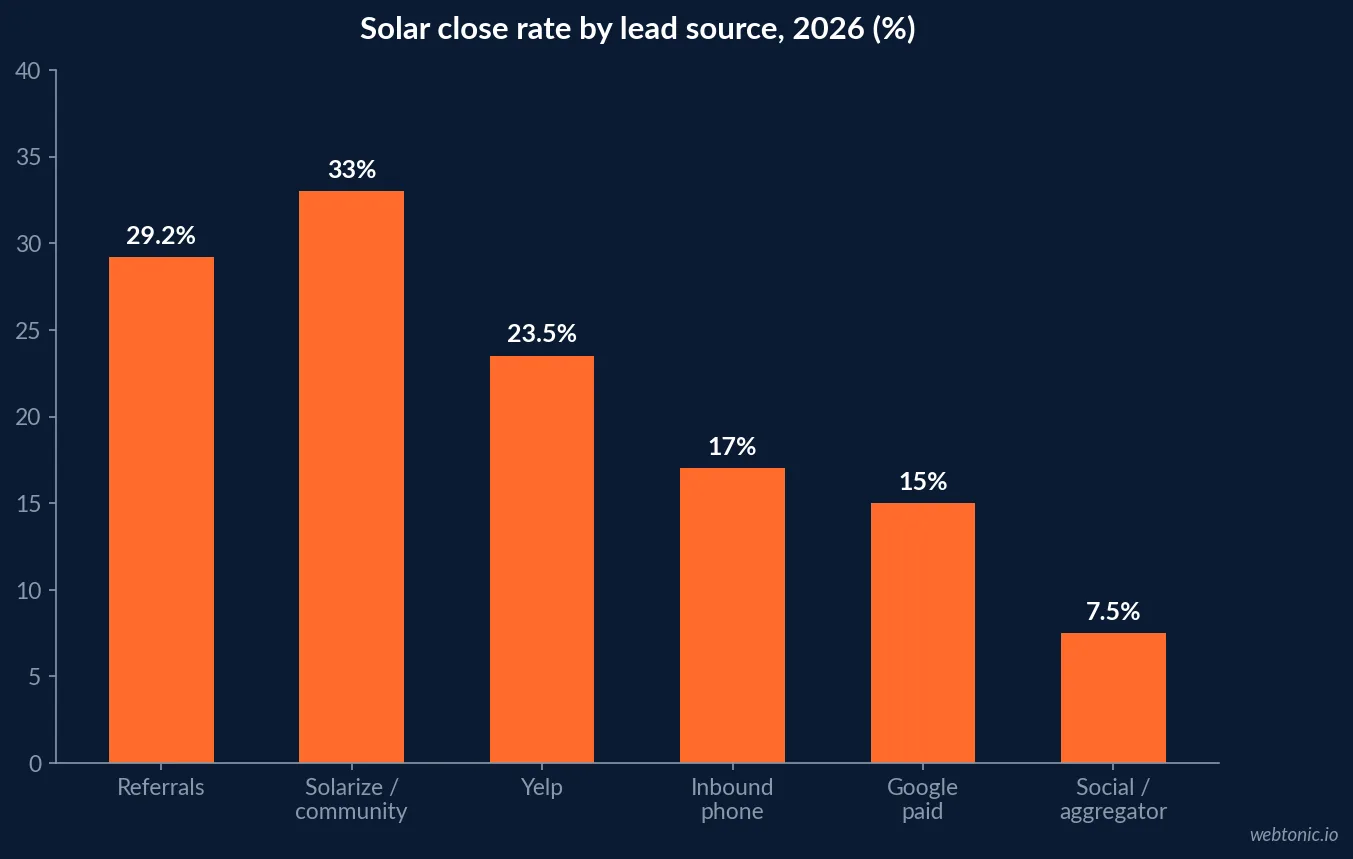
- Close rates by source are wildly unequal: Solarize programmes 33%, referrals 29.2%, radio about 30%, Yelp 23.5%, inbound phone 17%, Google paid 15%, paid social and aggregators 5-10%.
- Last-click reporting misallocates 40% to 60% of channel credit in long-cycle home services.
- Residential acquisition costs up to $0.85 per watt - about $10,000 on the median 11.8 kW system priced at $2.49 per watt.
- Commercial business-to-business acquisition runs about $0.43 per watt, with projects of $200,000 to $5M+ and 6 to 18 month cycles.
- Community solar subscriber acquisition averaged $69 per kW in 2026, down 12%, but low-and-moderate-income acquisition costs ran 34% higher.
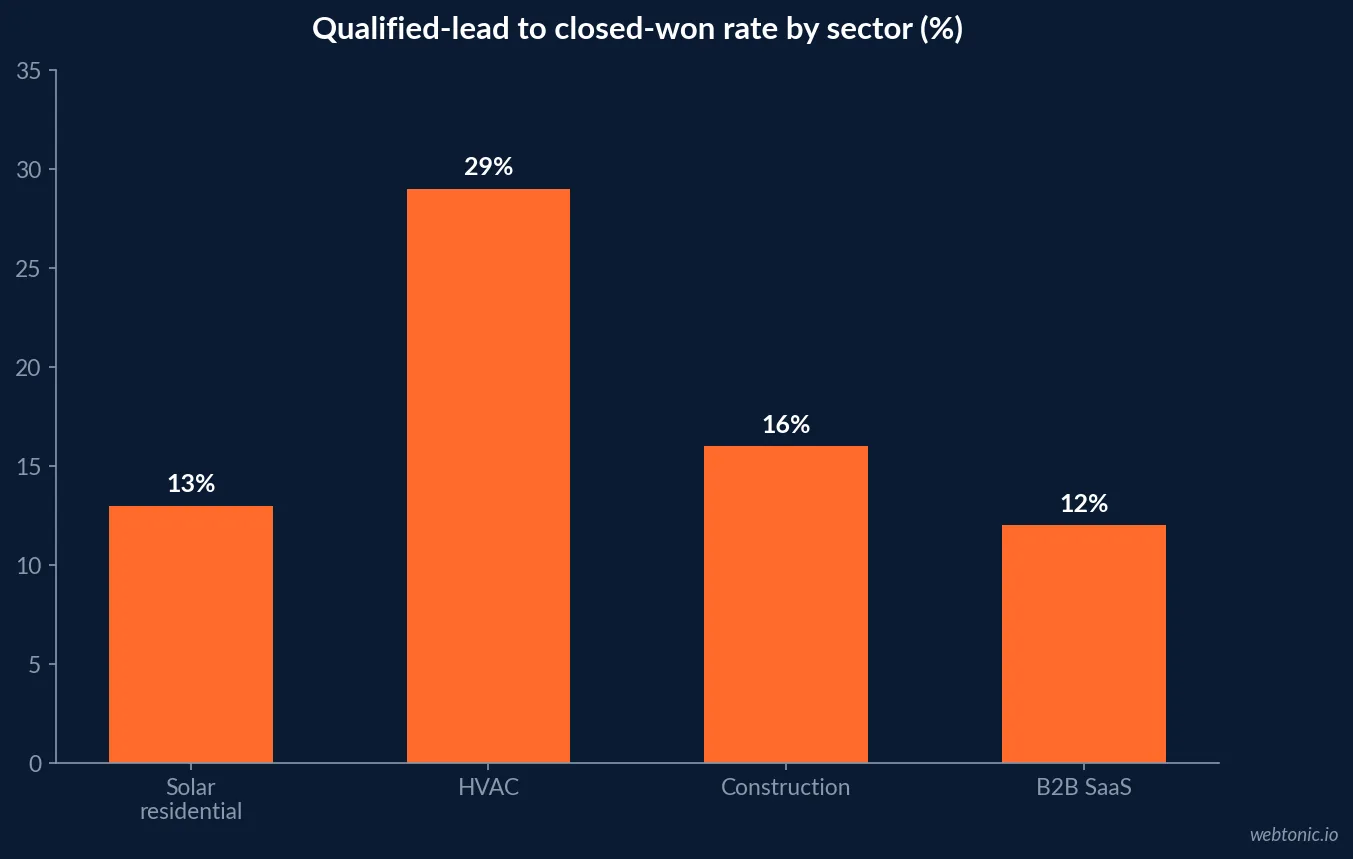
- Qualified-lead to closed-won sits at about 13% in solar against 29% in HVAC and 16% in construction.
- Phone leads convert at about 46% versus 1.7% for forms, yet about 28% of business calls go unanswered.
- Only 52% of CRM users fill the lead-source field and roughly 40% of home-services phone leads never get a source attached.
- Only 1.3% of 1,222 audited home-services Facebook advertisers ran both the pixel and the Conversions API; pixel-only accounts lose 30% to 60% of iOS signal.
- Door-to-door drives 30% to 40% of residential sales at $1,200 to $2,000 loaded cost per deal, and ad pre-warming cuts acquisition cost 20% to 30%.
- The US installed 43.2 GW in 2025, down 14%, and still supplied 54% of new generating capacity.
Close rate by source is the attribution story
Installer data published by Surge PV and the Ipsun and Sunvoy channel breakdowns show a spread no blended cost-per-lead figure can survive. A source closing at 29.2% and a source closing at 7% are not the same lead with different prices; they are different products.
| Lead source | Close rate | Typical cost per lead | Implied cost per signed job |
|---|---|---|---|
| Solarize / community programme | ~33% | Programme fee | Lowest of any channel |
| Homeowner referral | 29.2% | $500-$1,500 payout | ~$1,700-$5,100 |
| Radio / brand recall | ~30% | Blended brand spend | Hard to isolate without holdout |
| Yelp | 23.5% | $40-$90 | ~$170-$380 |
| Inbound phone | 17% | Blended | ~$235-$700 |
| Google paid search | 15% | $40-$120 | ~$265-$800 |
| Paid social / shared aggregator | 5-10% | $15-$60 | ~$200-$1,200 |
Why the 2026 market punishes bad measurement
The residential credit sunset changed the arithmetic. Wood Mackenzie expects residential acquisition cost to rise about 40% this year after a 10% decline in 2025, while volumes contract roughly 21%. According to SEIA, the US installed 43.2 GW in 2025, down 14% year over year, and solar was still 54% of all new generating capacity. Fewer buyers, dearer clicks: the installers who keep growing are the ones who can see which touch actually produced the contract.
Meanwhile payback - the single number a homeowner compares - moved from 7.4 to 10.4 years between Q3 and Q4 2025 in marketplace data reported by pv magazine USA. Longer payback means longer deliberation, which means more touches between first contact and signature, which is exactly the condition under which last-click reporting breaks.
Cost per watt beats cost per lead
Solar is one of the few local industries where deal size varies by an order of magnitude, so a per-lead metric is structurally misleading. Normalising to capacity fixes it.
| Segment | Acquisition benchmark | Typical deal size | What the metric hides if ignored |
|---|---|---|---|
| Residential (high end) | ~$0.85 per watt (~$10,000) | 11.8 kW at $2.49/W | Small systems bought at big-system acquisition cost |
| Residential (efficient) | $200-$400 per acquired customer on ads | $25,000-$35,000 after incentives | Channels feeding unqualified roofs |
| Commercial / C&I | ~$0.43 per watt, $1,000-$3,000+ CAC | $200,000-$5M+ | 6-18 month cycles read as failed campaigns |
| Community solar | $69 per kW subscriber (-12%) | Subscription | LMI segments costing 34% more per subscriber |
| Service / O&M | Cheapest per dollar of revenue | Per visit | 51% of installers service systems they did not install |
The same logic applies to the funnel rate you benchmark against. Solar qualified leads close at about 13%, versus 29% in HVAC, 16% in construction and 12% in B2B software - so importing an HVAC dashboard target into a solar business will make every channel look broken.
Where solar attribution data actually dies
Most installers do not have a modelling problem; they have a data-capture problem. The failure points are consistent across the home-services audits published by PipelineOn.
| Failure point | Benchmark | Revenue consequence |
|---|---|---|
| Last-click only | Misallocates 40-60% of credit | Cutting the channel that started the deal |
| Lead-source field blank | Only 52% of CRM users fill it | Half the pipeline unattributable |
| Phone leads untracked | Phone converts ~46% vs 1.7% forms | The best channel looks like the worst |
| Unanswered calls | ~28% of business calls go unanswered | Paid demand leaking before capture |
| Pixel without server-side | 1.3% of 1,222 advertisers run both | 30-60% of iOS signal lost |
| No CRM at all | ~45% of contractors above $1M use one | No closed-loop reporting possible |
Modelling the commercial cycle
Commercial and industrial solar is where attribution windows have to be rebuilt from scratch. Per LeadHaste and ioQuery, C&I lead-to-deal runs 5% to 10% over a 6 to 18 month cycle, commercial search clicks cost $15 to $50, and strong programmes book 6 to 12 qualified meetings a month. A 30-day attribution window on that shape of business reports zero.
| Cycle stage | Typical elapsed time | Signal to record | Platform window needed |
|---|---|---|---|
| First touch | Month 0 | Campaign, territory, utility rate band | First-touch stored in CRM |
| Site qualification | Month 0-2 | Roof size, ownership, utility rate >$0.12/kWh | N/A - CRM only |
| Proposal | Month 1-6 | Proposal value in watts | Offline conversion upload |
| Contract | Month 3-12 | Signed watts, not lead count | 90-day+ window or offline import |
| Install / commissioning | Month 6-18 | Recognised revenue | Annual cohort reporting |
Door-to-door and referral are media channels
Door-to-door still accounts for 30% to 40% of US residential sales with rep turnover of 60% to 80% and a loaded cost of $1,200 to $2,000 per closed deal. Advertising into a territory before canvassers walk it cuts acquisition cost 20% to 30% - a measurable interaction effect that only exists in the data if canvassed territories carry codes. The same is true of referrals: a $500 to $1,500 residential payout (up to $5,000 on commercial) is media spend on the highest-closing channel in the business, and it belongs in the same spreadsheet as the Google budget. Our view on structuring that closed loop sits in data intelligence, and the paid side in growth marketing.
Channel economics after the credit sunset
With 25D gone, allowable acquisition cost per channel has to be rebuilt from margin, not from last year’s cost per lead. A system priced at $2.49 per watt across a median 11.8 kW array leaves a fixed gross-profit envelope, and every channel has to fit inside it at its own close rate.
| Channel | Cost per lead | Close rate | Cost per signed job | Verdict at 2026 economics |
|---|---|---|---|---|
| Local Services Ads | $30-$80 | ~20-30% | $100-$400 | Keep and cap by capacity |
| Google paid search | $40-$120 | 15% | $265-$800 | Keep; tighten to intent terms |
| Facebook / Meta | $15-$50 | 5-10% | $150-$1,000 | Keep only with server-side events |
| Shared aggregator leads | $20-$60 | 5-10% | $200-$1,200 | Cut unless speed-to-lead is under 5 min |
| Referral programme | $500-$1,500 payout | 29.2% | $1,700-$5,100 | Fund harder; highest close rate |
| Door-to-door | $1,200-$2,000 loaded | Territory dependent | $1,200-$2,000 | Pre-warm with ads for a 20-30% saving |
Two habits fall out of that table. Cap the channels that scale on volume by installation capacity rather than by budget, because a contracting market makes over-buying leads a cash problem inside one quarter. And price the referral programme against paid, not against zero - a $1,500 payout that closes at 29.2% beats a $60 lead that closes at 7% on cost per signed job. If you want a second opinion on the model before rebuilding it, our team is reachable via contact.
Trust signals distort attribution too
About 88% of prospects read reviews before contacting an installer, companies with 100+ reviews close 22% to 28% better than those under 30, and 4.7 stars is the practical threshold. Reviews are not a channel with a spend line, so their contribution surfaces as an unexplained lift in branded search close rate. The same applies to published pricing, which converts 15% to 25% higher, and yard signs, which generate 1 to 3 inquiries each. Any honest model treats these as multipliers on paid channels, not competitors to them - a pattern we also documented for HVAC branding.
A 90-day attribution rebuild for a solar installer
| Weeks | Action | Success measure |
|---|---|---|
| 1-2 | Dedicated tracking numbers per channel plus recorded-call review | >95% of calls attributed to a source |
| 3-4 | Make CRM lead-source mandatory and validated at close | Blank source rate under 5% |
| 5-6 | Send server-side conversions (contract signed, watts) to ad platforms | Both pixel and server events firing |
| 7-8 | Switch reporting to cost per watt acquired by channel | Per-watt cost visible for every channel |
| 9-12 | Run one geo holdout on the largest paid channel | Incremental lift measured, not assumed |
What to stop reporting
- Blended cost per lead. With close rates from 5% to 33%, a blended figure averages away the only decision it is meant to inform.
- Last-click revenue by channel. Keep it as a directional read; never budget from it.
- Form fills as the primary conversion. Phone converts about 46% versus 1.7%.
- 30-day windows on commercial. The cycle is 6 to 18 months.
- Lead volume growth. In a market contracting 21%, signed watts is the only growth number that matters.
Frequently Asked Questions
Why does last-click attribution fail in solar?
Because the solar decision is long and social. Residential payback stretched from 7.4 years in Q3 2025 to 10.4 years in Q4 2025, commercial cycles run 6 to 18 months, and referrals close at 29.2% against 15% for Google paid. A homeowner typically hears about an installer from a neighbour, checks reviews, then searches the brand and converts - last click awards the whole job to branded search and hides the channel that created it. Audits of home-services accounts find last-click misallocates 40% to 60% of channel credit.
What is the right primary metric for solar marketing?
Cost per watt acquired, not cost per lead. Residential acquisition runs about $0.85 per watt at the high end - roughly $10,000 on a median 11.8 kW system - while business-to-business commercial acquisition sits near $0.43 per watt. Because system size varies from 6 kW to multi-megawatt, two channels with identical $80 costs per lead can differ by 3x on cost per watt. Community solar has its own unit: subscriber acquisition averaged $69 per kW in 2026, down 12%, with low-and-moderate-income segments costing 34% more.
How much of a solar CRM's attribution data is usable?
Less than half in most installers. Only about 52% of CRM users actually fill the lead-source field, roughly 40% of home-services phone leads never get a source attached at all, and only about 45% of contractors above $1M revenue run a CRM in the first place. Since phone leads convert at about 46% versus 1.7% for web forms, an installer without call tracking is blind on the majority of its revenue-producing conversations.
How should door-to-door and referral touches be tracked?
As paid media touches with their own unique identifiers. Door-to-door still drives 30% to 40% of US residential solar sales at a loaded cost of $1,200 to $2,000 per closed deal, and pre-warming a territory with advertising cuts acquisition cost 20% to 30% - an effect that only shows up if canvassed territories carry a territory code in the CRM. Referral payouts of $500 to $1,500 residential and up to $5,000 commercial should be logged as campaign spend so the 29.2% close rate is priced honestly.
What attribution setup does a solar installer actually need in 2026?
Four layers: call tracking with dedicated numbers per channel, a mandatory CRM lead-source field validated at close, server-side conversion sending so paid platforms see signed contracts instead of form fills, and a geo holdout to sanity-check incrementality. Only 1.3% of 1,222 audited US home-services Facebook advertisers ran both the pixel and the Conversions API, and pixel-only accounts lose 30% to 60% of iOS signal, so the cheapest attribution win for most installers is still server-side event sending.
Sources
Wood Mackenzie - Residential Solar CAC Set to Spike 40% in 2026
SEIA - Solar Market Insight Report Q2 2026
pv magazine USA - Residential Payback Lengthens
Surge PV - Building a Solar Brand Identity
Surge PV - Commercial Solar Sales Cycle
LeadHaste - B2B Lead Generation for Solar
ioQuery - Commercial Solar Leads
PipelineOn - Marketing Attribution for Home Services
PipelineOn - Meta Pixel vs CAPI (1,222-advertiser audit)
Daly Advertising - Solar Marketing Benchmarks
RivetOps - Why CRM Reports Do Not Match Reality