Table of contents
The 30% Section 25D residential tax credit expired on 31 December 2025, and with it the discount that covered for interchangeable solar brands. In a market Wood Mackenzie expects to contract about 21% in 2026 while acquisition costs spike roughly 40%, brand equity became the cheapest line in the budget. Here are the numbers.
Key Takeaways
- US residential solar is forecast to contract about 21% in 2026 after the Section 25D sunset.
- Residential customer acquisition cost is set to spike about 40% in 2026 before a gradual decline, after falling 10% in 2025.
- Acquisition cost has reached roughly $0.85 per watt - close to $10,000 per residential sale on larger systems.
- Referral leads close at 29% to 33% for top installers against 2% to 5% for paid leads.
- Solar's sales-qualified-lead to closed-won rate is 13%, below HVAC (29%) and commercial construction (16%).
- 88% of homeowners read reviews before hiring a solar company.
- Installers with 100+ Google reviews close 22% to 28% better than those with fewer than 30; 4.7 stars is the practical threshold.
- Year-one brand budgets run $25,000 to $80,000; established installers spend $100,000 to $300,000 a year on maintenance and refresh.
- Referral payouts of $500 to $1,500 residential and up to $5,000 commercial are now standard.
- Installers publishing pricing convert 15% to 25% higher than those gating price behind a sales call.
- US solar installed 43.2 GW in 2025, down 14% year over year, still 54% of all new US generating capacity.
- Median marketplace pricing was $2.49 per watt in H2 2025 at an average system size of 11.8 kW.
- Payback periods jumped from 7.4 years in Q3 2025 to 10.4 years in Q4 as capacity filled and the credit lapsed.
- Door-to-door still drives 30% to 40% of US residential sales, with 60% to 80% annual rep turnover and a fully loaded $1,200 to $2,000 cost per deal.
- Pre-warming territory with brand advertising before canvassing cuts acquisition cost 20% to 30%.
- Brand-consistency research reports a 23% revenue association (2016), later stated as up to 33% (2019) - marketer self-report, not audited data.
The 2026 market context every brand decision sits inside
Branding arguments in solar used to be aesthetic. They are now financial, because the demand curve moved. The SEIA and Wood Mackenzie year-in-review data and the Q2 2026 Solar Market Insight report describe a market that is enormous, still growing in capacity terms, and much harder to sell into on the residential side.
| Indicator | 2025 actual | 2026 outlook | What it does to brand strategy |
|---|---|---|---|
| US solar installed | 43.2 GW, down 14% YoY | Flat near 43 GW annually to 2031 | Category is stable; share is the fight |
| Share of new US generating capacity | 54% solar, 79% with storage | Solar alone 60% in Q1 2026 | No need to sell the category, only your company |
| Residential segment | Record demand from the credit rush | Contracting about 21% | Fewer buyers, so recognition decides the shortlist |
| Commercial segment | Grew 6% YoY | Legacy net-metering pipeline thinning | B2B credibility assets gain value |
| Community solar | Declined 25% | Subscriber acquisition cost $69/kW, falling | Cheapest segment to acquire in |
| Residential CAC | Fell 10% in 2025 | Spiking about 40% | Owned brand demand is the only hedge |
The credit rush also distorted the trailing data most installers benchmark against. Homeowner engagement on one major marketplace rose 205% during the scramble, most installers filled annual capacity by October 2025, and payback jumped from 7.4 to 10.4 years between Q3 and Q4, according to EnergySage marketplace analysis. A 2026 plan built on 2025 conversion rates will be wrong in the wrong direction.
Close rate by lead source: the whole argument for brand
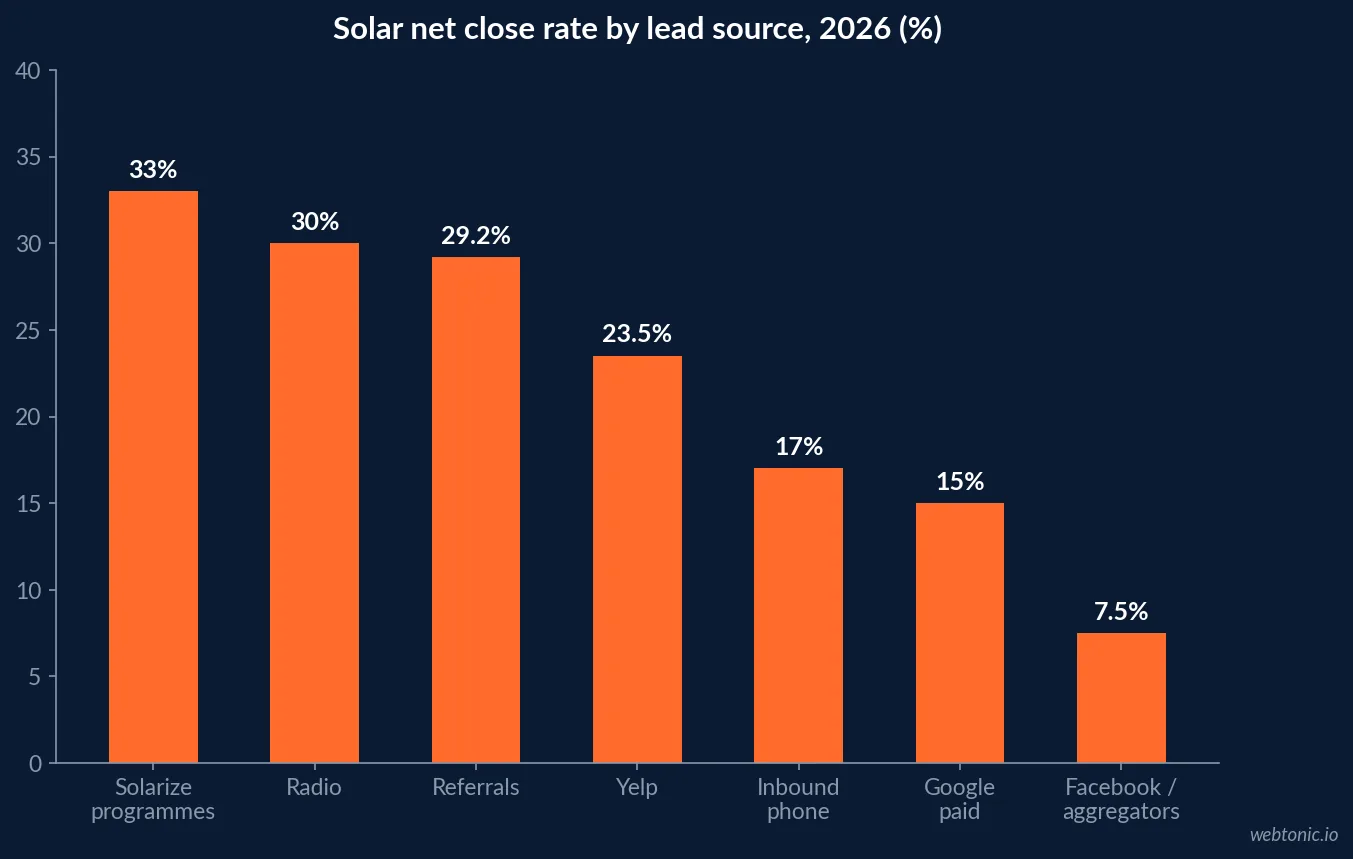
Solar's aggregate close rate is unflattering. Win-rate benchmark analysis citing First Page Sage places solar's sales-qualified-lead to closed-won rate at 13% - the same tier as B2B SaaS (12%) and manufacturing (13%), and less than half of HVAC's 29%. The aggregate hides everything interesting, though, because channel mix explains most of the variance.
| Lead source | Book rate | Close rate on appointment | Net close rate | Brand dependency |
|---|---|---|---|---|
| Referrals | 80% | 37.5% | About 29% | Entirely brand and delivery |
| Solarize / community programmes | n/a | n/a | About 33% | Reputation-gated entry |
| Radio | 90% | 35% | About 30% | Name recognition led |
| Yelp | n/a | n/a | About 23.5% | Review-profile led |
| Inbound phone | 71% | 25% | About 17% | Recognition plus answering fast |
| Google paid | n/a | n/a | About 15% | Partly brand, mostly intent |
| Facebook / aggregators | n/a | n/a | 5-10% | Little brand benefit; shared leads |
Read the net close column as a pricing table for brand investment. Moving 20% of lead volume from aggregator sources at 5% to 10% into referral and inbound sources at 17% to 29% roughly doubles closed deals on the same lead count - no media increase required. That is the mechanism, and it is why the same installers who win on brand also survive incentive cycles. The paid-side context is covered in our Google Ads cost guide.
Trust signals, ranked by what they cost to build
Solar is a $25,000-plus purchase that stays on a roof for 25 years, so proof beats persuasion. Installer brand research reports that 88% of homeowners read reviews first, and that individual trust signals lift close rate by 8 to 15 percentage points each when credibly presented.
| Trust signal | Cost to build | Time to build | Effect on close rate |
|---|---|---|---|
| 100+ Google reviews at 4.7 stars | Process time only | 6-12 months | 22-28% better close vs under 30 reviews |
| Marketplace and third-party scores | Listing effort | 1-3 months | Qualifies you for shortlists |
| NABCEP certification | Low four figures | Months | Single-digit lift, high credibility |
| Real installation photography | About $7,000 per shoot | Days | Measurable within 60 days |
| Published pricing or ranges | Free, politically hard | Immediate | 15-25% higher conversion |
| Total installs and years in business | Free if tracked | Immediate | Reduces perceived risk |
| Warranty terms stated plainly | Free | Immediate | Removes the biggest objection |
| Yard signs and wrapped vehicles | $50/month per sign | Weeks | 1-3 referral inquiries per sign |
The cheapest row on that table is usually the last one implemented. Photography replaces every stock image on a website for about the cost of one lost deal, and most installers refresh it every 18 to 24 months as crews and trucks change. Brand-consistency claims are softer evidence: the widely quoted brand consistency statistics report a 23% revenue association from 2016, later restated as up to 33% - marketer self-report rather than audited performance, and worth citing carefully.
Referral economics after the credit sunset
With acquisition costs rising, the referral programme stops being a nice-to-have. Payouts of $500 to $1,500 per residential close and up to $5,000 per commercial close are standard, against a customer acquisition cost that has reached roughly $0.85 per watt.
| Programme element | Typical structure | Economics |
|---|---|---|
| Referrer payout | $500-$1,500 per close | 2-4% acquisition cost on a $28,000 deal |
| New-customer incentive | $500 install credit | Double-sided offers are used in most programmes |
| Tiered escalation | $500 / $750 / $1,000 by referral count | Rewards the small number of repeat advocates |
| Neighbourhood campaign | Bonus if neighbours sign within 60 days | 2-4 extra deals per install in dense areas |
| Yard sign retainer | $50 per month to keep the sign up | $9,000 for 60 signs over 3 months |
| Payout speed | Within 30 days of close | The single biggest driver of repeat referrals |
| Referral share of leads | 10% year one to 33%+ by year five | The compounding version of brand equity |
The comparison that matters: a $1,000 referral fee on a lead that closes at 29% to 33% versus a $30 to $60 shared aggregator lead that closes at 3% to 8%. The aggregator lead looks cheaper per lead and is dramatically more expensive per signed contract. Creative and identity work that makes a company referable is handled by our performance creative team.
What to spend, by company stage
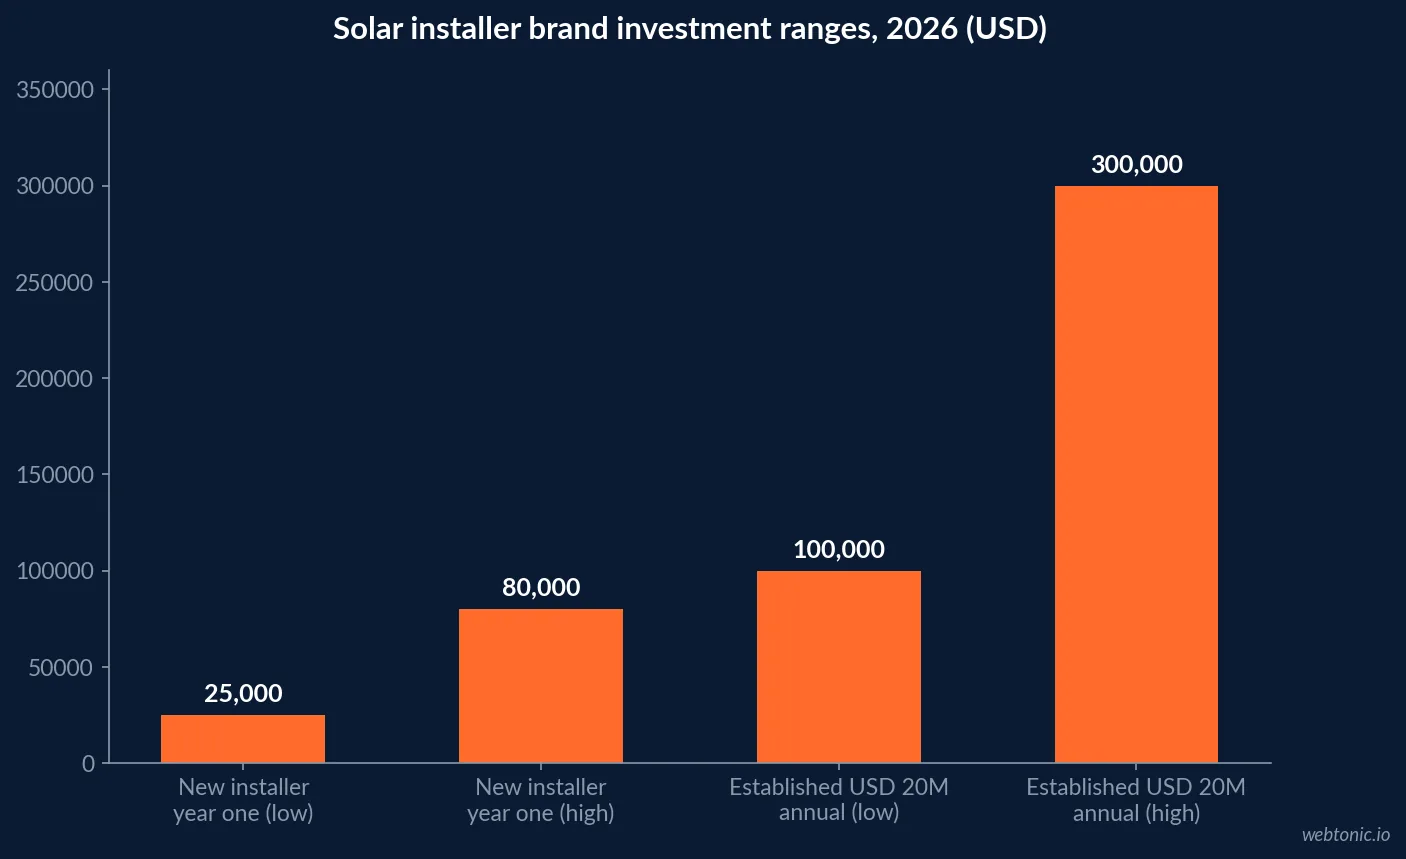
Budget guidance in solar is unusually consistent across sources: solar marketing benchmarks put total marketing spend at 8% to 12% of target revenue for companies in growth mode, and the strongest brands sustain 5% to 10% of revenue on brand and marketing for a decade rather than in bursts.
| Company stage | Brand budget | Where it goes | Expected outcome |
|---|---|---|---|
| Launch (year one) | $25,000-$80,000 | Naming, identity, website, photography | A position a homeowner can repeat |
| $3M revenue, growth mode | $240,000-$360,000 total marketing | Paid, SEO, reviews, referrals | 60-100 leads/month at $50-$85 |
| $14M regional installer | About 4.8% of revenue | Referrals, signs, reviews, local presence | 41% of installs from past customers |
| $20M established | $100,000-$300,000 per year | Refresh, new photography, review systems | Lower blended CAC each year |
| Commercial / C&I | 5-12% of revenue | Credibility content, case studies, events | Shorter procurement cycles |
The $14M example is the instructive one: an installer spending less than half the regional average on marketing while sourcing 41% of projects from past customers and partners, built on roughly 1,400 finished installs concentrated in five ZIP codes. Density plus consistency beat reach, which is the practical definition of brand equity in a trades business.
Door-to-door is a brand channel now, not a sales channel
Canvassing still drives 30% to 40% of US residential solar sales, but the economics have deteriorated: full-time canvassers cost $60,000 to $90,000 a year loaded, turnover runs 60% to 80% annually, and fully loaded cost per D2D-sourced deal often reaches $1,200 to $2,000. The fix reported by operators is sequencing rather than abandonment.
| Approach | Rejection behaviour | Cost per deal | Notes |
|---|---|---|---|
| Cold canvassing, unknown brand | Baseline rejection | $1,200-$2,000 | Highest turnover, hardest recruiting |
| Territory pre-warmed with brand ads | Rejection down 25-35% after 5-7 impressions | 20-30% lower blended CAC | Recognition does the first knock |
| Canvass plus digital retargeting follow-up | Longer nurture window | Lower still | Solar decisions run 60-90 days |
| Post-install neighbourhood campaign | Warmest possible audience | Referral-tier economics | 2-4 extra deals per install in dense areas |
That first row is what happens when a company has no brand: it pays a canvasser to build recognition one doorstep at a time, at the highest possible unit cost. Paid social is the usual pre-warming layer, and the economics of it are covered in our Facebook Ads cost breakdown.
Brand best practices for solar installers in 2026
- Write a position you can state in 15 words - audience, geography, reason - and reject "quality and service".
- Target one review per completed install and respond to every review within 48 hours.
- Publish pricing ranges; gated pricing costs 15% to 25% of conversion.
- Replace every stock photo with real crews and real roofs; budget about $7,000 a shoot.
- Pay referral fees within 30 days, every time, and publish the payout amount.
- Run yard signs as a paid programme, not a favour - 1 to 3 inquiries per sign.
- Concentrate installs geographically; density compounds recognition faster than reach.
- Build a 12 to 18 month nurture for unclosed quotes - nurtured leads close at 8% to 15% versus 1% to 3% cold.
- Track referral share of total leads as a board-level metric, targeting 30%-plus by year three.
- Lead with electricity-bill outcomes, not panel specifications; homeowner-outcome creative outperforms product creative by 3x to 5x on click-through.
- Treat storage, batteries and electrification as brand extensions - 51% of installers already service systems they did not install.
A 90-day brand build for a post-25D market
Nothing on this list requires a rebrand. It requires the assets a homeowner checks before shortlisting three installers.
| Window | Work | Metric it moves |
|---|---|---|
| Days 1-15 | Write and test the position; audit every trust signal you can prove | Shortlist rate |
| Days 16-30 | Review engine: request at activation, follow up at day 3 and day 7 | Reviews per install |
| Days 31-45 | Photography shoot; replace stock imagery site-wide | Time on page, proposal close |
| Days 46-60 | Publish pricing ranges, warranty terms, install counts | Conversion rate |
| Days 61-75 | Launch or relaunch the referral programme with published payouts | Referral share of leads |
| Days 76-90 | Yard signs, wrapped vehicles, neighbourhood campaigns in top ZIP codes | Blended CAC |
If you want that built and measured rather than assigned to someone in the sales team, our growth marketing team runs the channel side, our data intelligence team tracks the CAC and close-rate movement, and you can get in touch for a solar-specific plan.
Frequently Asked Questions
Why does branding matter more for solar installers in 2026?
Because the subsidy that hid weak positioning is gone. The 30% Section 25D residential tax credit expired on 31 December 2025, Wood Mackenzie expects the US residential solar market to contract about 21% in 2026, and residential customer acquisition cost is forecast to spike roughly 40% in the same year. When there are fewer buyers and more competitors chasing them, the installers whose name a homeowner already recognises pay less for every appointment.
What close rate should a solar installer expect by lead source?
Wide variance. First Page Sage's benchmark study across 2019 to 2025 puts solar's sales-qualified-lead to closed-won rate at 13%, below HVAC at 29% and commercial construction at 16%. Channel-level data from a mid-size installer shows referrals at roughly 29% net close, radio near 30%, Yelp 23.5%, inbound phone 17%, Google paid 15%, and Facebook or aggregator leads in the 5% to 10% range. Brand work is what shifts volume toward the top of that list.
How much should a solar company spend on branding?
Installer survey data points to $25,000 to $80,000 in year one covering naming, visual identity, website and photography, and $100,000 to $300,000 annually for an established company around $20 million in revenue to fund refresh, new photography and review systems. Commercial solar companies in growth mode typically run 5% to 12% of revenue on marketing overall, with 10% to 20% of acquisition spend earmarked for brand and content.
Which trust signals actually move solar close rates?
Reviews first: 88% of homeowners read reviews before hiring a solar company, and installers with 100-plus Google reviews close 22% to 28% better than those with fewer than 30, with 4.7 stars as the practical sweet spot. Then third-party marketplace scores, NABCEP certification, years in business, total installations completed, and published warranty terms - each contributing single-digit percentage-point lifts that compound. Published pricing converts 15% to 25% better than price gated behind a sales call.
Are referral programmes worth the payout in solar?
Almost always. Standard payouts run $500 to $1,500 per residential close and up to $5,000 on commercial deals, against a customer acquisition cost that has reached roughly $0.85 per watt - close to $10,000 on a large residential sale. On a $28,000 average deal, a $1,000 referral fee is a 2% to 4% acquisition cost, and referred customers typically request only one quote and accept higher pricing. Top installers move from about 10% of leads from referrals in year one to 33% or more by year five.
Sources
SurgePV - Building a Solar Brand That Outlasts Incentive Cycles
SurgePV - Solar Win Rate Benchmarks for Installers 2026
Wood Mackenzie - Residential Solar CAC to Spike 40% in 2026
Wood Mackenzie - Why 2026 Is Looking Flat
SEIA - Solar Market Insight Report Q2 2026
pv magazine USA - US Solar Adds 43 GW in 2025
pv magazine USA - Expiring Incentives Led to Record 2025 Demand
Daly Advertising - Solar Marketing Benchmarks 2026
Lifestory Research - America's Most Trusted Solar Panel Brands 2026
Dasho Content - Brand Consistency Statistics
WifiTalents - Customer Experience in the Solar Industry