Table of contents
87% of "solar installers near me" searches trigger the Google map pack, and the three listings inside it take about 42-44% of the clicks. For solar installers, local SEO is no longer a website exercise - it is a fight for three pins and a review count.
Key Takeaways
- 87% of "solar installers near me" queries surface a map pack; the top three positions capture roughly 42% of clicks.
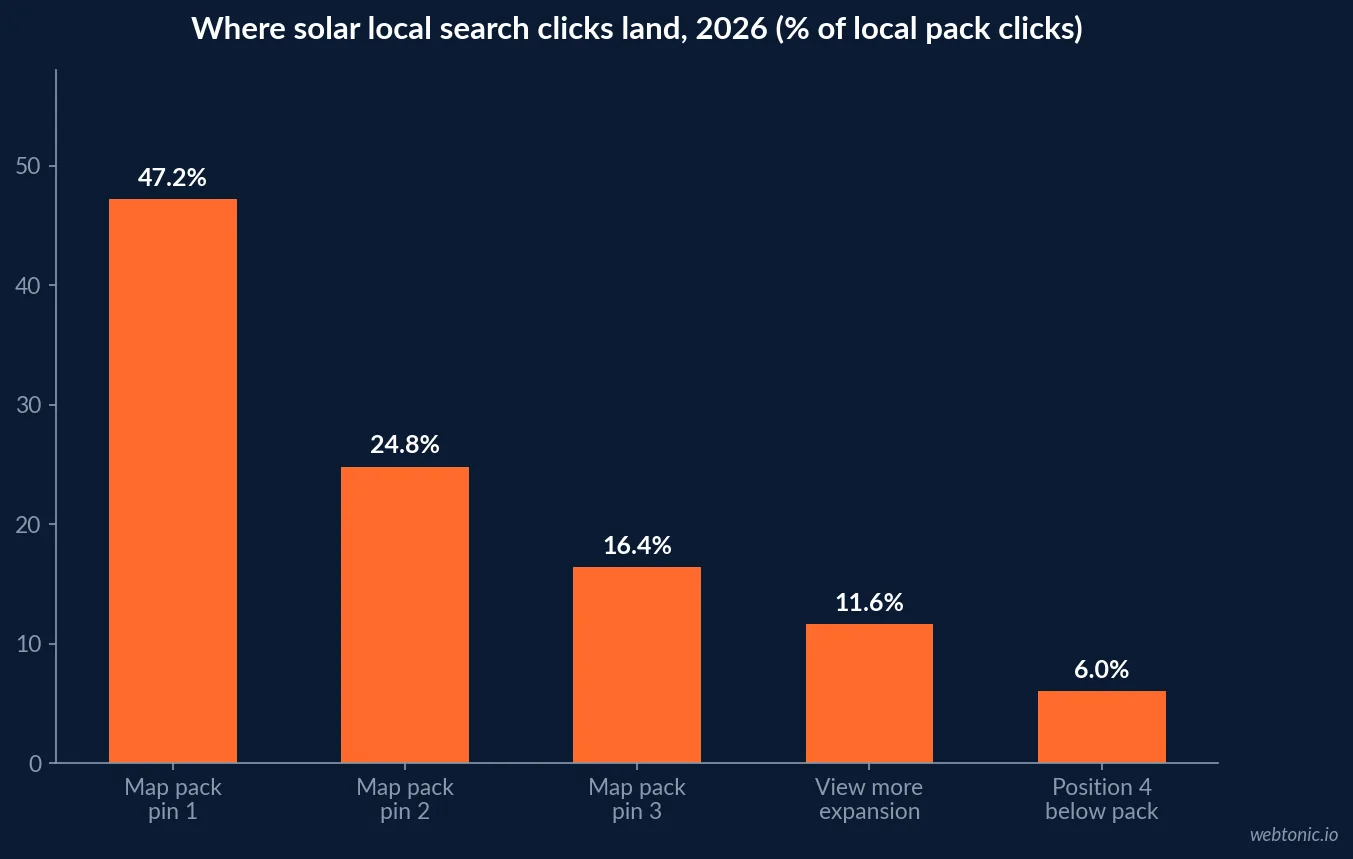
- Inside the pack, pin 1 takes 47.2% of clicks, pin 2 24.8%, pin 3 16.4%, and position 4 about 6%.
- Local search drives 60-70% of inbound solar leads for installers running an active program.
- Profiles with 50+ reviews win 4.4x more clicks than profiles with fewer than five, measured across 100,000 Google Business Profiles.
- The median local service business holds 165 reviews at 4.82 stars, and 76.6% already sit at 4.8+.
- 78% of mobile local searches end with zero clicks, and AI Overviews appear on 68% of local-intent queries.
- Calls from a Google Business Profile book at 40-60% versus 2-8% for website visitors from local search.
- GBP signals carry ~32% of local pack ranking weight; reviews carry 16-20%, with recency the heaviest single factor.
- Only 26% of businesses actively manage their profile, and active managers earn 2-4x better pack positions.
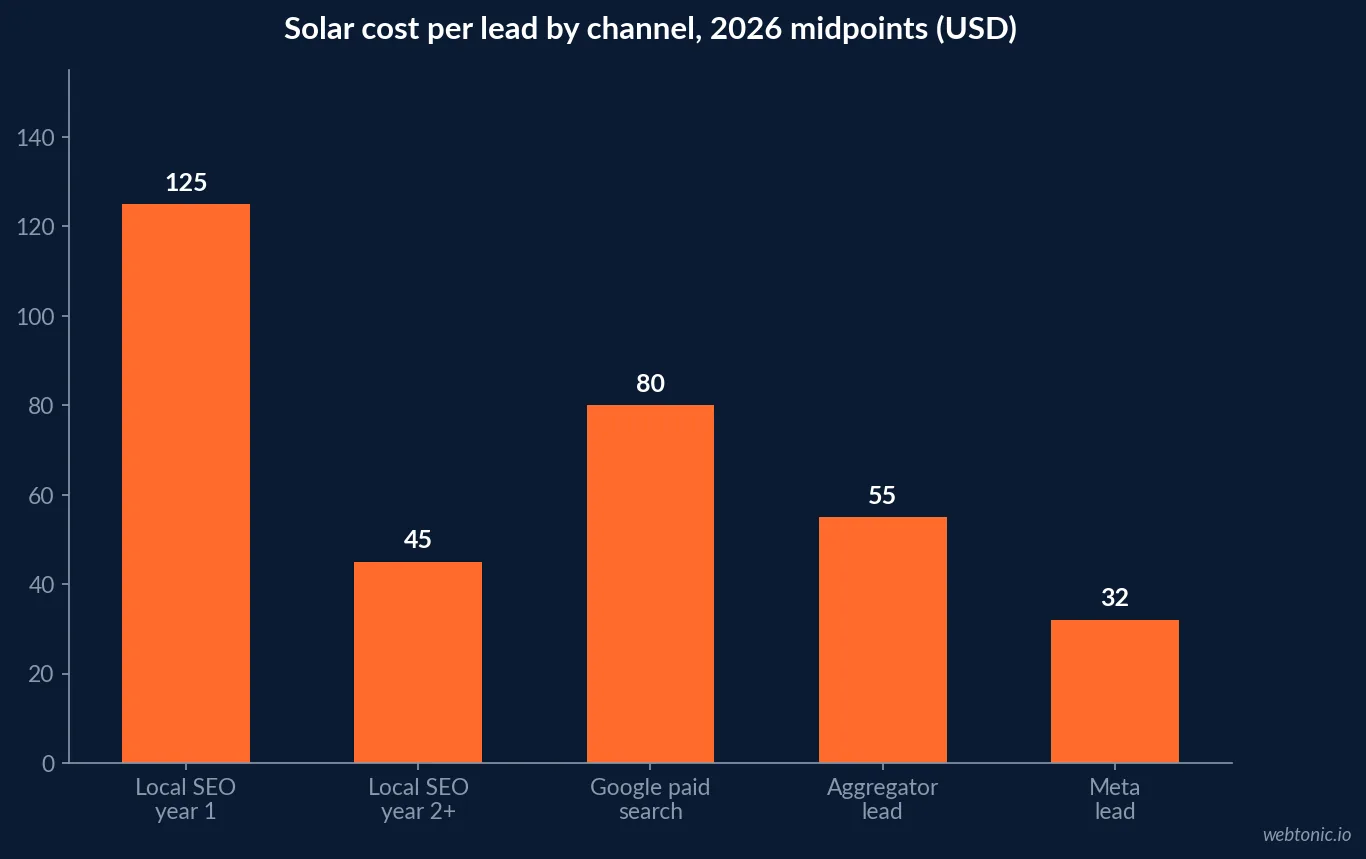
- Solar SEO cost per lead runs $90-$160 in year one and $30-$60 in year two, against organic close rates of 22-30%.
Solar local SEO benchmarks at a glance
These are the numbers worth pinning to a wall before any solar local SEO program starts. Sources are linked at each claim and collected at the end.
| Metric | 2026 benchmark | Why it matters |
|---|---|---|
| Map pack trigger rate | 87% of "solar installers near me" queries | Almost every commercial solar query is a local pack query |
| Top-3 pack click share | 42-44% of clicks | Ranking fourth is close to invisible |
| Share of inbound leads from local search | 60-70% | Local SEO is the primary channel, not a supplement |
| Median reviews (local service businesses) | 165 at 4.82 stars | Rating is table stakes; volume and recency separate |
| Review velocity target | 5-15 new reviews per month | Recency is the heaviest single review signal |
| Time to top-3 pack position | 9-12 months at $1,500-$2,500/month | Budget the runway or the program stalls |
| SEO cost per lead, year 1 / year 2 | $90-$160 / $30-$60 | Compounding beats paid CPL after year one |
| Organic vs paid close rate | 22-30% vs 12-18% | Local intent leads arrive further down the funnel |
The map pack is where solar buyers decide
Local intent dominates solar discovery. Roughly 46% of all Google searches carry local intent and "near me" searches have grown more than 400% since 2020, according to aggregated local search data. For solar specifically, 87% of "solar installers near me" queries return a map pack and the top three listings take about 42% of clicks, per agency analysis of solar search results.
The distribution inside the pack is what makes this unforgiving. A 2026 crawl-based study found pin 1 captures 47.2% of local pack clicks, pin 2 gets 24.8% and pin 3 gets 16.4%, with the "view more" expansion taking the remaining 11.6% (Visionary Marketing, 2026). When a pack is present, organic position one CTR drops from a 27.6% baseline to 19.8% - a 28.3% reduction - so a strong organic page cannot compensate for a weak profile.
Review thresholds: what it now takes to hold a pin
Reviews are the most measurable local ranking asset and the most misunderstood. A June 2026 sample of 7,481 local service businesses across 25 cities found an average rating of 4.82 stars and a median of 165 reviews, with 23% holding 500 or more and only 3.6% below ten (Smarfle research). Because 76.6% of sampled businesses already sit at 4.8 stars or higher, rating alone will not move a listing up.
Volume does move it. Across a crawl of 100,000 Google Business Profiles, profiles with 50+ reviews earned 4.4x more clicks than profiles with fewer than five, and profiles that crossed 100 reviews saw lead volume rise 31% year over year against a dataset-wide local lead growth of 12.4%. Separately, businesses with 50+ Google reviews are reported as 266% more likely to appear in the local pack than those with fewer.
Trade benchmark data is a useful reality check on how high the bar climbs in adjacent home service categories where solar installers compete for the same homeowner attention.
| Trade / category | Median reviews of pack holders | Typical winning rating | Recent review pace |
|---|---|---|---|
| Solar (practitioner target) | 50-100+ | 4.8+ | 5-15 / month |
| Roofing | 192 | 4.8 | ~2 in last 90 days |
| Plumbing | 551 (median business) | 4.79 | 3-4 in last 90 days |
| HVAC | 503 (median business) | 4.84 | 4 in last 90 days |
| Electrical | 150 | 4.9 | 3 in last 90 days |
| All local service businesses | 165 | 4.82 average | Varies |
Two findings cut against the "collect more reviews forever" instinct. First, 50 reviews from the last six months outperform 200 reviews from three years ago on recency signals, per contractor local pack analysis of 50.4 million Google Maps results. Second, review-count requirements are market-scaled: the same benchmark work shows an entry threshold near 21-25 reviews in easier categories and medians in the hundreds in major metros (2026 contractor local SEO benchmark report).
Position-level review data from home service map packs
Position-by-position sampling makes the compounding requirement concrete. A Q2 2026 study of home service map packs recorded review counts at each pack position and found the interquartile ranges below - alongside the uncomfortable detail that businesses outside the top ten still carry hundreds of reviews, meaning count alone never explains a ranking (RepuClinic, 2026).
| Map pack position | Plumber review count (P25-P75) | Median rating | Reviews in last 90 days |
|---|---|---|---|
| Position 1 | 464-2,241 | 4.8 | 4 |
| Position 2 | 371-4,971 | 4.8 | 3 |
| Position 3 | 355-2,938 | 4.8 | 3 |
| Outside top 10 | 199-996 | 4.8 | n/a |
The practical read for a solar installer entering a mid-size metro: match or beat the current three-pack leader's review count, then hold a steady 2-4 new reviews per month minimum, because a profile with 45 recent reviews frequently outranks one with 120 stale ones. Rating floors are rising too - the 4.0 floor is now actively suppressive and the competitive bar is moving to 4.5 across categories, while the recency window practitioners watch is compressing from 90 days toward 30 (local SEO projection report).
Zero-click local search changes what "ranking" pays
78% of mobile local searches now end without a click to any website, and local-intent queries triggering AI Overviews jumped from 8% to 68% during 2025-2026. That does not remove the value of the pin; it relocates the conversion. Analysis of "near me" interaction data finds roughly 35-40% of map pack impressions produce a website click, 25-30% a direction request and 15-20% a phone call straight from the listing, with high-urgency trades seeing calls exceed 40% of interactions (Koira near-me click study).
The conversion quality gap is the headline: calls initiated from a Google Business Profile convert to booked appointments at 40-60%, versus 2-8% for website visitors from local search. For solar, where the sales cycle runs 90-180 days and homeowners comparison-shop 3-5 installers, a booked in-home assessment from a pack call is worth several form fills. Multi-location listing data also shows where attention is going: local listing visibility fell 13.2% across search in 2025, phone clicks fell 12.9% and website clicks 7.7%, while direction clicks rose 6.4% - the only major action to grow (2026 local search report).
Ranking weight: where solar effort actually lands
Practitioner surveys consistently split local pack weight the same way, and it is not where most installers spend. Google Business Profile signals carry roughly 32% of local pack ranking weight, reviews 16-20% with recency the heaviest single factor inside that category, and website or location-page signals about 15%. Citations have declined from roughly 13% of weight in 2020 to 7% in 2026.
| Signal group | Approximate 2026 weight | Solar-specific execution note |
|---|---|---|
| Google Business Profile completeness | ~32% | Primary category "Solar Energy Contractor", 50+ photos, services, Q&A |
| Reviews (volume, velocity, recency) | 16-20% | 5-15/month indefinitely; recency window compressing to 30 days |
| On-site and location page signals | ~15% | One page per served city with real install photos and system sizes |
| Links and authority | Remaining share | Utility, municipal and rebate-program citations beat generic directories |
| Citations / NAP consistency | 7% (down from 13%) | 50+ directories, but treat it as hygiene not strategy |
The execution gap is the opportunity. Only 26% of businesses actively manage their Google Business Profile, and active managers earn 2-4x better local pack positions. Only 44% of profiles are fully optimised, only 15% of local businesses have complete LocalBusiness schema, and 38% of small businesses have no review collection strategy at all. Profiles with 20+ photos receive 35% more direction requests. For the technical half of this work, our solar technical SEO statistics covers the crawl, schema and Core Web Vitals baseline.
Solar keyword demand and the 2026 volume reset
Local keyword economics for solar are unusual: modest volumes at high commercial cost. Industry keyword data puts "solar companies" at 3.3K monthly searches with a $5.55 CPC, while the explicitly local variants command far higher paid prices (Home Service Base industry data).
| Keyword | Monthly US volume | Paid CPC | Local SEO read |
|---|---|---|---|
| solar companies | 3,300 | $5.55 | Research intent; win with content plus pack |
| solar installers near me | 2,200 | $10.01 | Pure pack query - profile decides |
| solar companies near me | 2,200 | $11.25 | Pack query; reviews are the tiebreak |
| solar providers near me | 1,600 | $10.84 | Long-tail pack query, low competition |
| solar installation companies near me | 1,400 | $9.68 | Service-page and location-page target |
Context matters more than volume this year. The 30% federal residential credit expired on 31 December 2025, residential volume is tracking down about 21% in 2026 and customer acquisition cost is up roughly 40% - which makes a channel with a $30-$60 mature cost per lead structurally more valuable than one at $40-$120. Note also that new solar websites launched fell 80.8% in 2025 versus 2024 while the total site count still grew 10.37%: fewer new entrants, more entrenched incumbents. Compare the paid side in our solar Google Ads statistics.
Lead economics: why installers keep funding local SEO
The case is not that local SEO is free; it is that it compounds while paid does not. Solar leads from organic search close at 22-30% versus 12-18% for paid search, per solar SEO research. First-year SEO cost per lead runs $90-$160 as the program ramps and drops to $30-$60 in year two. Installers running consistent programs for three or more years commonly produce 40-60% of total lead volume from organic at less than half the cost per lead of Google Ads, and a fully optimised profile can generate 30-80 calls per month.
Documented case data shows the spread. One installer pair with near-identical operations - twelve years trading, 35 employees, $7M revenue - diverged to $14M versus $7.2M in a single year, with 78% of the growing installer's new leads arriving from local organic search while the other paid $1,800 per acquired customer on ads (SurgePV case data). Attribution discipline is what keeps that comparison honest - see our solar marketing attribution statistics.
| Channel | Cost per lead | Close rate | Notes |
|---|---|---|---|
| Local SEO, year 1 | $90-$160 | 22-30% | Ramp period; front-loaded work |
| Local SEO, year 2+ | $30-$60 | 22-30% | Compounds; profile and pages already rank |
| Google paid search | $40-$120 | 12-18% | Instant, resets to zero when paused |
| Meta / Facebook | $15-$50 | Lower | Volume channel, weaker intent |
| Lead aggregators | $30-$80 | 5-10% | Shared leads, price-led conversations |
| Referrals | Near zero media cost | 29.2% | Best close rate, hardest to scale |
What a solar local SEO program should actually do
Ordered by measured ranking weight rather than by what is easiest to sell:
- Complete the profile fully. Most installers fill only 30-50% of available fields. Primary category, service list, service areas, attributes, Q&A, 50+ photos, weekly posts.
- Instrument the review engine. Ask at commissioning, not at invoice. Target 5-15 reviews per month indefinitely; response rate at that moment is typically 25-40%.
- Publish one real page per served city with local install photos, system sizes and utility or rebate specifics. Avoid duplicating 70%+ of content across cities.
- Answer calls. With 40-60% of GBP calls booking, a missed call is a lost assessment - and 76-78% of local mobile searchers act within 24 hours.
- Deploy LocalBusiness schema - only 15% of local businesses have complete markup.
- Track calls and direction requests as conversions, not sessions, given 78% zero-click behaviour.
- Treat citations as hygiene: consistent NAP across 50+ directories, then stop - the signal is down to 7% of weight.
If the broader search program needs sequencing, our solar SEO statistics and the growth marketing service page cover how the local layer fits against content and paid.
What this data does not say
Three cautions before anyone builds a forecast on these figures. First, review-count benchmarks are category-scaled: plumbing and HVAC medians in the hundreds or thousands reflect decades of transaction volume that a solar installer selling one system per household per 25 years will never match - solar packs clear at far lower counts. Second, several widely cited figures (the 42% and 44% pack click shares, the 76% and 78% same-day visit rates) come from different studies with different methodologies and should be read as a range, not a constant. Third, zero-click and AI Overview growth is fast-moving - AI Overviews on local-intent queries moved from 8% to 68% inside two years, and any plan that assumes today's click rates hold through 2028 is assuming away the main trend in local search.
Frequently Asked Questions
How many Google reviews does a solar installer need to rank in the map pack?
There is no fixed number, only a moving local threshold. Across 7,481 sampled local service businesses the median business holds 165 reviews at a 4.82-star average, and 76.6% already sit at 4.8 stars or higher, so rating is table stakes rather than an edge. Practitioner targets for solar sit at 50 or more reviews inside the first year of active profile management and 100 or more at 4.8+ within twelve months in competitive metros. Velocity matters as much as the total: 50 reviews earned in the last six months outperforms 200 reviews that are three years old.
What share of solar clicks does the Google map pack actually take?
Roughly 87% of 'solar installers near me' queries surface a map pack, and the three listings inside it capture about 42-44% of clicks on local-intent queries. Inside the pack the distribution is brutally top-heavy: pin one takes about 47% of pack clicks, pin two about 25%, and pin three about 16%. Position four, the first result below the fold of the pack, collects roughly 6%.
How long does local SEO take to work for a solar company?
Plan on 6-12 months for top-three map pack positions in a primary service area, with the most commonly reported window being 9-12 months at a $1,500-$2,500 per month investment. Profile-level work moves fastest - a verified, fully completed Google Business Profile can start producing impressions within weeks - while review counts and location-page authority follow a slower compounding curve. First-year cost per lead from SEO typically runs $90-$160, dropping to $30-$60 in year two.
Does local SEO still pay off if most local searches are zero-click?
Yes, but the measurement has to change. About 78% of mobile local searches now end without a click to any website, and AI Overviews appear on roughly 68% of local-intent queries, so ranking is increasingly about being chosen inside the results page. Calls initiated from a Google Business Profile convert to booked appointments at roughly 40-60%, versus 2-8% for website visitors from local search - so the conversions are still there, they simply arrive as calls and direction requests rather than sessions.
What matters most for solar map pack rankings in 2026?
Practitioner surveys put Google Business Profile signals at roughly 32% of local pack weight and reviews at 16-20%, with review recency now the highest-weighted single factor inside the review category. Website and location-page signals contribute roughly 15%. The cheap win is completeness: only about 26% of businesses actively manage their profile, and active managers see 2-4x better local pack positions, while only 15% of local businesses have complete LocalBusiness schema deployed.
Sources
SurgePV - local SEO for solar installers 2026
SurgePV - solar SEO close rates and local funnel data
ClicksGeek - solar installer map pack and review targets
Visionary Marketing - local SEO statistics 2026, 100,000 GBP crawl
ES Studios - home service contractor local SEO benchmark report 2026
ES Studios - review counts and local pack rankings, 50.4M Maps results
RepuClinic - Google review benchmarks by map pack position, Q2 2026
Smarfle - Google review benchmarks by industry, 7,481 businesses
SearchLab - local SEO statistics 2026
Emulent - state of local SEO projections 2026-2028
Rio SEO - 2026 local search report
Koira - near me search click versus map pack preview data
Home Service Base - solar energy industry keyword and website data