Table of contents

Senior housing occupancy hit 89.9% in the second quarter of 2026, the highest level since before the 2008 financial crisis, yet Argentum's own 2025 survey of senior living executives found most operators still can't trace a specific inquiry to a specific move-in without manual reconciliation. This page uses NIC MAP's occupancy data, Argentum's technology-adoption survey and A Place for Mom's caregiver research to define what a tracking and analytics stack for senior living should actually measure, and where HIPAA and FTC rules on online tracking technologies change what a marketing team can safely put on a page.
Key Takeaways
- Senior housing occupancy reached 89.9% in Q2 2026, per NIC MAP.
- That is the 20th consecutive quarter of occupancy gains.
- 15 of 31 primary markets already sit above 90% occupancy.
- Year-over-year inventory growth was just 0.4% in Q2 2026.
- 85% of operators rank digital dashboards their top data application.
- Only 37% rank statistical correlation/causation analysis in their top three.
- Just 22% rank predictive analytics among their top three uses of data.
- 58% of operators already collect accessible resident health/wellness data.
- Another 19% collect it only intermittently, and 13% are still building it.
- 70% of AI-using operators apply it to predictive analytics.
- 50% use AI-based chatbots for resident interaction.
- 76% now call AI's effect on the industry significantly transformative, up from 58% in 2023.
- 34% of family caregivers search for senior care with no outside help.
- 47% lean on health professionals, friends or family for advice mid-search.
- 88% of caregivers say families need more guidance navigating the search.
- More than two-thirds of caregivers secure care within 60 days of starting to look.
- National assisted living median cost is $6,200 a month, or $74,000 a year.
- There are 41,465 assisted living communities in the U.S. today, per AHCA/NCAL.
What "near-full" occupancy changes about the marketing question
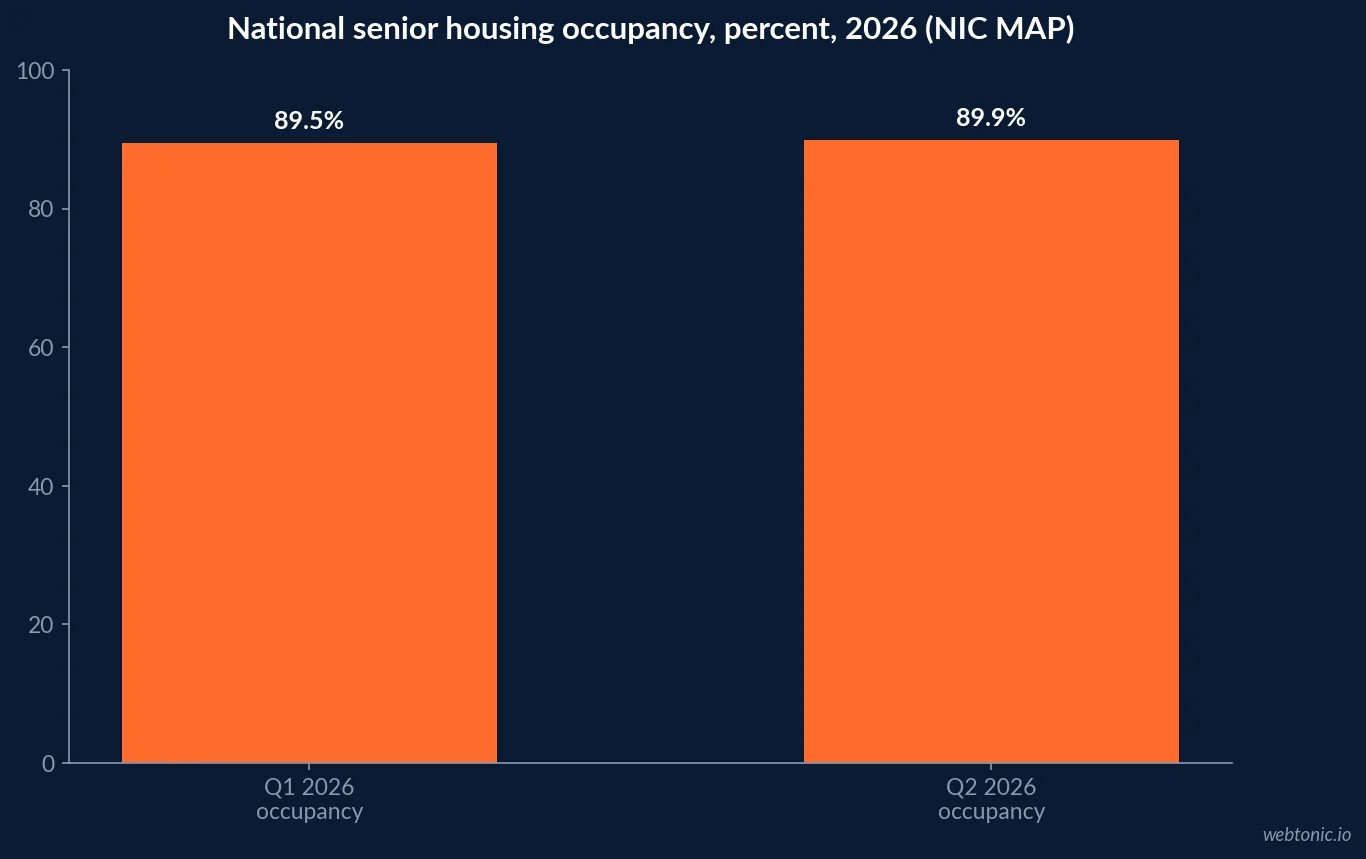
NIC's analysis of NIC MAP data put national senior housing occupancy at 89.9% in the second quarter of 2026, up 0.4 percentage points from 89.5% in Q1, and the 20th straight quarter of gains. Occupancy hit or exceeded 90% in 15 of the 31 primary markets NIC MAP tracks, with Boston (93.3%), San Francisco (92.7%) and Baltimore (91.8%) leading, while inventory grew just 0.4% year over year as construction stalled below 16,000 units nationally.
At that level of scarcity, the job of tracking shifts from "generate more inquiries" to "prove which channel produced the tour that actually converted," because unsold capacity is no longer the constraint most communities are managing against.
| Occupancy metric (Q2 2026) | Figure | Source |
|---|---|---|
| National senior housing occupancy | 89.9% | NIC / NIC MAP |
| Consecutive quarters of gains | 20 | NIC / NIC MAP |
| Primary markets above 90% occupancy | 15 of 31 | NIC / NIC MAP |
| Highest-occupancy market (Boston) | 93.3% | NIC / NIC MAP |
| Lowest-occupancy market (Miami) | 86.2% | NIC / NIC MAP |
| Year-over-year inventory growth | 0.4% | NIC / NIC MAP |
What operators say they actually track
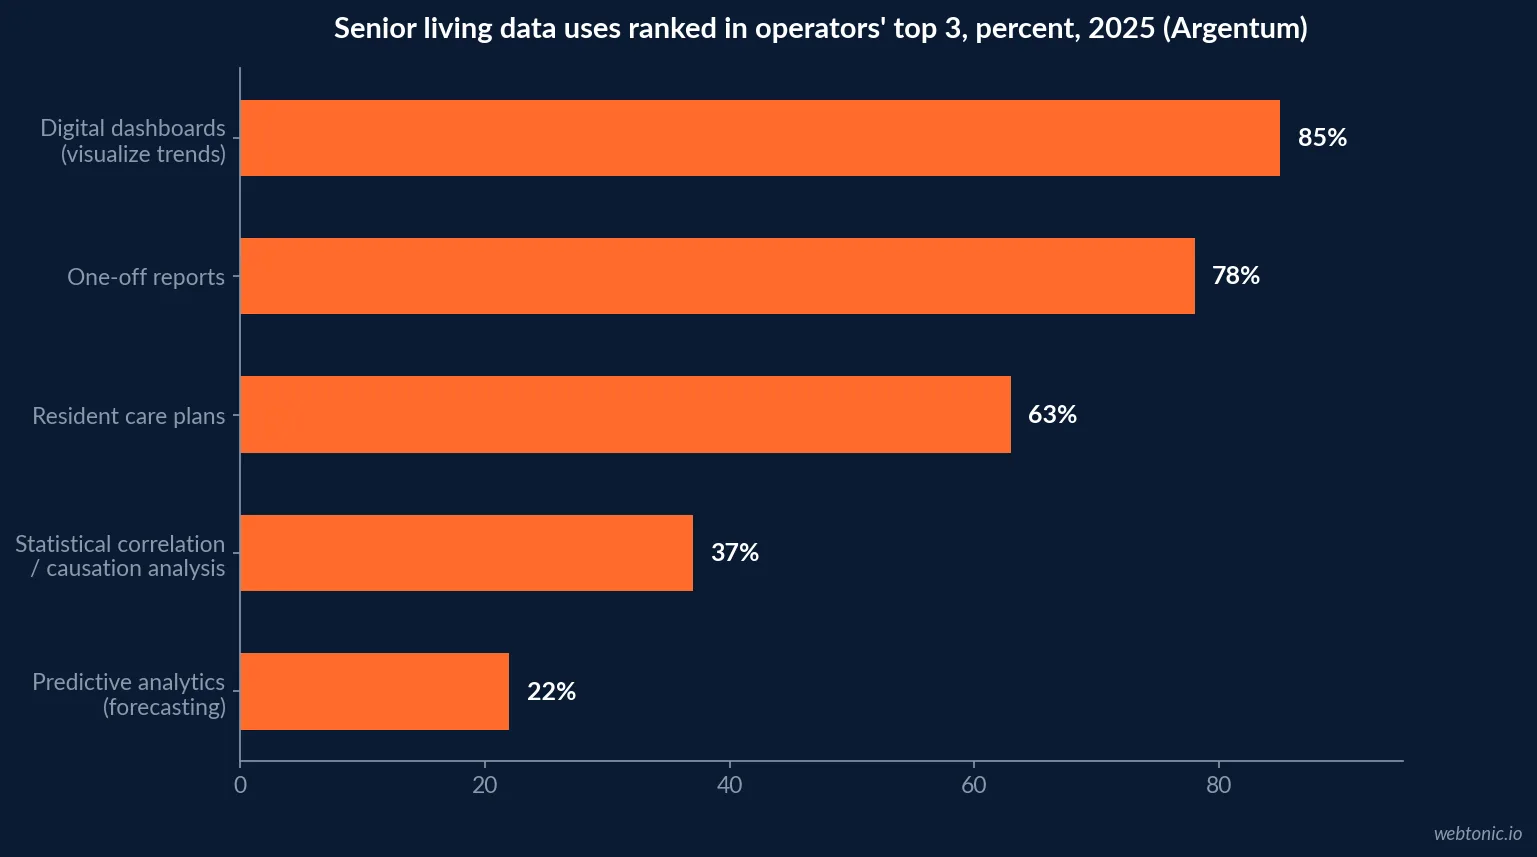
Argentum's 2025 Technology Report, produced with A Place for Mom from a survey of nearly 1,000 senior living leaders, asked operators to rank six data uses from most to least common. Digital dashboards that visualize trends led at 85%, followed by one-off reports at 78% and resident care plans at 63%. Further down the list, statistical analysis identifying correlation and causation was ranked in the top three by only 37%, and predictive analytics by just 22%. A small but real 15% said none of these applied — they lack the capability altogether.
That is a maturity curve, not a gap in ambition: most senior living organizations can watch a trend line, far fewer can explain what caused it, and fewer still can forecast it. A marketing tracking stack built for this industry has to work at the "watch the trend" level first.
| Data use case | Share ranking it top-3 | What it typically requires |
|---|---|---|
| Digital dashboards visualizing trends | 85% | A BI tool wired to CRM and occupancy data |
| Generating one-off reports | 78% | Manual exports, spreadsheets |
| Developing resident care plans | 63% | EHR / care management system |
| Statistical correlation/causation analysis | 37% | A data warehouse and analyst time |
| Predictive analytics for forecasting | 22% | Modeling capability most vendors don't bundle |
| None of the above / no capability | 15% | No integrated data layer at all |
Resident health data is being collected, unevenly
Argentum's survey also asked whether organizations collect resident health and wellness data in an accessible format: 58% said it is already implemented, 19% collect it only intermittently, 13% are still building the capability, and 10% do not collect it at all. That distinction matters for marketing teams specifically because health and wellness data sits closer to Protected Health Information than occupancy or lead-source data, and the two should never live in the same reporting layer without a deliberate access control decision.
Who is actually online: residents, or their adult children
Tracking strategy depends on getting this audience split right. Pew Research Center reports that 75% of U.S. adults age 65 and older are internet users, well below the 96%-plus rate for adults under 50, meaning a meaningful share of prospective residents themselves are simply not reachable through digital channels at all. Meanwhile AARP's 2026 tech-trends research found that of the 63 million family caregivers nationwide, 55% already use at least one form of technology to coordinate care or track a loved one's health, and 71% bought new technology in 2025, up from 67% in 2024.
Read together, that means the analytics stack has two very different users to track: a resident population where a quarter are not online at all, and a caregiver population that is increasingly tech-forward and already comfortable managing care digitally. A channel report that does not separate resident-facing engagement from caregiver-facing engagement will blend two populations with opposite adoption curves into one misleading average.
| Audience | Online/tech adoption figure | Source |
|---|---|---|
| Adults 65+ who use the internet | 75% | Pew Research Center |
| Family caregivers nationwide | 63 million | AARP, 2026 |
| Caregivers using tech to coordinate care | 55% | AARP, 2026 |
| Caregivers who bought new tech in 2025 | 71% | AARP, 2026 |
| Adults 50+ who bought tech in 2024 | 67% | AARP, 2026 |
Where HIPAA and FTC rules actually bite on tracking pixels
The Federal Trade Commission and HHS's Office for Civil Rights sent a joint letter in July 2023 warning that common tracking technologies — the Meta/Facebook pixel and Google Analytics among them — can trigger both HIPAA and FTC Act exposure when they sit on pages or forms that reveal a person is seeking care for a specific health condition, for themselves or a family member. The FTC-OCR letter was sent to roughly 130 hospital systems and telehealth providers, but the underlying tracking-technology guidance applies to any HIPAA covered entity or business associate, which includes senior living operators that also bill Medicare or Medicaid for skilled care.
The practical line: a public marketing page comparing floor plans and amenities is low risk. A care-assessment intake form, a resident portal login, or any URL parameter that carries a diagnosis, medication list or care level is the kind of surface that should not carry a third-party pixel without a signed business associate agreement covering that vendor.
| Page or form type | Typical tracking risk | What changes the risk |
|---|---|---|
| Public floor plan / amenities page | Low | No health data collected or implied |
| Pricing / cost-of-care estimator | Low-moderate | Care-level selection can imply health status |
| Care assessment or intake form | High | Directly captures diagnosis, ADLs, medication needs |
| Resident or family portal login | High | Authenticated access to protected health information |
| Virtual tour booking form | Low | Scheduling data alone, no health disclosure |
Why attribution breaks down before the click even happens
A Place for Mom's February 2025 survey of 1,104 family caregivers found 34% describe their search as do-it-yourself, while 47% rely on conversations with health care professionals, friends or family for advice and recommendations along the way. 88% agree families need more guidance navigating the process, and more than two-thirds secure care within 60 days of starting to look, often triggered by a fall or a hospital discharge rather than a planned timeline.
Last-click attribution assigns the conversion to whichever channel touched the form last — typically a branded search or a direct visit — when the actual decision was shaped weeks earlier by a discharge planner's recommendation or a family conversation that no pixel ever saw. A tracking stack that only reports last-click channels will systematically undercount referral and word-of-mouth influence and overstate the ROI of bottom-funnel paid search.
| Caregiver search behavior (A Place for Mom, Feb 2025) | Share | Tracking implication |
|---|---|---|
| Search described as do-it-yourself | 34% | Digital channels get more credit than they earn |
| Rely on professional/personal advice mid-search | 47% | Referral sources need their own tracking code |
| Say families need more guidance overall | 88% | Content that answers questions outperforms ads |
| Secure care within 60 days of starting to search | >67% | Short lead-to-move-in windows reward speed metrics |
The industry backdrop the numbers sit inside
AHCA/NCAL counts 41,465 assisted living communities nationwide with nearly 1.4 million licensed beds, a national median cost of $6,200 a month ($74,000 a year), and a resident base that is majority age 85 and older. 57.3% of communities are chain-affiliated and 42.7% are independently owned — a split that matters for tracking because chain operators can build a shared analytics layer across properties while independents are usually working from whatever a single community's point-of-sale or CRM vendor provides out of the box.
| Industry fact (AHCA/NCAL) | Figure |
|---|---|
| Assisted living communities in the U.S. | 41,465 |
| Licensed beds nationwide | ~1.4 million |
| National median monthly cost | $6,200 |
| National median annual cost | $74,000 |
| Chain-affiliated communities | 57.3% |
| Independently-owned communities | 42.7% |
What AI is already doing to the analytics layer
Argentum's report found AI adoption concentrated in predictive analytics (70%), staff-efficiency uses including sales and marketing (50%), and chatbots for resident interaction (50%), with far smaller shares on robotics for housekeeping (25%) or mobility assistance (15%). 76% of 2024 respondents called AI's effect on the industry significantly transformative or positive, up sharply from 58% in 2023 — but executives were candid that AI's actual effect on resident care quality has so far been minor (36%) or moderate (32%), with none reporting a significant impact yet. Marketing analytics is one of the few areas where the gap between AI enthusiasm and AI-driven results is already closing, since lead scoring and channel-mix modeling need far less structured data than clinical prediction does.
Coverage of the same Argentum/A Place for Mom survey by McKnight's Senior Living underlines the same tension the raw numbers show: rising AI optimism sitting on top of persistent interoperability complaints, which is exactly the condition that keeps a marketing analytics stack stuck at the "watch the trend" stage described above rather than progressing to real attribution.
Building the dashboard operators actually described wanting
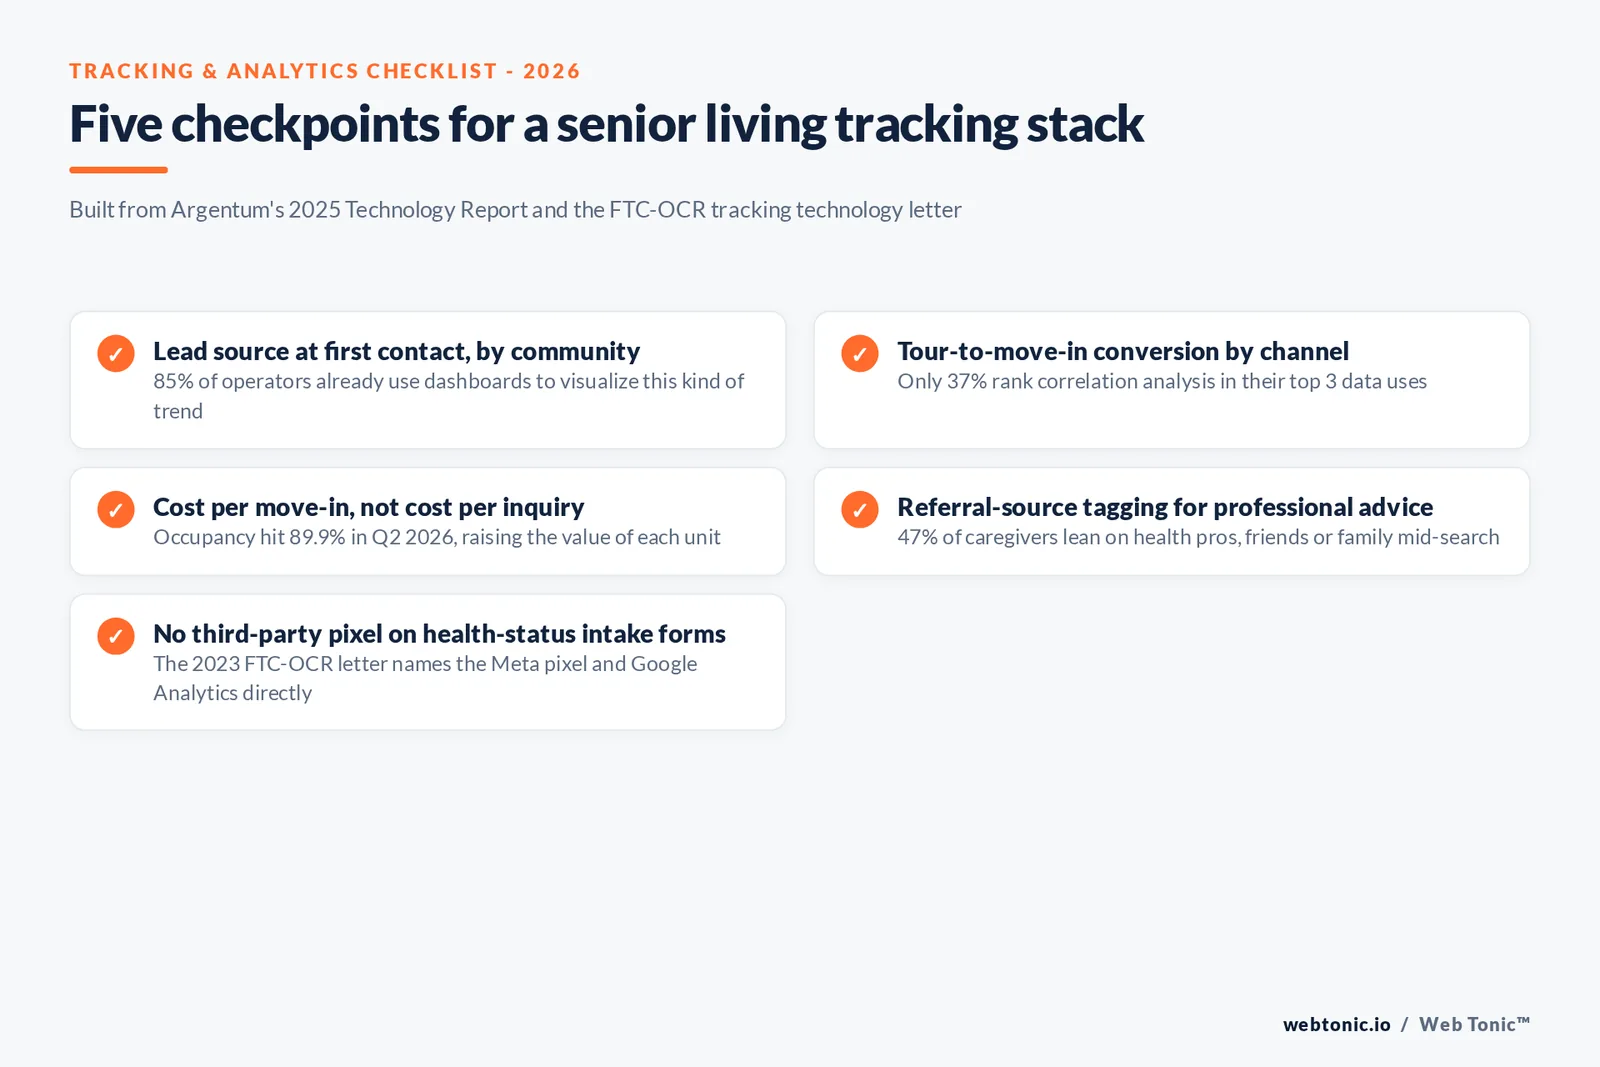
Asked how they would spend a hypothetical $2 million technology windfall, Argentum's respondents repeatedly named integration over new tools: "revamp and integrate software across the company — ERP, CRM, information management, analytics, EHR, call systems," as one operator put it, adding that "hospitals need to have this kind of thing, so they do. Senior living hasn't been held to the same standards." The honest starting dashboard for a marketing team, given that admission, is lead source, cost per qualified tour, tour-to-move-in rate by community and channel, and days from inquiry to lease — four numbers that require a CRM-to-occupancy connection, not a new predictive model.
Our data and analytics practice builds that connection before adding anything more advanced, and our growth marketing team uses the resulting channel data to reallocate budget toward the referral and content sources caregivers actually report using. If your current stack can't answer these four questions yet, talk to us about what to fix first.
Frequently Asked Questions
What should a senior living tracking dashboard actually log?
Argentum's 2025 Technology Report found operators rank digital dashboards that visualize trends and patterns as their most-used data application, at 85%, ahead of one-off reports (78%) and resident care plans (63%). The honest floor for a marketing-facing dashboard is lead source at first contact, tour-to-move-in conversion by community, cost per move-in by channel, and days from inquiry to lease, because those four numbers are what connect ad spend to occupied units rather than to inquiries that never convert.
Is HIPAA actually a factor in senior living ad tracking?
It depends on what the tracking pixel touches. HHS's Office for Civil Rights and the FTC jointly warned in a July 2023 letter that tracking technologies such as the Meta pixel and Google Analytics can create HIPAA and FTC Act exposure when they sit on pages or forms that reveal a person is seeking care for themselves or a relative. A marketing site's location pages are lower risk than a resident portal or a care-assessment intake form; the safer split is to keep pixels off any page or form that captures health status, medication needs, or diagnosis.
Why is attribution so hard to model for a senior living lead?
Because the actual buyer is rarely the searcher. A Place for Mom's February 2025 survey of 1,104 family caregivers found 34% describe their search as do-it-yourself while 47% lean on conversations with health care professionals, friends or family for advice, and 88% say families need more guidance navigating the decision. A digital channel report that ignores the referral conversation a discharge planner or geriatrician has already had is measuring only part of the funnel.
How much does occupancy data actually move, and does it change what gets tracked?
NIC MAP put national senior housing occupancy at 89.9% in the second quarter of 2026, its 20th consecutive quarter of gains, with 15 of 31 primary markets already above 90%. At near-capacity occupancy, the marketing question shifts from filling beds to filling the right beds at the best rate, which makes cost per qualified tour and pace-to-lease-up more useful tracked metrics than raw inquiry volume.
What is the most common analytics gap operators report themselves?
Interoperability, not appetite. Argentum's 2025 survey found only 37% of senior living executives rank statistical analysis that identifies correlation and causation among their top three decision-making uses of data, and just 22% rank predictive analytics that highly, even though 85% already use dashboards. The bottleneck is that marketing, EHR, CRM and billing systems don't share a data model, so the dashboards that exist show activity, not attribution.
Sources
NIC - Occupancy in senior housing climbs as half of primary markets top 90%, Q2 2026
Argentum & A Place for Mom - The State of Technology Adoption in Senior Living, 2025
McKnight's Senior Living - Coverage of the Argentum/A Place for Mom technology survey
A Place for Mom - Senior Care Search Trends: Navigating Options in the U.S., 2025
AHCA/NCAL - Assisted Living Facts & Figures
Pew Research Center - Demographics of internet and home broadband usage
AARP - Tech Use and Adoption Growing Among Adults Age 50-Plus, 2026
FTC & HHS OCR - Joint letter on use of online tracking technologies, July 2023