



Table of contents
Search engine marketing statistics travel faster than their sources. A figure gets quoted, rounded, and re-quoted until the study behind it - its sample, its date, its industry mix - disappears. This page runs the most-repeated 2026 SEM numbers back through their original source and keeps only the ones that survive.
Key Takeaways
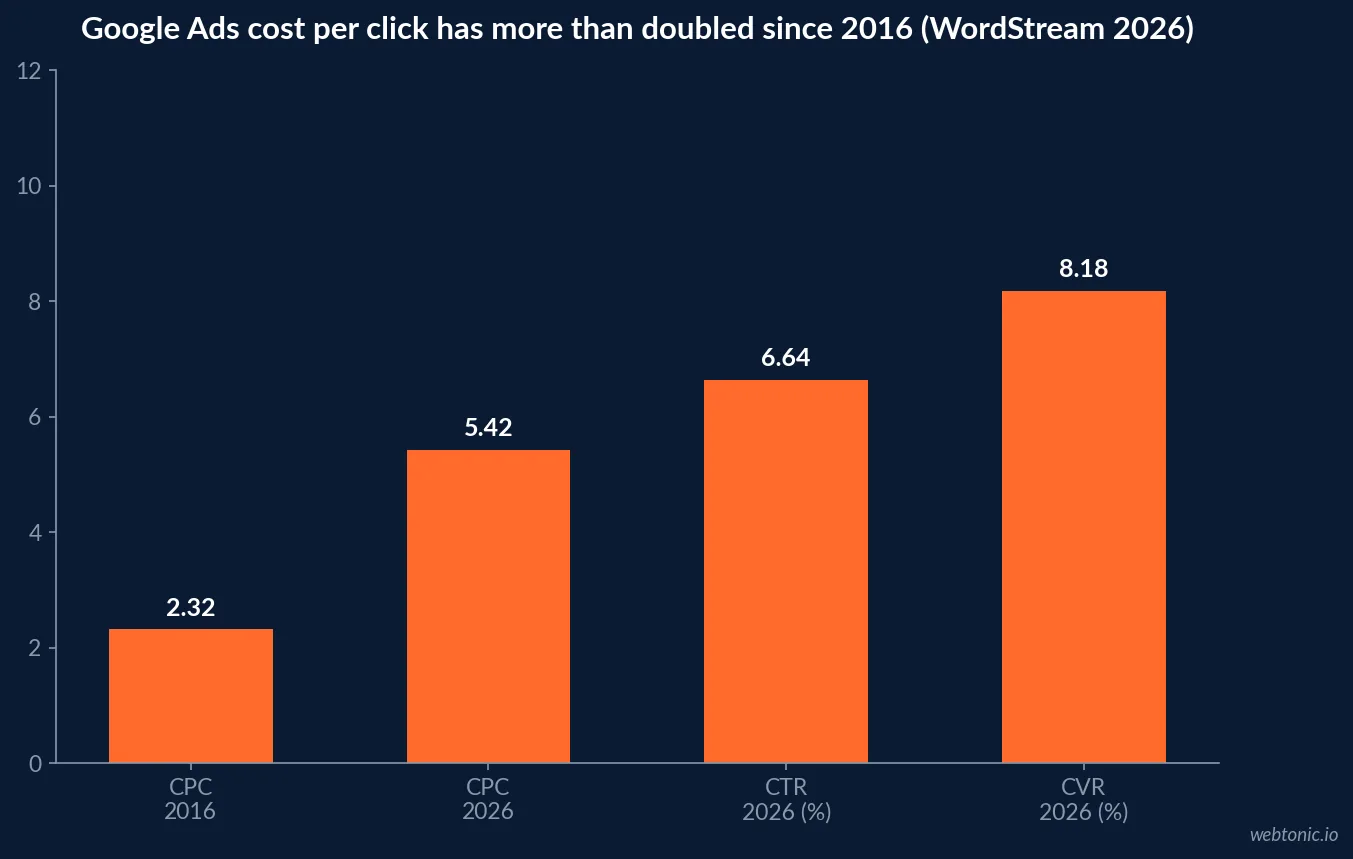
- Average Google Ads CPC across industries is USD 5.42 in 2026, more than double the USD 2.32 recorded in 2016.
- Average click-through rate sits at 6.64% across a panel of 13,000-plus campaigns.
- Average conversion rate is 8.18%, improving year over year in 87% of tracked industries.
- Average cost per lead is USD 66.69, up from USD 59.18 a decade ago.
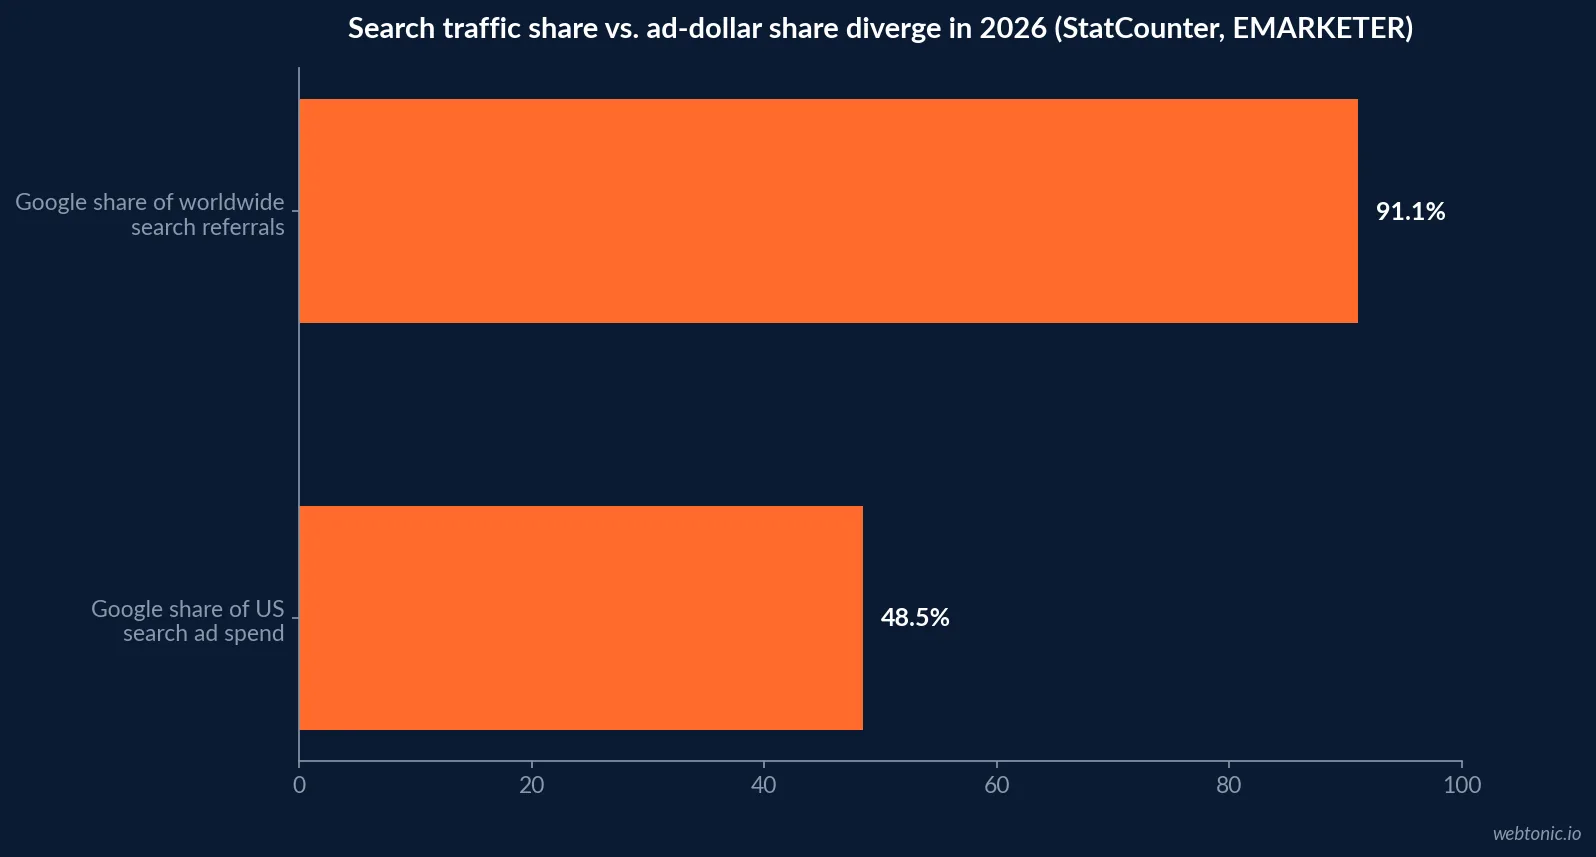
- Google holds 91.1% of worldwide search referrals as of August 2026.
- Google's US search engine share sits lower, at 86.1%, than its global figure.
- Google's share of US search ad spend falls to 48.5% in 2026, below half for the first time in over 20 years.
- Google Search & other revenue grew 17% year over year in Q2 2026.
- An AI Overview cuts top-ranking clicks by roughly 58% versus a matched query with no overview present.
- That is worse than the 34.5% drop measured one year earlier on the same methodology.
- Legal and attorney categories carry the highest CPCs in the WordStream panel.
- Animals and pets carries the highest measured conversion rate, at 16.22%.
- Arts and entertainment shows the highest click-through rate, at 12.75%.
- 70.2% of marketers say they can adapt strategy to organic search changes.
- 40.60% of marketers cite updating SEO for search changes as a top 2026 priority.
Why the same SEM statistic shows up with three different values
Search engine marketing statistics get quoted from three different layers that rarely get labeled: a vendor's own panel (WordStream's Google/Microsoft Ads sample), a syndicated market forecast (EMARKETER's ad-spend models), and a public traffic-referral index (StatCounter). Each answers a different question - "what does my account look like," "where is ad money going," and "who gets the click" - and blending them into one sentence is where most of the bad statistics start.
The fix is not to distrust the numbers. It is to keep the layer attached to the figure every time it is repeated.
| Layer | What it actually measures | 2026 figure | Source |
|---|---|---|---|
| Vendor account panel | Average CPC, CTR, CVR across managed accounts | CPC USD 5.42, CTR 6.64% | WordStream |
| Ad-spend forecast | Where advertiser dollars are projected to flow | Google 48.5% of US search spend | EMARKETER |
| Traffic referral index | Which engine served the click, regardless of ad spend | Google 91.1% worldwide | StatCounter |
| Company financial filing | Actual reported ad revenue by segment | Search & other +17% YoY | Alphabet Q2 2026 results |
| Controlled click study | Before/after CTR on a matched query sample | AI Overview clicks -58% | Ahrefs |
What the average Google Ads account actually costs in 2026
WordStream's 2026 benchmark panel, built from more than 13,000 search advertising campaigns across 23 industries running between April 2025 and March 2026, puts the average cost per click at USD 5.42, more than double the USD 2.32 recorded when the series began in 2016. Average click-through rate across the panel is 6.64%, average conversion rate is 8.18%, and average cost per lead is USD 66.69, up from USD 59.18 a decade earlier.
Those are cross-industry averages, and the panel itself shows why quoting one figure without a category is close to useless.
| Business category | Avg CTR | Avg CVR | What this means |
|---|---|---|---|
| Arts & Entertainment | 12.75% | 5.91% | Highest click-through of the tracked categories |
| Animals & Pets | 7.49% | 16.22% | Highest conversion rate of the tracked categories |
| Finance & Insurance | 9.83% | n/a in panel excerpt | High-intent category, high per-click cost |
| Attorneys & Legal Services | 5.87% | 5.55% | Consistently the most expensive CPC category |
| Travel | 9.32% | n/a in panel excerpt | Lower CPC, seasonal demand swings |
Search engine share versus search ad-spend share
These two numbers get merged into one sentence constantly, and they measure different things. StatCounter puts Google at 91.1% of worldwide search referrals in August 2026 - essentially flat for years - and at 86.1% specifically in the United States. Meanwhile EMARKETER projects Google's share of US search ad spending falls to 48.5% in 2026, the first time in more than two decades it has dropped below half, as Amazon absorbs the largest share of what Google is losing.
Read correctly: Google is not losing the search query. It is losing a growing slice of where the ad dollars attached to commercial queries get spent.
What Google itself reported for search revenue
Alphabet's own Q2 2026 earnings release shows Google Search & other revenue at USD 63.27 billion for the quarter, up 17% year over year, alongside YouTube ads revenue up 13%. That single filing is worth more than a dozen aggregator posts: it is the one number in this article that is legally certified rather than estimated.
The takeaway for a media plan: search ad demand is still growing at double-digit rates even as average CPCs rise, which means competition for the same auctions is not softening.
| Alphabet segment, Q2 2026 | Revenue | YoY growth | Source |
|---|---|---|---|
| Google Search & other | USD 63.27B | +17% | Alphabet Q2 2026 earnings release |
| YouTube ads | USD 11.06B | +13% | Alphabet Q2 2026 earnings release |
| Google Network | USD 7.30B | flat/-1% | Alphabet Q2 2026 earnings release |
| Google Services total | USD 94.54B | +15% | Alphabet Q2 2026 earnings release |
The AI Overview number that actually replicates
Ahrefs sampled 300,000 keywords - 150,000 with an AI Overview present and 150,000 informational queries without one - and compared clickthrough rate for the top-ranking page in December 2023 against December 2025. Position-one clickthrough on AI Overview queries fell to roughly 1.6% from a forecast baseline of about 3.7% had the overview not existed: a 58% relative drop, worse than the 34.5% Ahrefs measured on the same method a year earlier.
This is one of the few AI-search statistics built on a controlled before/after comparison rather than a single snapshot, which is exactly why it keeps showing up in serious media plans instead of just round-up posts.
| AI Overview click study | Dec 2023 CTR | Dec 2025 CTR | Relative change |
|---|---|---|---|
| Informational query, position 1 | 7.6% | 3.9% | -49% (organic decline, all causes) |
| AI Overview query, position 1 (forecast, no overview) | 7.3% | 3.7% | Predicted trend line |
| AI Overview query, position 1 (actual, with overview) | 7.3% | 1.6% | -58% vs forecast |
How marketers say they are responding
HubSpot's 2026 State of Marketing report, surveying more than 1,500 marketers, finds 40.60% naming "updating SEO for search changes" a top priority this year, and 70.2% saying they believe they can adapt strategy to organic search shifts such as AI Overviews. Those are confidence figures, not performance figures - useful context, not proof that the adaptation is actually working yet.
Our own growth marketing team treats that gap between stated confidence and measured click behavior as the real planning risk for 2026 budgets.
| Marketer sentiment, 2026 (HubSpot) | Share | Read this as |
|---|---|---|
| Cite SEO/search-change adaptation as a top priority | 40.60% | Awareness of the AI Overview shift |
| Believe they can adapt strategy to organic search changes | 70.2% | Confidence, not measured result |
| Expect at least a slight 2026 budget increase | 79.2% | Budgets recovering after 2025 tariff pause |
| Expect a significant 2026 budget increase | 21.2% | A minority, concentrated in mid-size firms |
A short checklist for citing an SEM statistic in 2026
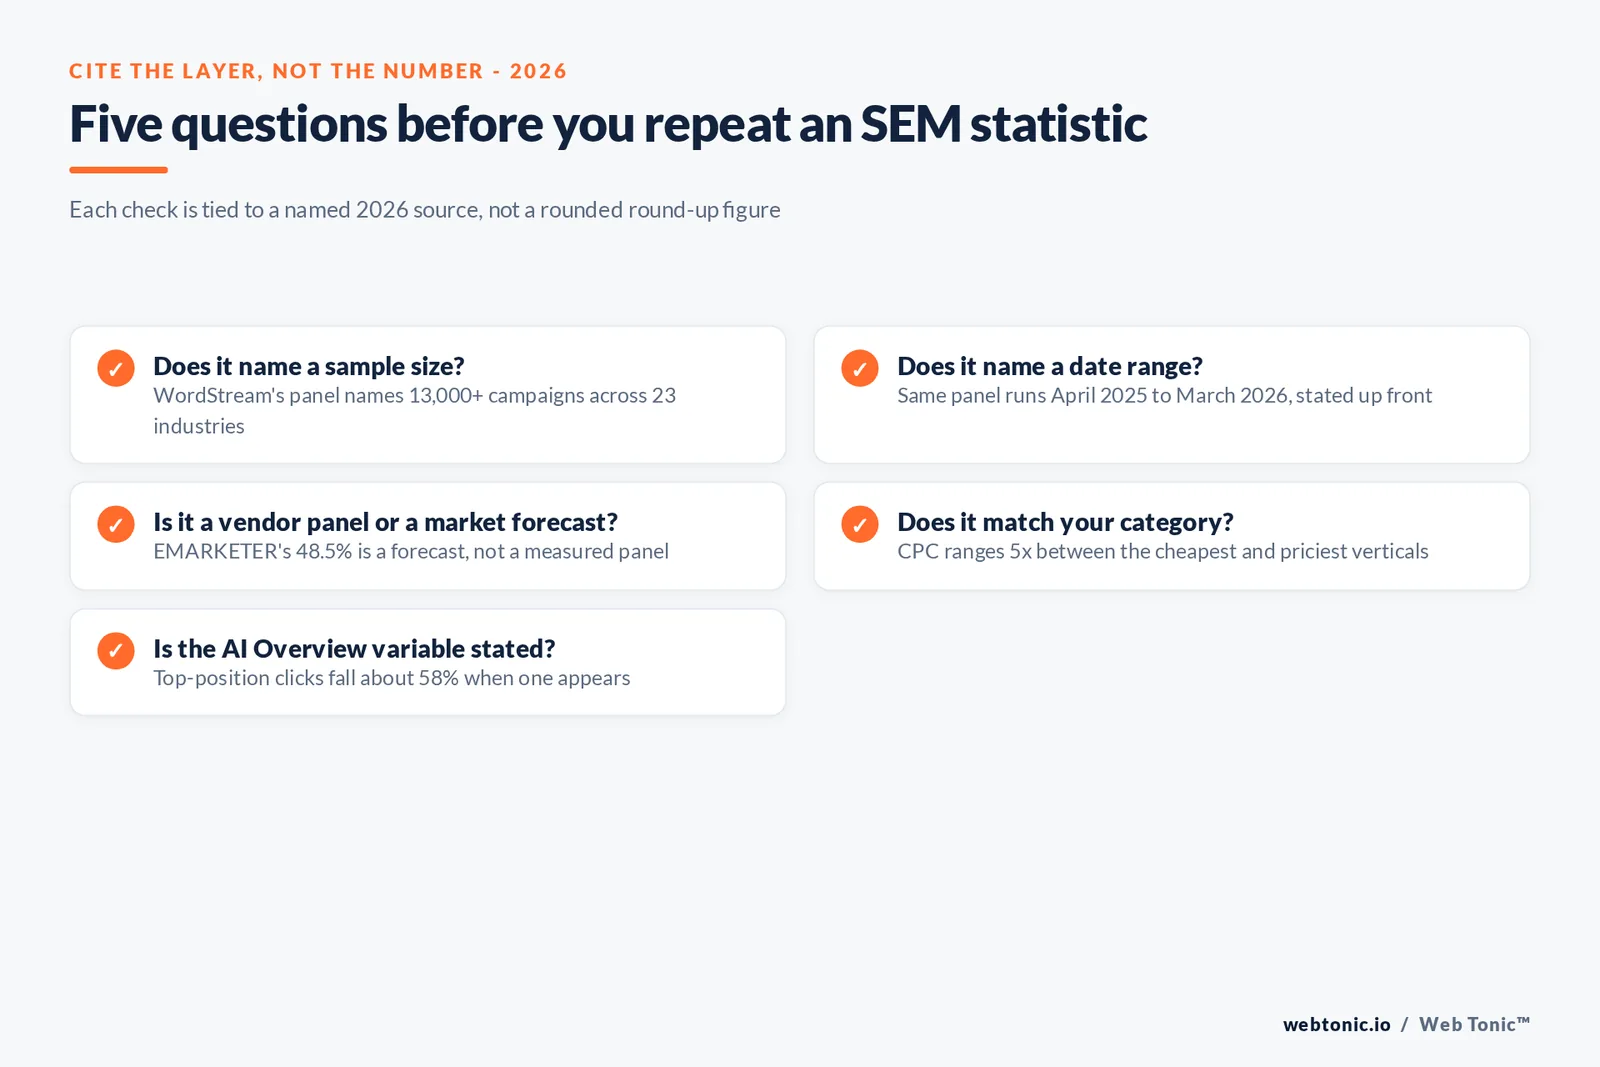
Before a number goes into a deck: does it name the sample size, does it name the date range, does it distinguish a vendor panel from a market forecast, and does it match the category you are actually buying in? If a figure fails two of those four questions, treat it as directional color, not a benchmark to be held accountable to.
For the campaign-structure side of the same problem, see our guide to building a Google Ads strategy, and for a first pass at your own numbers, our Google Ads pricing guide breaks the WordStream panel down by more categories than shown here.
Where this leaves a 2026 media plan
The reliable core is narrow but real: CPC and CTR averages with a named 13,000-campaign panel, a search-share number from a public referral index, an ad-spend forecast clearly labeled as a forecast, one certified revenue filing, and one controlled click study on AI Overviews. Everything else quoted alongside those five should be treated as a claim that still needs its source found before it is repeated. Talk to us if you want your own account's numbers checked against this panel before the next planning cycle.
The number AI visibility adds to the SEM conversation
Semrush's 2026 AI Visibility Index, built from more than 126 million real US AI search prompts across 22 industries and four AI platforms, is the first study of its scale to name which brands get cited inside ChatGPT, Google AI Mode, Google AI Overview and Gemini answers rather than which brands rank in blue links. It does not replace the SEM statistics above; it adds a parallel scoreboard that a media plan increasingly has to track alongside cost per click.
The practical implication: a search marketing report that only shows CPC, CTR and conversion rate is describing a shrinking share of how buyers actually encounter a brand during a search session in 2026. Budgets that ignore the AI-citation layer entirely are optimizing for a session type that is already losing share to the one Semrush is now measuring at scale.
| What gets measured | Sample size | Time frame | Source |
|---|---|---|---|
| Paid click performance | 13,000+ campaigns, 23 industries | Apr 2025-Mar 2026 | WordStream |
| AI answer citations | 126 million US prompts, 22 industries | Jan-Jun 2026 | Semrush |
| Organic click impact of AI Overviews | 300,000 keywords | Dec 2023 vs Dec 2025 | Ahrefs |
Frequently Asked Questions
Are search engine marketing statistics reliable?
Only the ones that name a source, a sample and a date. WordStream's 2026 benchmarks state a sample of over 13,000 campaigns across 23 industries between April 2025 and March 2026, which is checkable. A number with no named study behind it, repeated across a dozen round-up sites, is not a statistic - it is a rumor with a percent sign on it.
Why does Google's average CPC vary so much between reports?
Because it is not one number. WordStream's 2026 panel puts the cross-industry average at USD 5.42, legal and attorney-related terms sit well above that, and travel or sports categories sit near USD 2.50 to 2.80. A blended average hides a five-to-one spread between the cheapest and most expensive verticals, so quoting it without your category attached is close to meaningless.
Is Google actually losing search engine market share?
Not on query volume. StatCounter puts Google at 91.1% of worldwide search referrals in August 2026, essentially unchanged in years. What is shifting is ad-dollar share: EMARKETER projects Google's cut of US search ad spend falls below half, to 48.5%, in 2026 - the first time in two decades - as Amazon takes share of the paid-search wallet specifically, not the search engine itself.
Do AI Overviews really cut organic and paid clicks?
Ahrefs re-ran its click study on December 2025 data and found pages ranking first saw roughly 58% lower click-through when an AI Overview appeared on the query, worse than the 34.5% it measured a year earlier. That is a controlled before/after comparison against a matched sample, which is why it is one of the few AI-impact figures worth repeating without a caveat.
What should a marketer actually budget from these numbers?
Treat every blended average as a starting range, not a target. Pull your own account's CPC, CTR and conversion rate against WordStream's per-category table before setting a target CPA, and revisit the AI Overview exposure on your highest-volume queries at least quarterly, since that variable moved twice in twelve months.
Sources
WordStream - 2026 Google Ads Benchmarks
StatCounter - Search Engine Market Share Worldwide
EMARKETER - US Search Ad Spending Benchmarks, Q3 2026
Alphabet Inc. - Q2 2026 Earnings Release
Ahrefs - Update: AI Overviews Reduce Clicks by 58%
HubSpot - 2026 State of Marketing
Semrush - 2026 AI Visibility Index


