Table of contents
Roofing pairs the most expensive lead in home services - $313 per Google Ads lead at a $14.66 click - with demand that arrives in hail-shaped pulses. That combination breaks ordinary marketing reporting: the trend lines move with the weather, and the metrics that decide profit sit three stages past the last click. Here are the 2026 numbers a roofing dashboard should be built on.
Key Takeaways
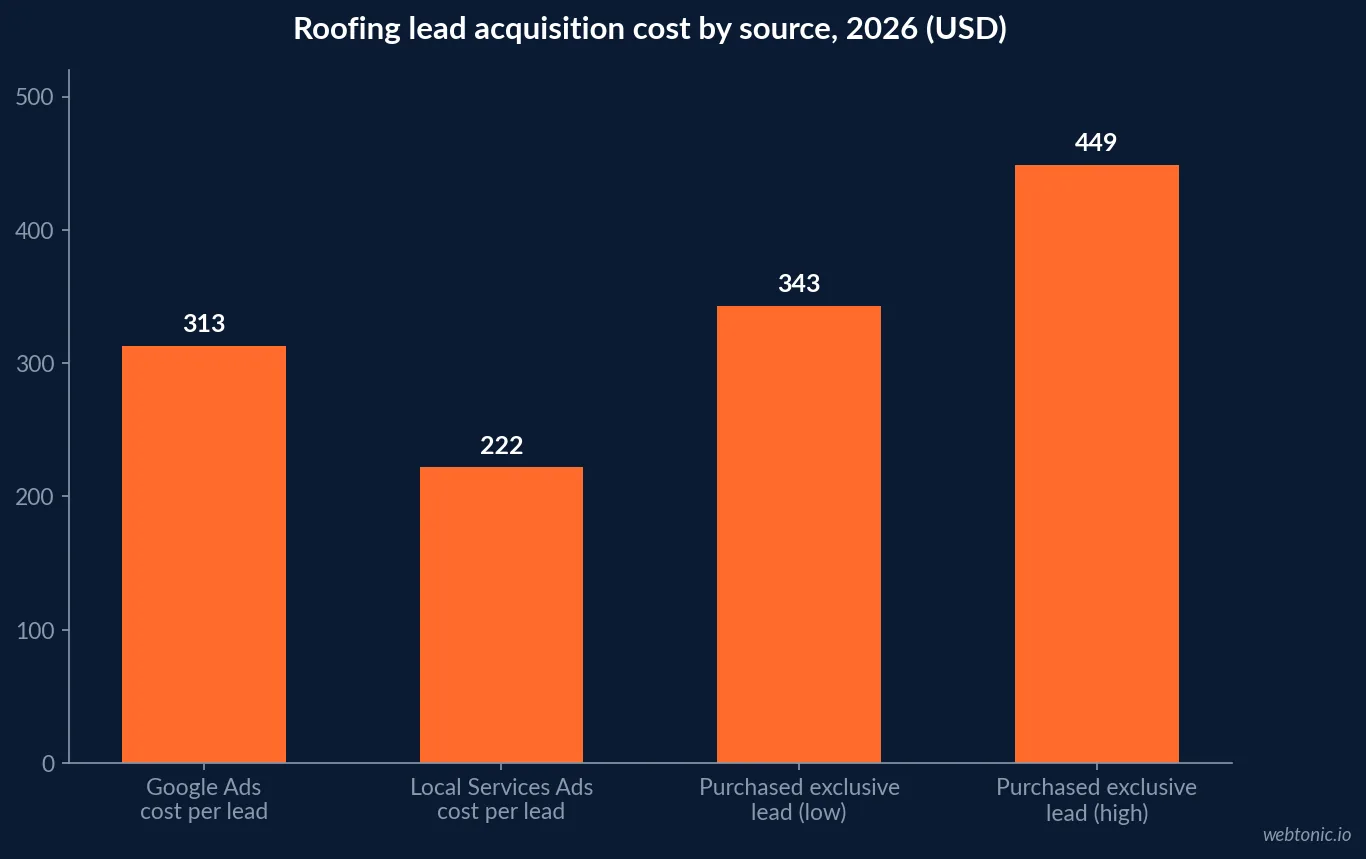
- Roofing lead costs are the highest in the trades: $313 Google Ads CPL, $14.66 CPC, $222 LSA CPL and $343-$449 for exclusive purchased leads.
- Advertised lead-to-sale runs 3-7% raw and 30-50% on qualified leads, so cost per lead and cost per signed job differ by an order of magnitude.
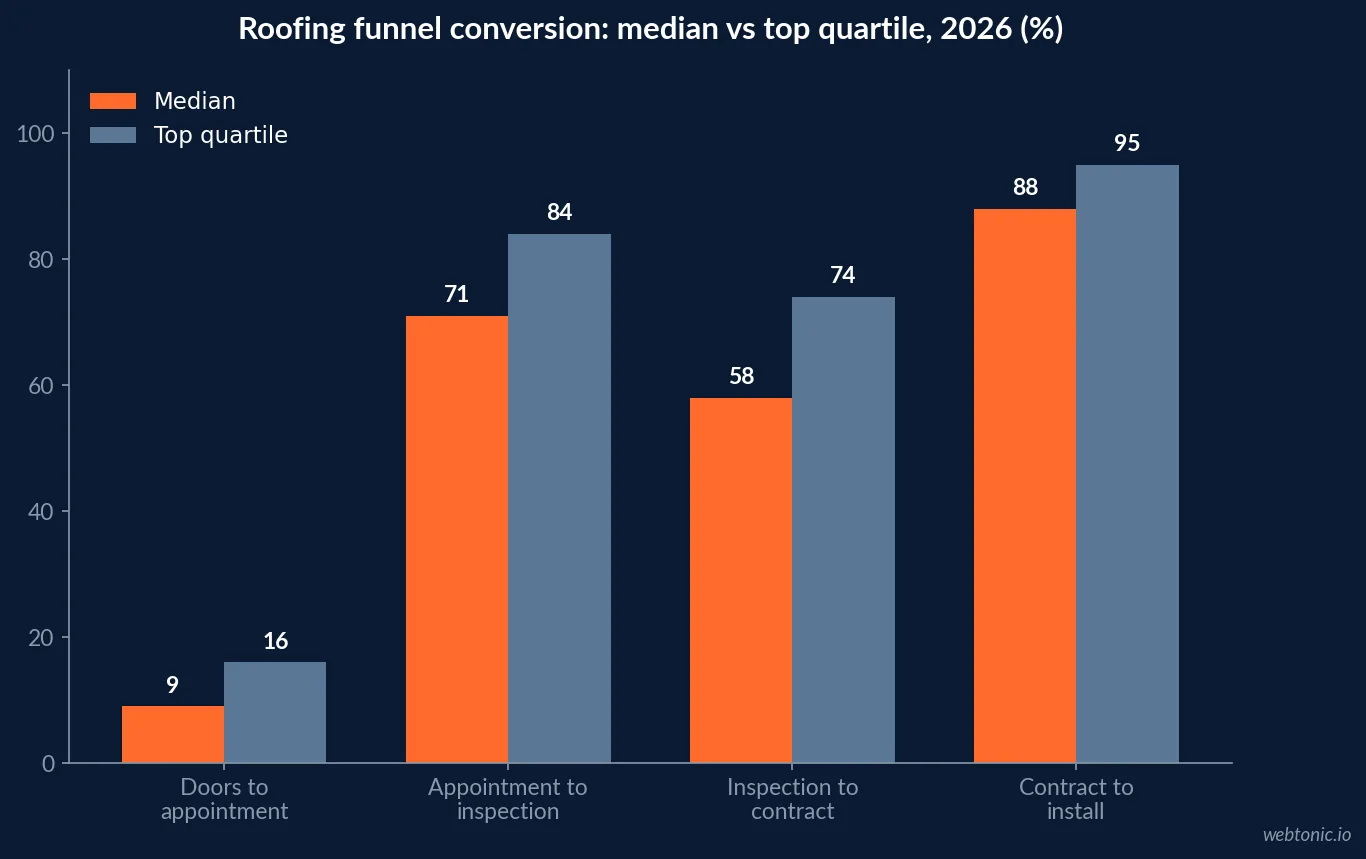
- Median funnel conversion: doors to appointment 9%, appointment to inspection 71%, inspection to contract 58%, contract to install 88%.
- Top-quartile companies hit 16% / 84% / 74% / 95% on the same four stages.
- Appointment rates run 210% above baseline in the first 30 days after a storm and 90% above baseline from day 31 to 90.
- Median job value is $13,400 with a $19,200 top quartile, and systematic supplementing adds about 40% of revenue per job.
- Revenue per sales rep climbs from $310,000 in 1-5 rep teams to $510,000 above 36 reps.
- Each missed call is worth $8,000-$15,000, and post-storm call volume spikes 5-10x.
- Only about 45% of roofing companies above $1M revenue use a CRM, and roughly 40% of home-services phone leads never get a source attached.
- 67-68% of organisations use dashboards and 78% of executives decide with them, versus 91% in telecom - contractors sit at the bottom of that distribution.
- The dashboard software market is roughly $7.88B in 2026, heading past $14.8B by 2030.
- Marketing spend in roofing runs 7.7-9.4% of revenue, so a 2-point reporting error moves a quarter of the marketing budget.
Roofing reporting benchmarks at a glance
These are the figures a roofing dashboard should be measured against rather than against last month. Acquisition costs come from 2026 roofing marketing benchmark data; funnel and job figures come from the HailMate roofing sales benchmark study of 247 companies and 2,400 claims.
| Metric | 2026 roofing benchmark | What it decides |
|---|---|---|
| Cost per click (search) | $14.66 | Whether search is affordable at your close rate |
| Cost per lead (Google Ads) | $313 - highest in home services | Channel mix, not campaign settings |
| Cost per lead (LSA) | About $222 | Whether LSA should carry the base load |
| Purchased exclusive lead | $343-$449 | Make-or-buy decision on lead generation |
| Lead to sale | 3-7% raw, 30-50% qualified | Whether the problem is media or qualification |
| Inspection to contract | 58% median, 74% top quartile | Sales process and rep coaching |
| Average job value | $13,400 median, $19,200 top quartile | Allowable cost per signed job |
| Supplement capture | Adds about 40% of revenue per job | Margin on insurance work |
| Marketing as % of revenue | 7.7-9.4% | Whether the budget itself is the constraint |
| Missed call value | $8,000-$15,000 each | Why call handling belongs on the marketing page |
The chain that matters: click to signed job
Chained together, the roofing benchmarks make the argument by themselves. A $14.66 click becomes a $313 lead. If 3% to 7% of advertised leads sign, media cost per signed job lands between roughly $4,500 and $10,400; at the 30% to 50% conversion rate contractors report on qualified leads, the same $313 lead implies $626 to $1,043 per signed job. Both numbers are true - they are counting different things, which is exactly why a dashboard has to define the denominator in writing.
Against a $13,400 median job at 35% to 50% gross margin, contribution per job is roughly $4,700 to $6,700. That is the ceiling the media cost per signed job has to stay under, and it moves faster with qualification and speed to lead than with any bid adjustment. A five-point improvement in inspection-to-contract - from the 58% median toward the 74% top quartile - reduces cost per signed job more than a 20% cut in cost per click.
Fourteen numbers a roofing dashboard should show
Contractor reporting frameworks converge on a short list. The version below is what a roofing company between $2M and $30M can populate without buying new software, drawing on home-services KPI dashboard guidance and roofing sales metrics frameworks.
| # | Metric | Target / benchmark | Cadence |
|---|---|---|---|
| 1 | Marketing spend as % of revenue | 7.7-9.4% | Monthly |
| 2 | Cost per lead by source | $313 Google, about $222 LSA | Weekly |
| 3 | Share of leads with a captured source | Above 90% | Weekly |
| 4 | Missed-call and after-hours call rate | Under 5% | Daily in storm windows |
| 5 | Speed to first contact | Minutes, not hours | Weekly |
| 6 | Lead to appointment | Track trend; 9% on canvassed doors | Weekly |
| 7 | Appointment to inspection | 71% median, 84% top quartile | Weekly |
| 8 | Inspection to contract | 58% median, 74% top quartile | Weekly |
| 9 | Contract to completed install | 88% median, 95% top quartile | Monthly |
| 10 | Cost per signed job by source | Under contribution per job | Weekly |
| 11 | Average job value | $13,400 median, $19,200 top quartile | Monthly |
| 12 | Supplement capture rate | Systematic supplementing adds about 40% | Per job |
| 13 | Revenue per sales rep | $310k small teams to $510k at scale | Monthly |
| 14 | Storm-event flag on every comparison | Swath dates plotted with spend | Always on |
Note what is missing: impressions, reach, follower counts and anything that cannot be traced to a signed job. The channel-level layer that feeds line 2 is covered in our roofing analytics statistics breakdown, and the paid detail behind the cost per lead figure sits in our roofing Google Ads statistics guide.
Storm-adjusted baselines are non-negotiable
No other trade has a demand driver this large or this unreported. In the 30 days after a major storm, appointment rates run 210% above baseline and close rates 85% above baseline; between day 31 and 90 the lift is 90% and 40%. Call volume in the same window rises 5-10x, and 3.4 contractors get contacted per homeowner, with the first responder booking about 62% of the time.
| Window | Appointment rate vs baseline | Close rate vs baseline | What the dashboard must do |
|---|---|---|---|
| Days 0-30 after swath | +210% | +85% | Daily review; capacity and call answer rate on page one |
| Days 31-90 | +90% | +40% | Weekly review; watch supplement capture and cycle time |
| Days 91-180 | Fading to baseline | Fading to baseline | Re-establish the true baseline before judging channels |
| No storm in either period | Baseline | Baseline | Only window where clean period-over-period is valid |
Practically, that means a storm layer on the timeline: swath date, affected ZIP codes, and a flag on every period comparison that straddles it. Without it, the marketing team gets promoted for hail in one quarter and blamed for clear skies in the next. The attribution mechanics behind that layer are covered in our roofing marketing attribution statistics guide.
Your dashboard inherits your data quality
Contractor dashboards fail for unglamorous reasons. Only about 45% of roofing companies above $1M in revenue run a CRM, roughly 40% of home-services phone leads are never attributed to any source, and customer service representatives mislabel call sources 30-50% of the time. Because most roofing inquiries arrive by phone, a dashboard built on form fills describes a minority of the business - a point made well in this teardown of why CRM reports do not match reality.
Three fixes come before any visualisation work. First, dynamic number insertion so the source is captured by software rather than memory. Second, a required lead-source field with a short closed list - free text guarantees drift. Third, a five-minute weekly reconciliation of signed jobs against recorded sources. Only then is a chart worth drawing, as the contractor analytics dashboard literature repeatedly finds.
Adoption: enterprise standard, contractor exception
Reporting software stopped being an edge in most sectors. The dashboard software market is roughly $7.88 billion in 2026 and forecast to pass $14.8 billion by 2030, with more than 60% of deployments cloud-based. Adoption is lopsided: 91% of telecom, 89% of finance and 85% of e-commerce organisations depend on dashboards against 67-68% of organisations overall, according to aggregated dashboard usage data.
Roofing sits at the bottom of that distribution, in an industry of roughly 103,000 US contractors where 68% employ fewer than 10 people. For a $10M roofing company, the reporting layer is therefore one of the few advantages competitors have not bought yet - and the marketing data itself is getting harder to read, with survey work showing rising volumes and falling confidence in 2026 marketing data readiness.
Retail versus insurance work needs two views
The most common reporting mistake in a mixed roofing shop is one blended dashboard. Insurance restoration work - roughly 40% of residential roofing revenue - has different cycle times, different margin mechanics and a supplement step that retail work does not have. A blended cost per signed job describes neither.
| Dimension | Retail replacement | Insurance / storm restoration |
|---|---|---|
| Typical ticket | $8,000-$14,000 asphalt, $15,000-$30,000 metal | $13,400 median claim job, $19,200 top quartile |
| Cycle time | Days to weeks, price-led | Weeks, adjuster and scope-led |
| Decisive metric | Estimate close rate and financing take-up | Inspection to contract plus supplement capture |
| Margin lever | Product mix and crew productivity | Supplementing, which adds about 40% per job |
| Demand driver | Age of roof, home sales, referrals | Storm swaths and claim deadlines |
| Primary dashboard risk | Slow follow-up on quotes | Capacity overload and missed calls in the surge |
Commercial work deserves a third view again, because a facility manager controlling 8 to 40 properties represents a $75,000 to $1.6M pipeline and a maintenance agreement worth $8,000 to $45,000 per property per year. Reporting a $250 commercial lead beside a $313 residential one hides the difference; our roofing LinkedIn Ads statistics guide covers that pipeline in detail.
Best practices for a roofing marketing dashboard
- Report cost per signed job beside cost per lead - at a 3-7% raw close rate the two differ by more than 10x.
- Plot storm dates on the same timeline as spend and revenue; flag every comparison that crosses one.
- Put missed calls and speed to first contact on the marketing page, valued at $8,000-$15,000 each.
- Use gross profit per job, not revenue, as the denominator for return on ad spend.
- Split retail, insurance and commercial into separate views with their own targets.
- Benchmark the four funnel stages against 9% / 71% / 58% / 88% and coach to the top quartile.
- Track supplement capture as a marketing-adjacent metric - it is about 40% of revenue per insurance job.
- Show revenue per rep against the $310k to $510k band before hiring more reps.
- Capture lead source with call tracking, not staff recall; labels are wrong 30-50% of the time.
- Cap the dashboard at fourteen lines with a named owner each; unowned metrics stop being updated.
- Review weekly, daily inside a 30-day storm window, and rebuild the dashboard only quarterly.
A 60-day build order
Sequence matters more than software. Most roofing companies can reach a trustworthy weekly view in two months using tools they already pay for.
| Window | Work | Metric it unlocks |
|---|---|---|
| Week 1-2 | Call tracking with dynamic numbers on every channel; required source field | Honest denominator |
| Week 3-4 | CRM stages mirrored to appointment, inspection, contract, install | Stage conversion by source |
| Week 5-6 | Job costing joined to lead source; gross profit per source | Cost per signed job vs contribution |
| Week 7 | Storm layer with swath dates and affected ZIP codes | Storm-adjusted baselines |
| Week 8 | One page, fourteen lines, colour rules and named owners | Weekly operating rhythm |
If you would rather have it built and audited once, our data intelligence team wires this stack for home-services operators, and our growth marketing team runs the channels it measures. Get in touch to see a roofing version.
Frequently Asked Questions
What should a roofing marketing dashboard actually measure?
Five layers, in this order: media spend and cost per lead by source, call handling (answer rate, missed calls, speed to first contact), funnel stage conversion (appointment, inspection, contract, install), job economics (average job value, supplement capture, gross profit) and a storm layer that dates every hail or wind event in the service area. A roofing dashboard that stops at cost per lead hides the two figures that decide profit - the 58% median inspection-to-contract rate and the $13,400 median job value.
What is a good cost per lead for a roofing company in 2026?
Roofing carries the most expensive lead in home services. Google Ads cost per lead benchmarks land near $313 at a $14.66 cost per click, Local Services Ads run closer to $222, and exclusive purchased leads sell for $343 to $449. At a 3% to 7% raw lead-to-sale rate on advertised leads, the honest dashboard metric is cost per signed job, which frequently runs $2,000 to $6,000 - not the cost per lead line most contractors report.
Why do roofing dashboards show misleading trends?
Because weather is a confounder that no ad platform reports. Appointment rates run 210% above baseline in the first 30 days after a major storm and 90% above baseline from day 31 to 90, so a month-over-month comparison across a hail event credits the marketing team for the sky. Every roofing dashboard needs storm dates plotted on the same timeline as spend and revenue, and year-over-year comparisons should be flagged when either period contains a swath.
How often should a roofing contractor review the dashboard?
Weekly in normal conditions and daily inside a storm window. Call volume spikes 5 to 10 times in the days after a hail event, the first contractor to respond books roughly 62% of the time, and each missed call is worth $8,000 to $15,000 at roofing job values. A weekly cadence catches pacing and conversion drift; a daily cadence in the 30-day window after a swath is what protects the revenue that storm actually created.
Do roofing companies actually use dashboards?
Far less than other sectors. Around 67% to 68% of organisations use digital dashboards and 78% of executives make decisions with them, against 91% in telecom and 89% in finance, while only about 45% of roofing companies above $1M in revenue run a CRM at all. That gap is why reporting is still one of the cheapest advantages available to a mid-sized roofing business - the data usually already exists, it has just never been joined.
Sources
GetX Media - 2026 Roofing Marketing Benchmarks
HailMate - Roofing Sales Benchmarks 2026
HailMate - State of Storm Restoration 2026
CallJolt - Roofing Industry Statistics 2026
Roofr - Roofing Sales Metrics to Track
Profitability Partners - Home Services KPI Dashboard Guide
9cv9 - Dashboard Software Statistics 2026
Gitnux - Dashboard Usage Statistics
RivetOps - Why CRM Reports Do Not Match Reality
PipelineOn - Contractor Analytics Dashboards
Supermetrics - Marketing Data Report 2026