



Table of contents
Most roofing contractors track leads, but only 10% connect call tracking, GA4, and their CRM into a unified attribution system. The gap between tracking leads and understanding which marketing dollars produce booked jobs is where the analytics advantage lives. This guide compiles the most current 2026 statistics on roofing marketing analytics, conversion tracking, attribution maturity, and the KPIs that separate top-performing contractors from the rest.
Key Takeaways
- Only 10% of roofing contractors have full attribution (call tracking + GA4 + CRM tied together).
- Just 5% optimize weekly with budget reallocation based on cost per acquisition by channel and lifetime value.
- 42% of inbound calls are booked into jobs — the typical contractor loses the majority of phone leads.
- Non-branded roofing Google Ads CPL averages $124, branded $44, and Performance Max $64 per SearchLight Digital's Q1 2026 benchmark.
- Closed ROAS for roofing ads is 2.46× across 15 contractors and $347K in analyzed spend.
- 95% of website visitors never call or fill out a form — reverse-IP visitor identification recovers a portion of this invisible traffic.
- Top-performing contractors spend 7–10% of gross revenue on marketing and track ROI at the job level.
- Three tracking layers are essential: call/form tracking, heatmaps/session behavior, and reverse-IP visitor identification.
Analytics Maturity in the Roofing Industry
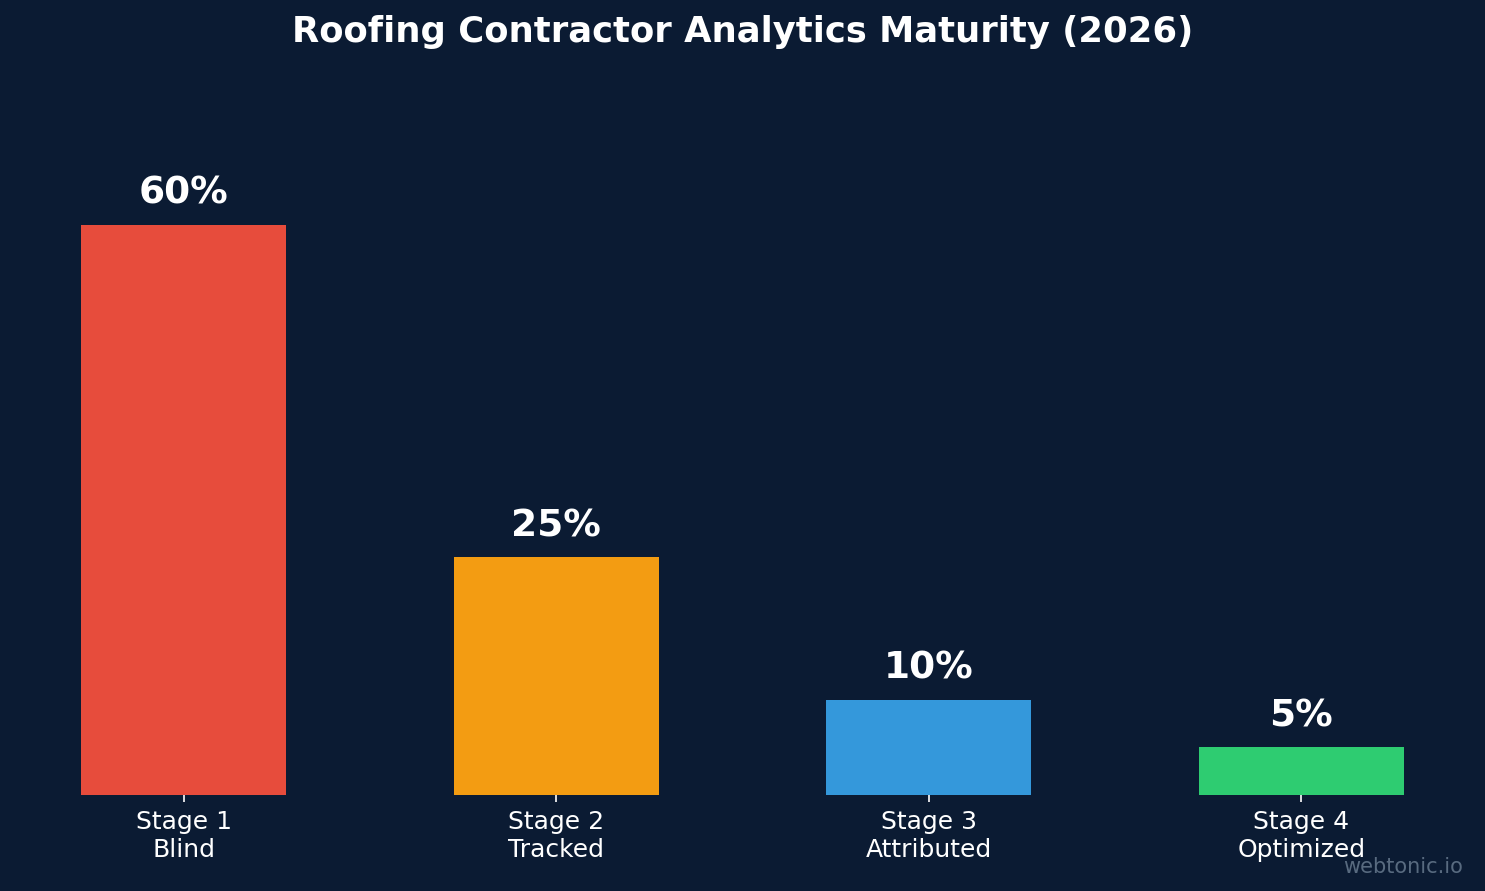
The roofing industry's analytics maturity follows a clear four-stage model. SkillMammoth's 2026 lead generation study mapped roofing contractors across these stages and found that the vast majority are still in the early phases of marketing measurement:
| Stage | Description | % of Roofers | Key Capability |
|---|---|---|---|
| Stage 1: Blind | No lead tracking — "business is good" or "business is slow" | ~60% | None — gut-driven decisions |
| Stage 2: Tracked | Lead count tracked but no source attribution | ~25% | Volume awareness |
| Stage 3: Attributed | Call tracking + GA4 + CRM tied together | ~10% | Channel-level ROI |
| Stage 4: Optimized | Weekly budget reallocation based on CPAC by channel + LTV | ~5% | Marginal efficiency optimization |
The distribution is stark: 85% of roofing contractors either don't track leads at all or track volume without attribution. This means the 15% with proper analytics infrastructure have a structural advantage — they can reallocate budget to their highest-performing channels while competitors spend blindly.
Conversion Tracking and Call Attribution
Phone calls dominate roofing lead generation, making call tracking the foundation of any analytics stack. PipelineOn's 2026 tracking software guide outlines the essential three-layer tracking stack for roofing companies:
- Layer 1: Call and form tracking (CallRail or WhatConverts) — dynamic number insertion, call recording, lead scoring, and GCLID capture
- Layer 2: Heatmaps and session behavior (Microsoft Clarity, free) — visual understanding of how visitors interact with your site
- Layer 3: Reverse-IP visitor identification — recover the 95% of visitors who never call or fill out a form
JobNimbus's Peak Performance 2026 report, analyzing thousands of roofing contractor data points, provides critical benchmarks. ServiceTitan benchmark data shows the typical contractor books only about 42% of inbound calls into jobs — meaning the majority of phone leads are lost to poor follow-up, unavailability, or qualification failures.
| Tracking Metric | Benchmark | Source |
|---|---|---|
| Inbound calls booked to jobs | 42% (typical contractor) | ServiceTitan / PipelineOn, 2026 |
| Website visitors who call | ~5% (47 of ~940 visitors example) | PipelineOn, 2026 |
| Form-fill rate | ~2% (18 of ~940 visitors example) | PipelineOn, 2026 |
| Invisible traffic (no action) | ~95% | PipelineOn, 2026 |
| Call duration for quality conversion | ≥60 seconds | mdniamul.com, 2026 |
| GA4 adoption in home services | 87% migrated | Industry reports, 2026 |
mdniamul's Google Ads conversion tracking guide for roofers emphasizes counting only calls over 60 seconds as conversions, which automatically filters out wrong numbers, spam, and short hang-ups. This single configuration change can reduce reported CPL by 20–30% by removing junk leads from the data — giving a more accurate picture of true marketing performance.
Cost Per Lead and ROAS by Channel
Understanding channel-level economics requires proper attribution. SearchLight Digital's Q1 2026 roofing benchmark, covering 15 contractors and $347,421 in spend, provides the most granular channel breakdown available:
| Channel | Avg CPL | Leads | Spend | Closed ROAS |
|---|---|---|---|---|
| Non-Branded Search | $124 | 2,491 | $310,031 | 2.07× |
| Branded Search | $44 | 727 | $31,767 | 6.22× |
| Performance Max | $64 | 78 | $4,992 | 2.71× |
| Blended (all channels) | $105 | 3,296 | $347,421 | 2.46× |
The 6.22× ROAS on branded search at $44 CPL vs. 2.07× on non-branded at $124 CPL illustrates why attribution matters so much. Without tracking, a contractor might assume all Google Ads perform equally — when in reality, branded campaigns return 3× more per dollar. PipelineOn's roofing digital marketing overview confirms these ranges and adds that the first 60–90 days of a new roofing Google Ads account typically produce above-average CPL as campaigns optimize.
BaaDigi's June 2026 roofing benchmarks, compiled from published industry reports cross-checked with client data, show that SEO-driven leads can drop effective CPL to $10–$50 after 12–18 months of consistent content and link building — making organic the highest-ROI channel over time for roofing companies willing to invest in a long-term growth marketing strategy.

KPIs That Top Roofing Contractors Track
PulseRevOps' 2026 roofing KPI framework identifies the metrics that separate top-quartile contractors from average performers. The four KPIs that actually matter for roofing marketing analytics are:
- Cost per acquisition by channel (CPAC): Not just CPL, but the full cost from click to closed job — including sales labor, follow-up costs, and channel spend. Top roofers track this weekly.
- Revenue by source: Total revenue generated from each marketing channel. Requires CRM integration with lead source tracking.
- Marketing ROI by channel: Revenue minus marketing costs, divided by marketing costs. The benchmark: a minimum 2× ROI threshold before scaling a channel.
- Customer lifetime value (LTV): For roofing, this includes the initial job plus maintenance contracts, referrals, and return business. Top-performing contractors target a 5:1 LTV:CAC ratio.
| KPI | Average Roofer | Top Quartile |
|---|---|---|
| Marketing spend (% of revenue) | 5–7% | 7–10% |
| LTV:CAC ratio | 2–3:1 | 5:1+ |
| Close rate (lead to job) | 25–35% | 40–50% |
| Speed to first contact | 2–4 hours | < 15 minutes |
| Call booking rate | 42% | 65–75% |
| Analytics review frequency | Monthly or never | Weekly |
FoundryCRO's 2026 home services benchmarks provide trade-specific data showing that roofing contractors who review analytics weekly and reallocate budgets based on channel ROAS outperform those who review monthly by 35–50% on effective cost per acquisition.
Common Analytics Mistakes in Roofing
The data reveals several recurring analytics errors that inflate reported performance or hide problems:
- Counting all calls as conversions: Without a 60-second minimum call duration filter, 30–40% of "conversions" are spam, wrong numbers, or hang-ups.
- Attributing jobs to the wrong touchpoint: SearchLight notes that roofers often attribute replacement jobs to the inspection call, but the inspection lead came from an LSA lead 3 weeks earlier.
- Ignoring branded vs. non-branded split: Blending branded search ($44 CPL, 6.22× ROAS) with non-branded ($124 CPL, 2.07× ROAS) hides the true economics of prospecting.
- Not tracking offline conversions: Most roofing jobs close over the phone or in person. Without CRM-to-ads pipeline integration, conversion data is incomplete.
- Over-relying on GA4 alone: GA4 doesn't track phone calls, misses cross-device journeys, and requires consent mode configuration to remain compliant. It's a necessary layer but not sufficient on its own.
- Missing the 95% invisible traffic: Standard analytics only tracks the ~5% of visitors who call or form-fill. Reverse-IP identification tools can recover a portion of the remaining 95% for outbound follow-up.
Building a Roofing Analytics Stack
Based on the data, the recommended analytics stack for a roofing company progressing from Stage 1 to Stage 4 maturity follows a phased approach:
- Foundation (Stage 2): GA4 + CallRail or WhatConverts for call tracking with dynamic number insertion. Cost: $50–$150/month.
- Attribution (Stage 3): Add CRM integration (JobNimbus, ServiceTitan, or HousecallPro) with lead source tracking. Connect Google Ads GCLID capture on calls. Cost: $200–$500/month.
- Visibility (Stage 3+): Microsoft Clarity (free) for heatmaps and session replay. Reverse-IP tools for visitor identification. Cost: $0–$200/month.
- Optimization (Stage 4): Weekly dashboard review with channel ROAS, CPAC, and LTV tracking. Automated budget reallocation rules. Cost: $300–$800/month for dashboarding tools.
Click-Vision's 2026 home services marketing statistics found that contractors who review marketing data weekly and adjust campaigns accordingly achieve 2–3× better ROI than those relying on monthly or quarterly reviews. The analytics stack investment of $250–$1,200/month typically pays for itself within the first optimized budget reallocation.
The Revenue Impact of Analytics Maturity
The financial gap between analytics-mature and analytics-blind roofing companies is substantial and growing. Contractors at Stage 4 (optimized) don't just track better — they earn more per marketing dollar because they continuously reallocate budget toward channels producing the highest closed revenue.
Consider the math: a roofing company spending $15,000/month on marketing with no attribution (Stage 1) distributes budget evenly across channels. If branded search returns 6.22× ROAS while non-branded delivers 2.07×, the blended return is approximately 2.46×. An analytics-mature competitor recognizes the 3× gap and shifts incremental dollars toward branded search capture, Performance Max at 2.71×, and SEO (which drops CPL to $10–$50 over 12–18 months). Over a year, this channel-level optimization generates $50,000–$120,000 in additional revenue on the same marketing spend.
The speed-to-contact metric amplifies this further. Top-quartile contractors respond to new leads in under 15 minutes vs. the average 2–4 hours. Research consistently shows that leads contacted within 5 minutes are 8× more likely to convert than those contacted after an hour. Analytics-driven operations that trigger immediate notifications when a high-value lead arrives — based on source, keyword, and estimated job value — close at materially higher rates than competitors relying on manual call-back lists.
The compounding effect of better analytics is clear: better tracking → better allocation → lower CPL → higher close rates → more revenue per dollar. This is why the 5% of roofers at Stage 4 are disproportionately represented among the industry's highest-revenue operations.
Related reading
- Locksmith Analytics Statistics — 2026 Benchmarks & Industry Data
- 30+ Statistics Shaping Tracking & Analytics in the Manufacturing Industry (2026)
- Med Spa Analytics: 2026 Benchmarks, KPIs & Performance Data
- Marketing Analytics services at Web Tonic
FAQ
What percentage of roofing contractors have proper analytics tracking?
Only 10% of roofing contractors have full attribution with call tracking, GA4, and CRM connected. Just 5% actively optimize with weekly budget reallocation based on cost per acquisition by channel and lifetime value. The majority (~60%) have no lead tracking at all.
What is the average cost per lead for roofing Google Ads?
Non-branded roofing search CPL averages $124, branded search $44, and Performance Max $64, based on SearchLight Digital's Q1 2026 benchmark of 15 contractors and $347K in spend. Blended ROAS across all channels was 2.46×.
How should roofers track phone call conversions?
Use call tracking software (CallRail or WhatConverts) with dynamic number insertion per visitor source, a 60-second minimum call duration filter to exclude spam, call recording for quality review, and GCLID capture on calls to tie phone leads back to specific Google Ads clicks.
What KPIs matter most for roofing marketing analytics?
The four essential KPIs are: cost per acquisition by channel (not just CPL — full click-to-job cost), revenue by source, marketing ROI by channel (minimum 2× threshold before scaling), and customer lifetime value. Top roofers target a 5:1 LTV:CAC ratio.
What does a complete roofing analytics stack cost?
A full analytics stack ranges from $250–$1,200/month: call tracking ($50–$150), CRM with lead source tracking ($200–$500), heatmaps and session replay (free via Microsoft Clarity), and dashboarding/optimization tools ($300–$800). The investment typically pays for itself within the first optimized budget reallocation.
Sources
skillmammoth.com — Lead Generation for Roofers 2026
pipelineon.com — Top Visitor Tracking Software for Roofing Companies 2026
pipelineon.com — Roofing Digital Marketing 2026
contractormarketingpros.net — JobNimbus Peak Performance 2026
searchlightdigital.io — Roofing Google Ads Cost Per Lead 2026
mdniamul.com — Google Ads Conversion Tracking for Roofing Companies 2026
baadigi.com — Roofing Marketing Benchmarks 2026
pulserevops.com — Best KPIs for Roofing Contractors
foundrycro.com — Home Services Marketing Benchmarks 2026
click-vision.com — Home Services Marketing Statistics 2026


