Table of contents

Roofing is the hardest home-services vertical to attribute: demand arrives in hail-shaped pulses, the conversion is a phone call, referrals are the top lead source for 95% of roofing companies, and the customer buys again in twenty years. Meanwhile paid leads cost $313 and jobs are worth $13,700-$14,600, so the measurement error is expensive. Here is what the 2026 data says about closing it.
Key Takeaways
- Only 33% of marketing leaders call their attribution "mostly accurate", and 67% say accuracy has declined since 2021.
- 76% use multi-touch attribution, yet 44% still default to last-touch because their tools do not support anything else.
- Branded paid search takes 28% of credit under multi-touch, 9% under MMM and 4% in lift tests.
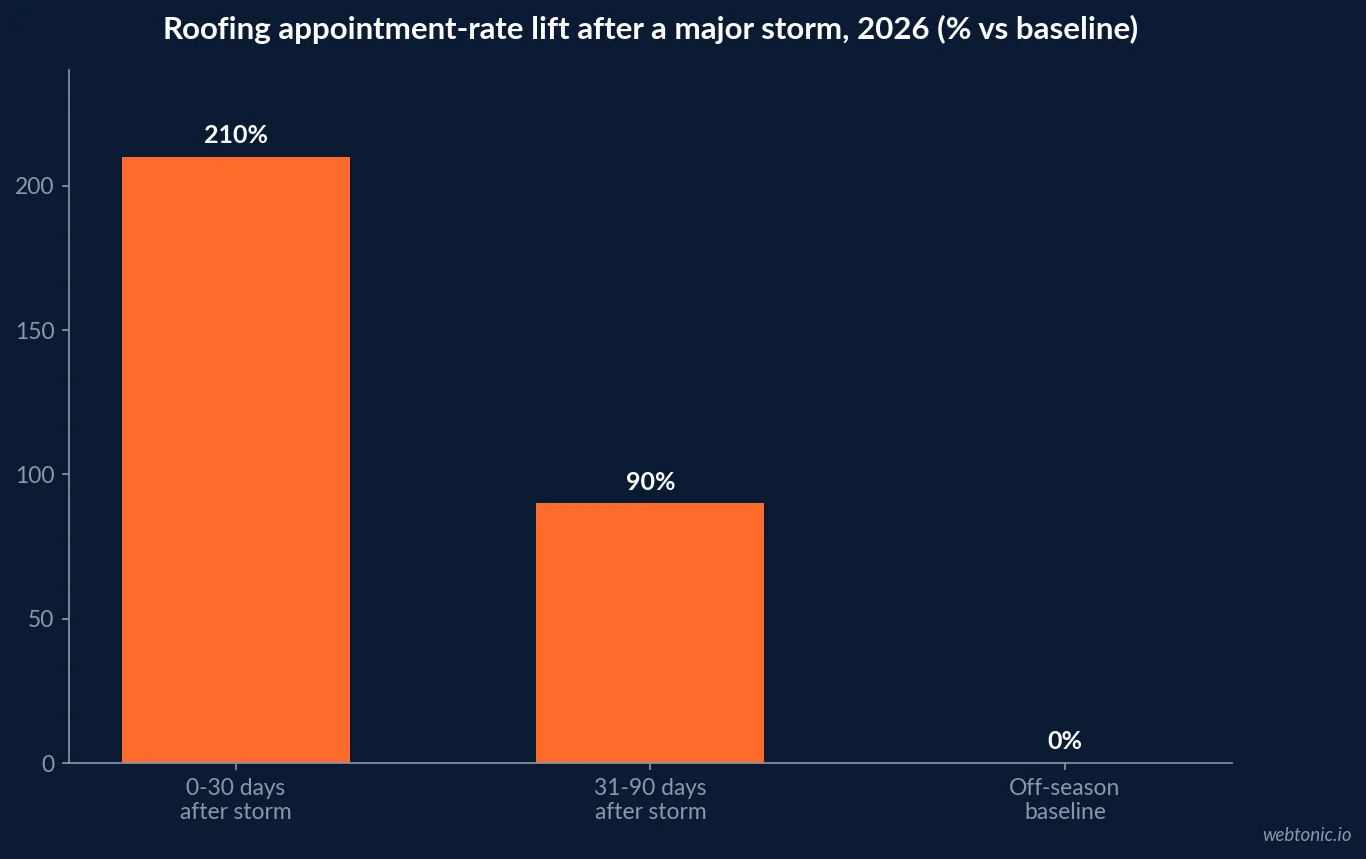
- Appointment rates run +210% and close rates +85% in the first 30 days after a storm - any test straddling a swath is unreadable.
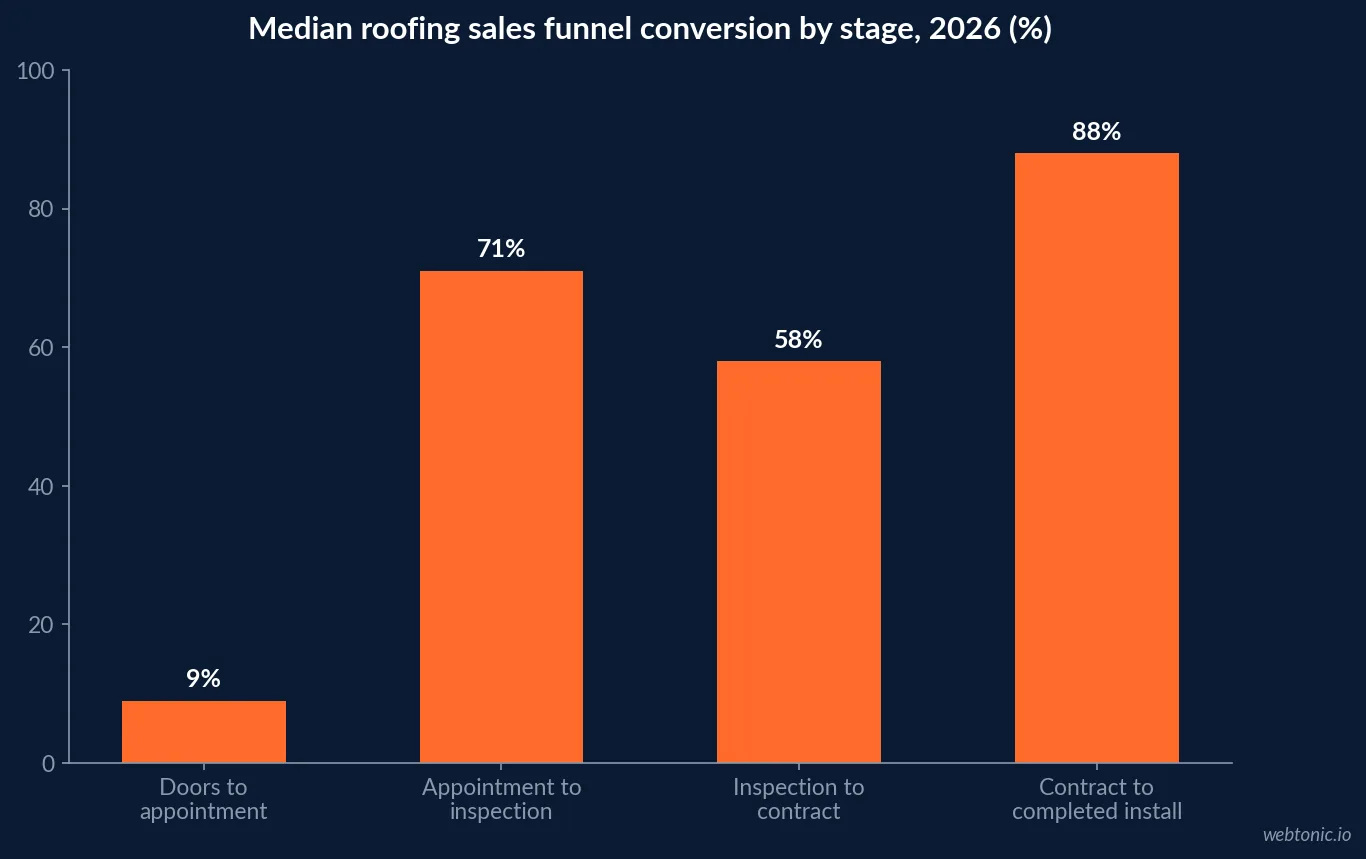
- Median roofing funnel: 9% doors-to-appointment, 71% appointment-to-inspection, 58% inspection-to-contract, 88% contract-to-install.
- Each missed call during a post-storm surge is worth $8,000-$15,000, with call volume spiking 5x-10x.
- Only 45% of businesses send offline sales data back to ad platforms and just 14% have fully automated lead-to-revenue tracking.
- Teams that improve attribution accuracy report +33% marketing ROI and -29% CAC.
The state of attribution accuracy in 2026
Attribution got harder, not easier, and roofing inherits every cross-industry problem plus its own. The baseline numbers from AM World Group’s attribution statistics compilation and Marketing LTB’s 2026 dataset:
| Attribution reality | 2026 figure | Roofing consequence |
|---|---|---|
| Marketers using multi-touch attribution | 76% | Model sophistication outruns data quality |
| Leaders calling attribution 'mostly accurate' | 33% | Budget decisions rest on estimates |
| Reporting accuracy declined since 2021 | 67% | iOS ATT, cookie loss, email privacy |
| Still using last-touch as primary | 44% (28% exclusively last-click) | Over-credits branded search |
| Buying influence in untracked 'dark social' | 40-60% | Neighbour referrals, storm chatter, Facebook groups |
| Businesses sending offline sales data back to platforms | 45% | Signed jobs never reach the ad auction |
| Fully automated lead-to-revenue tracking | 14% | Most roofers reconcile by hand |
| Teams that improved accuracy | +33% ROI, -29% CAC | The size of the prize |
The most useful single finding for roofers concerns branded search. In Presenc’s model-comparison study, branded paid search was credited with 28% of conversions by multi-touch attribution, 9% by media-mix modelling and just 4% by incrementality testing, while untracked channels - television, PR and AI search - received 0% from multi-touch and 7-13% from MMM. A roofer whose dashboard says branded search is the best channel is usually looking at demand created by a truck, a neighbour or a storm.
The four things that break roofing attribution
- Storm pulses. Insurance-related storm work is roughly 40% of residential roofing revenue in an average year, so seasonality is event-driven rather than smooth.
- Phone-first conversion. Homeowners prefer a phone call at 56%, and 48% now prefer text for scheduling, while contractors lead with email at 90%. Form-based tracking misses the actual conversion moment.
- Referral dominance. Referrals top the lead mix for 95% of companies and 74% of homeowners act on a neighbour or family recommendation - untrackable without asking.
- No repeat purchase. Roofing is largely one-and-done, closing 3-7% of paid leads, so there is no loyalty signal to model and lifetime value is effectively one job plus referrals.
Storm windows: the biggest confound in your dashboard
HailMate’s 2026 storm restoration study - 247 companies, 2,400+ tracked claims, roughly $1.9 billion in restoration revenue and 340+ tracked reps - quantifies the distortion against each company’s own off-season baseline.
| Window after a major storm | Appointment-rate lift | Close-rate lift | Reporting rule |
|---|---|---|---|
| 0-30 days | +210% | +85% | Do not start or judge channel tests |
| 31-90 days | +90% | +40% | Compare only against the same window last cycle |
| Off-season baseline | - | - | The only clean read for creative and channel tests |
| 48-72 hours post-hail | - | - | Paid CPCs rise 30-60%; pause efficiency targets |
The operational implication is that speed of deployment, not channel choice, drives storm-year revenue: a team that takes three weeks to deploy into a fresh swath spends most of the +210% window ramping. The reporting implication is that every roofing dashboard needs a storm-event layer, or the marketing team will take credit for hail and blame themselves for calm.
Funnel benchmarks worth attributing to
Attribution only pays if it reaches the stage where money exists. HailMate’s roofing sales benchmarks give median and top-quartile conversion at each stage, which turns a source report into a diagnosis.
| Funnel stage | Median | Top quartile | What a gap here means |
|---|---|---|---|
| Doors knocked to appointment set | 9% | 16% | Canvassing quality or territory choice |
| Appointment to inspection completed | 71% | 84% | Confirmation and reminder discipline |
| Inspection to signed contract | 58% | 74% | Proposal quality and rep tenure |
| Contract to completed install | 88% | 95% | Scheduling, supplements, cancellations |
| Average job value | $14,600 (median $13,400) | Over $19,200 | Supplementing discipline (+40% per job) |
| Rookie rep inspection-to-contract | 42% (0-90 days) | 68% at 12+ months | Ramp, not talent |
| Revenue per rep | $310,000 (1-5 rep shops) | $510,000 (36+ reps) | Systems, not headcount |
Notice how much of the variance sits after the lead. A shop obsessing over cost per lead while its inspection-to-contract rate sits at 42% is optimising the cheap end of the funnel. Paid roofing leads close at 3-7% overall, so moving close rate by two points beats any lead-price negotiation - the same point our roofing landing page statistics analysis makes about form design.
Call tracking is the highest-yield attribution investment in roofing
Because the conversion is a call, the tracking stack has to start there. Per CallJolt’s 2026 roofing statistics, the average storm-affected homeowner contacts 3.4 contractors, the first to respond books 62% of jobs, call volume spikes 5x-10x post-storm and each missed call is worth $8,000-$15,000. A shop missing 50 calls in a surge loses $400,000-$750,000 in potential bookings.
| Tracking layer | What it recovers | Adoption |
|---|---|---|
| Dynamic number insertion per source | Channel credit for phone conversions | Common but rarely per-campaign |
| Call recording scored for qualification | Lead quality, not just lead count | Uneven |
| CRM as the system of record | Stage-level conversion by source | 45% of roofing firms above $1M revenue |
| Offline conversion upload to ad platforms | Signed-job optimisation signals | 45% of businesses |
| Server-side tracking | 13-27% accuracy improvement | 47% of B2B marketers |
| UTM standardisation | Joinable source data | 63% of teams |
| Text as a tracked channel | 48% of homeowners prefer it | Rare |
Sequence it: numbers and UTMs first, CRM stages second, offline conversion upload third, modelling last. Most roofing companies attempt modelling on unjoinable data. See our roofing analytics statistics breakdown for the measurement layer underneath this, and data intelligence for how we build it.
Cost per signed job: the only number that settles budget arguments
Lead price is meaningless in roofing without close rate and job value. The same $313 lead is excellent or ruinous depending on what happens over the next fourteen days.
| Channel | Cost per lead | Close rate | Implied cost per signed job |
|---|---|---|---|
| Google Ads (roofing) | $313 | 3-7% | $4,471-$10,433 |
| Local Services Ads | ~$222 | 3-7% | $3,171-$7,400 |
| Premium exclusive leads | $343-$449 | Higher, exclusive contact | Often lower per signed job |
| Referral and repeat | Near zero direct cost | 30-50% on qualified leads | Lowest, capacity-limited |
| Canvassing (post-storm) | Labour-based | 9% to appointment, 58% to contract | Ramp-dependent |
Two guardrails. First, hold lead-cost comparisons at the same close rate, or you will move budget toward cheap unqualified volume. Second, the industry benchmark that matters is gross profit per source: with roofing margins at 35-50% and average jobs at $13,700, a $7,400 cost per signed job is a break-even channel, not a winning one.
A 90-day roofing attribution build
| Window | Work | Outcome |
|---|---|---|
| Weeks 1-2 | UTM standard, dynamic call numbers on every source, form and text capture | Every inquiry carries a source |
| Weeks 2-4 | CRM stages mirrored to the funnel: appointment, inspection, contract, install | Stage conversion by source |
| Weeks 4-6 | Call recording scoring for qualification; missed-call alerting | Lead quality separated from volume |
| Weeks 6-8 | Offline conversion upload of signed jobs to ad platforms | Bidding on contracts, not clicks |
| Weeks 8-10 | Storm-event layer on the dashboard with swath dates | Storm-adjusted baselines |
| Weeks 10-12 | One geo holdout test in an off-season window | Incremental, not attributed, lift |
| Quarterly | Gross profit per source review; reallocate on cost per signed job | Budget decisions with evidence |
Skip the modelling platforms until the joins exist. Roofing shops under $250,000 a month in spend get more from clean call tracking, CRM discipline and one honest holdout than from any attribution software - and the roll-up view belongs in the reporting layer described in our roofing digital marketing statistics guide. Get in touch if you want it built once and audited.
Metrics to report every month
- Cost per signed job by source, with gross profit per source alongside it.
- Stage conversion against the 9% / 71% / 58% / 88% medians.
- Share of inquiries with a captured source - the honest denominator for everything else.
- Missed calls and after-hours calls, valued at $8,000-$15,000 each.
- Average job value against $13,400 median and $19,200 top quartile, plus supplement capture rate.
- Storm-adjusted baseline flag on every period comparison.
- Referral share of booked revenue, asked for explicitly at intake rather than inferred.
Frequently Asked Questions
Why is marketing attribution so hard for roofing companies?
Four structural reasons. Demand is storm-pulsed, so a spend increase and a hail event can look identical in a dashboard. Conversions happen by phone, and 48% of homeowners now prefer text, so most touches never hit a form. Referrals are the top lead source for 95% of roofing companies and are largely untracked dark social - estimated at 40 to 60% of buying influence in general. And the purchase repeats roughly once a generation, so there is no repeat-purchase signal to learn from.
Which attribution model should a roofing contractor use?
Use a first-touch or position-based model inside the CRM as the operating view, and validate it against holdouts and storm-adjusted baselines. Across industries 76% of marketers now use multi-touch attribution, yet only 33% of marketing leaders call their attribution mostly accurate and 44% still default to last-touch. In roofing, last-click systematically over-credits branded search: one 2026 comparison found branded paid search received 28% of credit under multi-touch, 9% under media-mix modelling and only 4% in incrementality tests.
What should a roofing company actually measure?
Seven joins, in order: source and campaign on every call and form, contact rate, appointment set, inspection completed, signed contract, collected revenue and gross profit per source. Median funnel benchmarks are 9% doors to appointment, 71% appointment to inspection, 58% inspection to contract and 88% contract to install, with top quartiles at 16%, 84%, 74% and 95%. Cost per signed job, not cost per lead, is the decision metric.
How much do storms distort roofing marketing reporting?
Enormously. In the first 30 days after a major storm, appointment rates run about +210% and close rates about +85% over off-season baseline; at 31 to 90 days it is +90% and +40%. Any channel test that straddles a hail event is unreadable, and post-storm CPCs can rise 30 to 60% within 48 to 72 hours. Always report a storm-adjusted baseline and note the swath date on the dashboard.
Does call tracking matter more than pixels in roofing?
Yes. Roofing conversion is a phone call, homeowners contact 3.4 contractors after a storm, and the first responder books 62% of jobs. Post-storm call volume spikes 5x to 10x and each missed call carries $8,000 to $15,000 in potential revenue. Dynamic number insertion on every source, plus recordings scored for qualification, recovers the largest share of missing attribution data in this industry - and only 45% of businesses send offline sales data back to ad platforms.
Sources
AM World Group - Marketing Attribution Statistics 2026
Marketing LTB - Marketing Attribution Statistics
Presenc - AI vs Traditional Attribution Accuracy Study
HailMate - State of Storm Restoration 2026
HailMate - Roofing Sales Benchmarks 2026
CallJolt - Roofing Industry Statistics 2026
GetX Media - 2026 Roofing Marketing Benchmarks
Contractor Marketing Pros - JobNimbus Peak Performance 2026 roofing data
Roofing Contractor - The Homeowner's Roofing Journey in 2026
GrowwithBA - The Attribution Crisis: 150-brand study 2026