



Table of contents

No published dataset benchmarks connected TV for roofing contractors, so this report reads roofing CTV through two lenses: where hail actually hit roofs in 2025, and what cross-industry CTV data says about reach, cost and traffic quality. Every figure is tied to its issuer and year.
Key Takeaways
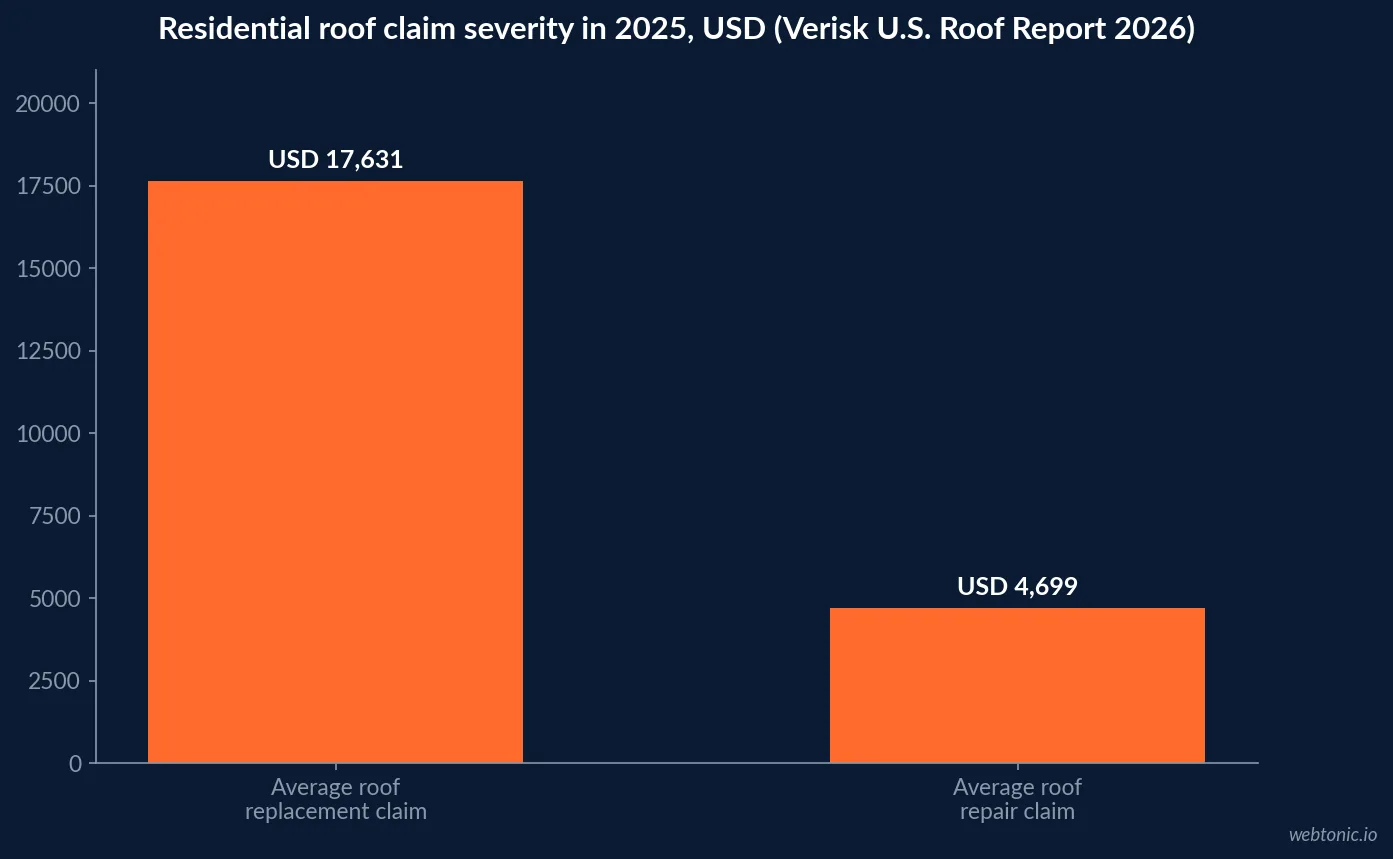
- Average roof replacement claims reached USD 17,631 in 2025 (Verisk).
- Average roof repair claims reached USD 4,699 in 2025.
- Replacement severity ran about 33% above the 2021-2024 average.
- 16 states saw severe hail on more than 20% of roofs in 2025, up from 12 in 2024.
- In hail states, 57% of residential roofs are nine years old or newer, against 38% elsewhere.
- Streaming took 49.0% of US TV time in July 2026 (Nielsen).
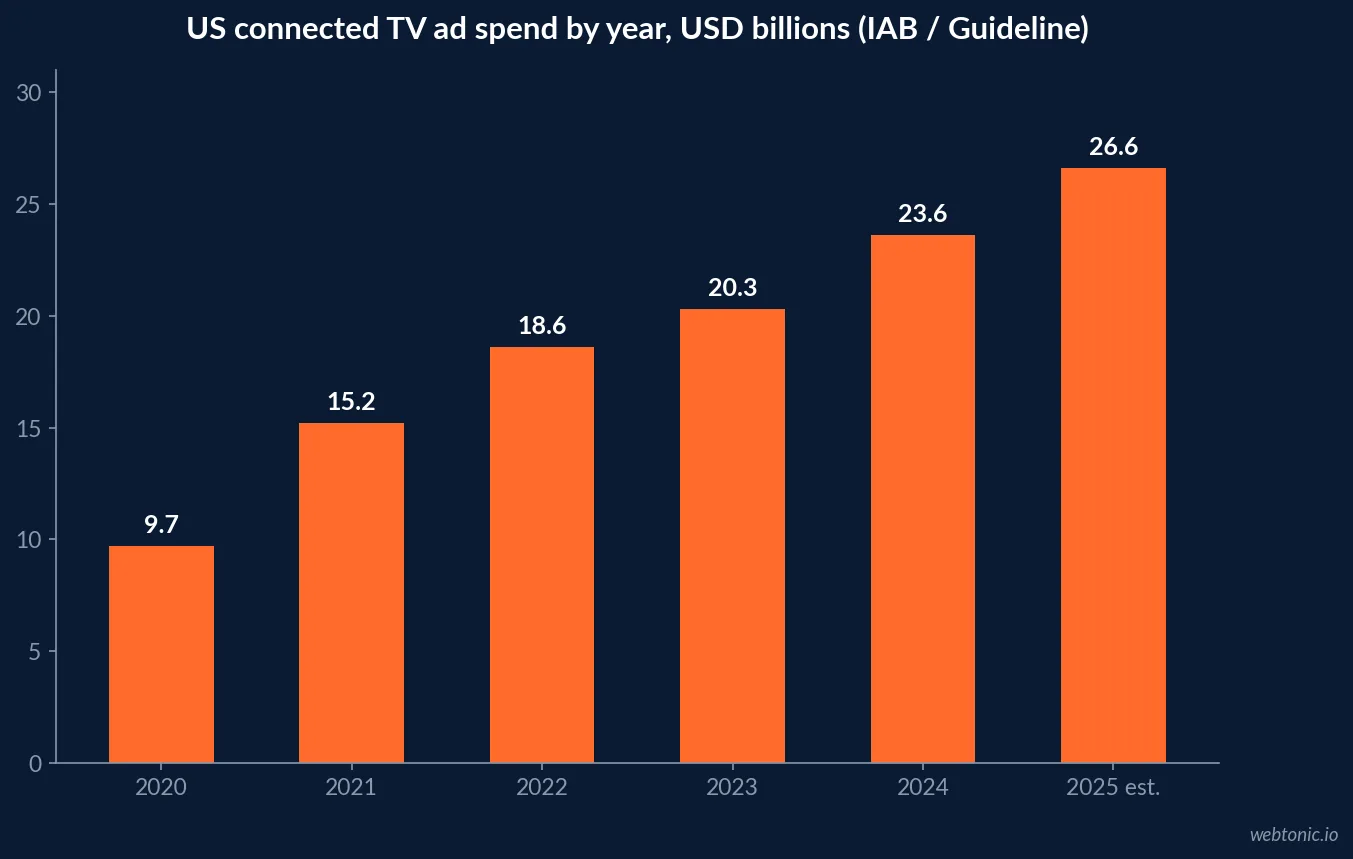
- US CTV ad spend was estimated at USD 26.6 billion for 2025 (IAB).
- 18% of US open programmatic CTV traffic was invalid in Q3 2025 (Pixalate).
- Roku's self-serve floor is a USD 500 lifetime budget.
Roofing CTV benchmarks at a glance
The table separates the two kinds of evidence on this page. Rows marked roofing come from Verisk's 2026 U.S. Roof Report; rows marked cross-industry come from CTV datasets that do not break out home services at all.
| Metric | Figure | Scope | Issuer and period |
|---|---|---|---|
| Average roof replacement claim | USD 17,631 | Roofing (insurance claims) | Verisk, 2025 |
| Average roof repair claim | USD 4,699 | Roofing (insurance claims) | Verisk, 2025 |
| States with severe hail on 20%+ of roofs | 16 (12 in 2024) | Roofing (weather analytics) | Verisk, 2025 |
| Streaming share of US TV time | 49.0% | Cross-industry | Nielsen The Gauge, July 2026 |
| US CTV ad spend | USD 26.6 billion | Cross-industry | IAB / Guideline, 2025 estimate |
| Invalid traffic, US open programmatic CTV | 18% | Cross-industry | Pixalate, Q3 2025 |
What a single roofing job is worth
TV reach only pays when the purchase behind it is large. Verisk reports that average residential roof replacement costs reached USD 17,631 in 2025 and repairs averaged USD 4,699, roughly 33% and 25% above the 2021-2024 averages. Residential roof replacement cost value fell to USD 23 billion in 2025 against a four-year average of USD 24.4 billion, a dip Verisk ties to a quiet hurricane season, even as overall claims volume fell by nearly 20%.
Verisk also says roofing line items make up around 30% of all line items in property claims estimates. For a contractor, that means the roof is usually the biggest single ticket after a storm, which is the demand condition that justifies testing a broad-reach channel.
Where hail hit roofs in 2025
Storm geography decides where a roofing TV flight belongs. Verisk's Respond data put 2025 severe hail - one inch or larger - mainly in the Central Plains, with Arkansas, Kansas, Nebraska, Oklahoma and South Dakota among the top states by share of roofs hit. Sixteen states had severe hail on more than 20% of roofs, up from twelve in 2024.
Verisk adds that giant hail of two inches or more follows fairly stable geographic patterns year to year, while large hail of one to two inches swings widely at metro level, with hundreds of local markets seeing meaningful increases. That volatility is the case for buying CTV by ZIP code or designated market area rather than nationally.
| Roof and hail indicator (Verisk) | Figure | Planning read-out |
|---|---|---|
| Roofs nine years old or newer, hail states | 57% | Faster replacement cycles, repeat demand |
| Roofs nine years old or newer, non-hail states | 38% | Slower cycle, older stock |
| Roofs 31+ years old, Northeast | 18% | Age-driven rather than storm-driven demand |
| Roofs 31+ years old, Midwest | 17% | Mixed storm and age demand |
| Roofs 31+ years old, South | 4% | Younger stock, storm-led demand |
| Loss cost, moderate-to-poor vs good roofs | About 60% higher | Condition shapes claim likelihood |
Streaming share through the storm calendar
Hail season runs through spring and summer, and so does streaming's annual climb. Nielsen's January 2026 Gauge put streaming at 47.0% of TV time, the May 2026 report at 48.6%, and the July 2026 report at 49.0%, with YouTube alone reaching a record 14.2%. In July, broadcast held 19.5% and cable 18.7%.
These are all-household viewing shares. Nielsen does not publish viewing for homeowners or for people who have just filed a roof claim, so treat the numbers as where attention sits, not as a response rate.
| Gauge month | Streaming share of TV | Season for roofers |
|---|---|---|
| January 2026 | 47.0% | Off season in most hail states |
| May 2026 | 48.6% | Peak severe-hail months begin |
| July 2026 | 49.0% | Summer storms, claims still open |
| July 2026, YouTube alone | 14.2% | Largest single distributor |
| July 2026, broadcast / cable | 19.5% / 18.7% | Linear still near two-fifths combined |
How much money is moving into CTV
The IAB 2025 Digital Video Ad Spend report, built on Guideline estimates, shows US CTV ad spend rising from USD 9.7 billion in 2020 to USD 23.6 billion in 2024 and an estimated USD 26.6 billion in 2025, 43% larger than online video. In May 2026 the IAB projected total US digital video spend above USD 80 billion for 2026, with CTV growing 11% and social video 13%.
None of that spend is split out for home services. It shows the channel's scale and that local advertisers now compete in the same auctions as national brands.
Buying the storm path, not the country
CTV sells by household and geography, which suits a trade that follows the weather. The practical questions are how small a geography the platform will serve and how often it repeats an ad. Innovid's CTV Advertising Insights Report 2024 found an average frequency of 7.42 across its CTV campaigns and 87% unique reach for campaigns using five or fewer publishers.
Read those as cross-industry reference points. A storm-zone flight covers a small area, so frequency climbs quickly; capping it and keeping the publisher list short are the two levers the published data supports.
Entry budgets for a first hail-season test
Roku's Ads Manager help centre states that lifetime budgets are required on every campaign and must be USD 500 or more, and its cost guide says USD 500 to 1,000 is enough for most first-time advertisers. MNTN (vendor) says small businesses can run for as little as USD 2,000. Amazon Ads lists a USD 10K recommended minimum for self-service streaming TV and USD 50K for managed service.
| Platform (own page) | Published entry point | What it suits |
|---|---|---|
| Roku Ads Manager | USD 500 lifetime budget | One-metro storm test |
| Roku first-campaign guidance | USD 500-1,000 | Learning which audiences respond |
| MNTN Performance TV (vendor) | USD 2,000 | Small multi-ZIP flight |
| Amazon streaming TV, self-service | USD 10K recommended | Multi-state roofing brand |
| Amazon streaming TV, managed | USD 50K minimum | Regional storm-season push |
What streaming inventory costs against linear
Tatari, a TV buying vendor, analysed its client data from 2019 to 2023 and found streaming CPMs typically three to four times linear, about USD 9.50 against USD 2.50. It adds that its streaming rates sit below market because of direct publisher deals, often 66% lower than buying programmatically. That makes USD 9.50 a direct-buy reference from one vendor, not a roofing CPM.
The trade-off for a roofer is precision against price: linear reaches a whole market cheaply, while streaming can be restricted to the ZIP codes a storm actually crossed.
Invalid traffic and the storm-season auction
Pixalate's Q3 2025 North America benchmarks put invalid traffic at 18% of US open programmatic CTV, the lowest CTV rate among the countries it measured. Pixalate is a fraud-detection vendor and the figure covers open programmatic supply only. A roofing flight bought through open exchanges should still ask for invalid-traffic filtering and a report of it.
What the national data cannot tell a roofer
It helps to be explicit about the gaps. Every CTV number on this page is either national, cross-industry or vendor-reported, and several metrics a roofing owner would want simply are not published by anyone. Knowing which is which stops a plan from resting on a figure that was never measured for the trade.
The table lists the metrics roofers most often ask about, whether a roofing-specific version exists, and where a usable number can actually come from. Where the answer is your own data, the fix is a clean test design with a holdout area, not a better benchmark.
| Metric a roofer asks for | Roofing-specific figure published? | Best available evidence |
|---|---|---|
| CTV CPM for roofing | No | Platform quotes for your ZIP codes; Tatari's USD 9.50 is a vendor reference |
| Completion rate for roofing spots | No | Ad-server reports on your own flight |
| Cost per inspection lead from CTV | No | Exposed versus holdout ZIP comparison |
| Where storm demand will be | Partly | Verisk hail and roof-age data by state |
| Share of homeowners streaming | No | Nielsen all-household share, 49.0% in July 2026 |
| Fraud exposure on your buy | No | Pixalate cross-industry 18% plus your vendor's IVT report |
Measuring a roofing CTV flight honestly
Because no roofing benchmark exists, the only valid comparison is your own baseline. Compare inspection requests, branded search and site visits from exposed ZIP codes against similar unexposed ones over the same storm window. Completion rate alone says little: CTV ads are largely non-skippable, so high completion confirms delivery, not interest.
Our data intelligence team builds that holdout design, and our performance creative team cuts TV-ready spots from existing footage. For the wider channel picture, see our connected TV advertising statistics hub and the roofing SMS marketing statistics for post-storm follow-up.
| Storm-season plan step | Published anchor | Source |
|---|---|---|
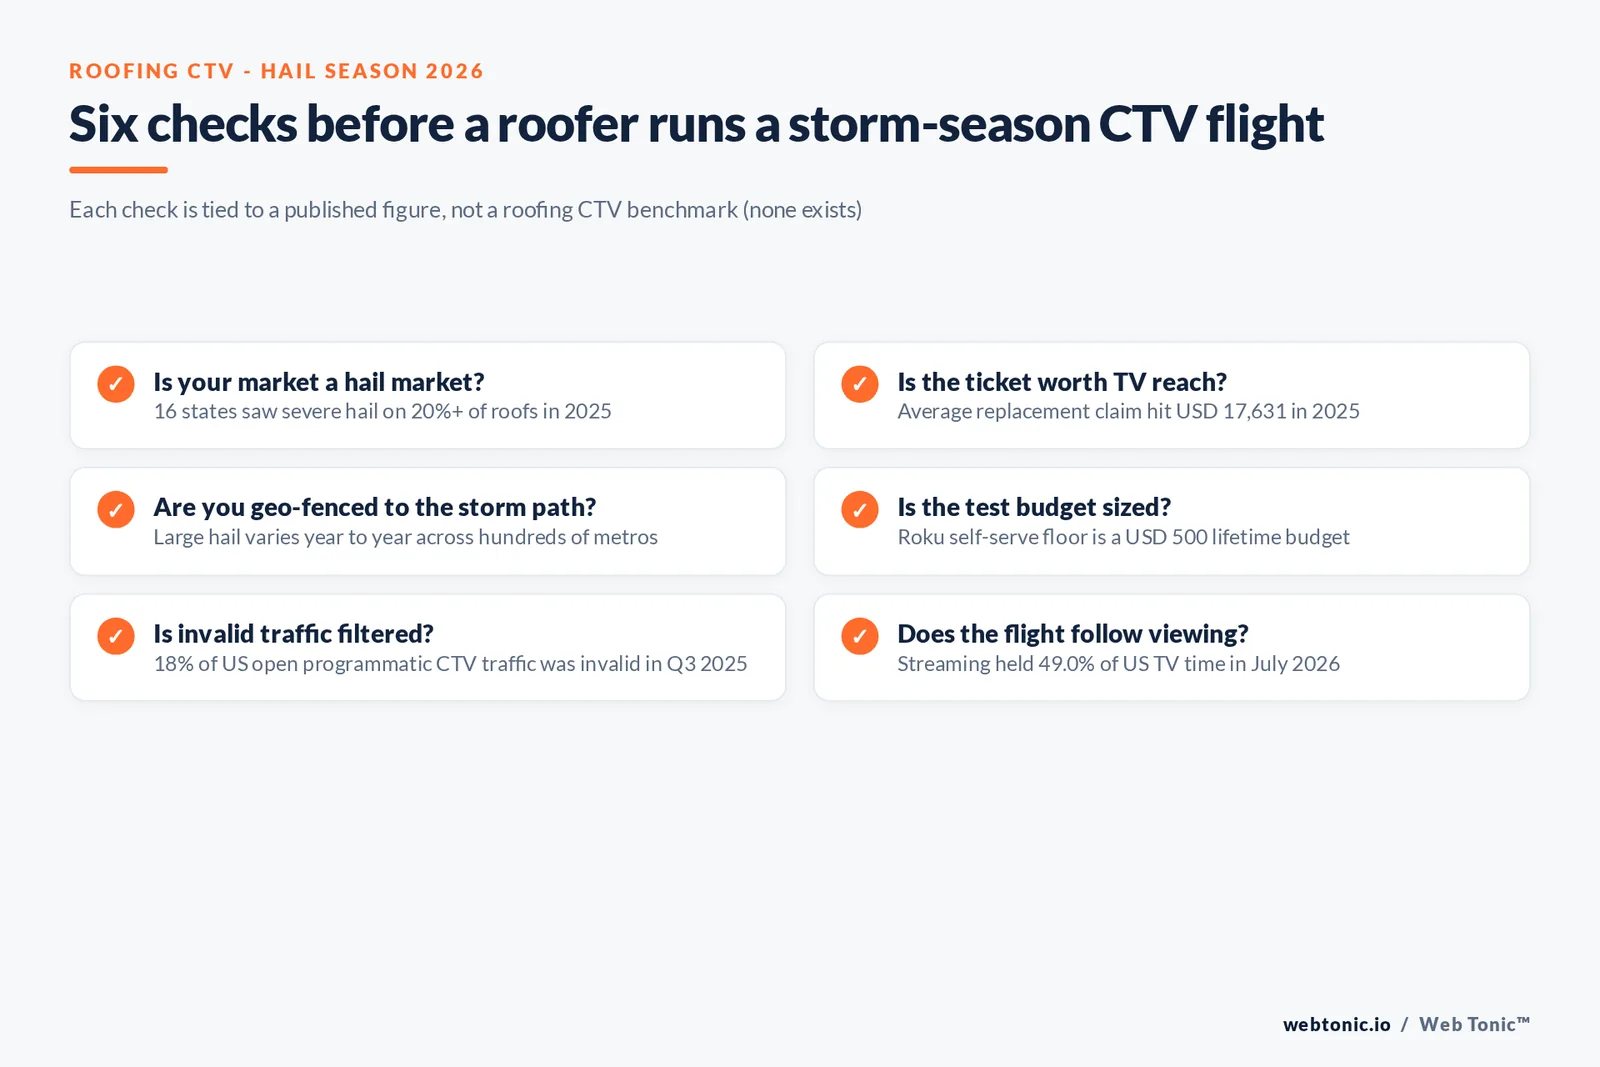
| Pick markets by hail exposure | 16 states above 20% of roofs hit | Verisk 2025 |
| Size the job value | USD 17,631 average replacement | Verisk 2025 |
| Time the flight | Streaming 48.6% in May, 49.0% in July | Nielsen 2026 |
| Set a first budget | USD 500 lifetime minimum | Roku |
| Control frequency | 7.42 average CTV frequency | Innovid 2023 data |
| Protect spend | 18% invalid, US open programmatic | Pixalate Q3 2025 |
Frequently Asked Questions
Is there a CTV benchmark for roofing companies?
No. None of the major CTV datasets - Nielsen, IAB, Innovid, Pixalate or Tatari - publishes a roofing-specific CPM, completion rate, cost per lead or return figure. Any roofing CTV number you see quoted without a named dataset is an estimate. This page uses cross-industry CTV data, clearly labelled, alongside Verisk's roof and hail data for the demand side.
When should a roofer run connected TV ads?
The published data points to the months after severe hail in your own metro. Verisk found severe hail in 2025 concentrated in the Central Plains, with 16 states seeing severe hail on more than 20% of roofs. Streaming's share of TV time also rises into summer, from 47.0% in January 2026 to 49.0% in July 2026 per Nielsen, so a storm-season flight lands when streaming viewing is near its annual high.
How much does it cost for a roofer to start on CTV?
Platform floors are public. Roku Ads Manager requires a lifetime budget of USD 500 or more per campaign, MNTN advertises entry from USD 2,000, and Amazon recommends USD 10,000 for self-service streaming TV and USD 50,000 for managed service. These are entry points set by the platforms, not roofing prices.
How much CTV traffic is fraudulent?
Pixalate measured 18% invalid traffic on US open programmatic CTV in Q3 2025, the lowest CTV rate among the countries in its North America report. That is a cross-industry figure for open programmatic supply; direct publisher buys and vetted marketplaces usually carry less exposure.
Why does roof claim data matter for a TV plan?
Because it sizes the job a single viewer can turn into. Verisk put the average residential roof replacement claim at USD 17,631 in 2025 and the average repair at USD 4,699. A high-ticket, storm-driven purchase is the kind of demand where broad household reach in a defined area can make sense, provided you can measure it.
Sources
Verisk - 2026 U.S. Roof Report press release
Nielsen - The Gauge, July 2026
Nielsen - The Gauge, May 2026
Nielsen - The Gauge, January 2026
IAB - 2025 Digital Video Ad Spend report
IAB - US digital video ad spend to surpass USD 80B in 2026
Innovid - CTV Advertising Insights Report 2024
Pixalate - Q3 2025 North America IVT benchmarks
Roku Ads Manager - campaign budget and schedule
Amazon Ads - Streaming TV ads
MNTN - Go Big small-business program
Tatari - What is driving down linear CPMs


