



Table of contents
Addiction treatment landing pages convert at a median of 5.2%, but top-performing pages reach 12–16% — a 3× gap that represents thousands of missed admission inquiries per year for the average treatment center.
Key Takeaways
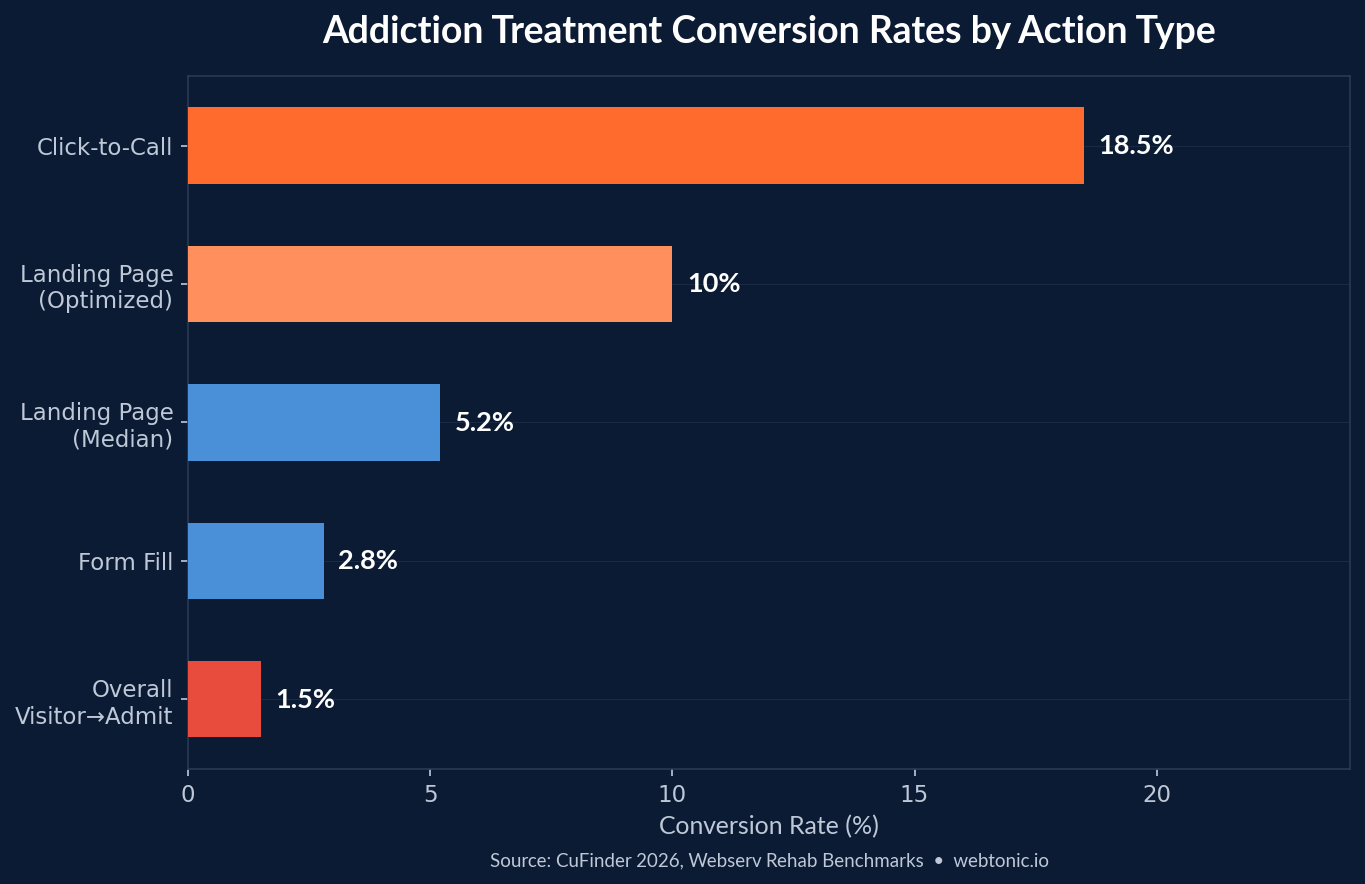
- Landing page conversion rate for addiction treatment is 5.2% median, with click-to-call at 18.5% and form fill at 2.8% (CuFinder, 2026).
- Optimized treatment center landing pages convert at 6–12% on paid search traffic, compared to 3% for the industry average (Webserv, 2026).
- 70–85% of treatment center landing page traffic arrives on mobile, making mobile-first design non-negotiable (Webserv, 2026).
- Phone-primary landing pages convert at 2–3× the rate of form-primary pages on Meta paid social traffic (Webserv, 2026).
- Two-step VOB forms outperform single-step 8-field forms by 30–50% on completion rate (Webserv, 2026).
- Patient acquisition cost for behavioral health ranges from $2,500 to $5,000, the highest of any healthcare specialty (FoundryCRO, 2026).
Rehab Landing Page Benchmarks at a Glance
| Metric | Benchmark | Source |
|---|---|---|
| Landing page CVR (median) | 5.2% | CuFinder 2026 |
| Click-to-call CVR | 18.5% | CuFinder 2026 |
| Form fill CVR | 2.8% | CuFinder 2026 |
| Optimized LP CVR (paid search) | 6–12% | Webserv 2026 |
| Top-performer LP CVR | 12–16% | Webserv 2026 |
| Mobile traffic share | 70–85% | Webserv 2026 |
| Bounce rate (industry avg) | 64.5% | CuFinder 2026 |
| Avg. time on page | 2 min 45 sec | CuFinder 2026 |
| Pages per session | 2.8 | CuFinder 2026 |
| LCP target (mobile) | 1.8–2.2 sec | Webserv 2026 |
| Cost per admission | $3,500–$5,000 | CuFinder 2026 |
| Patient acquisition cost (BH) | $2,500 | FoundryCRO 2026 |
Conversion Rate Statistics by Traffic Source
Conversion rate benchmarks vary significantly depending on the traffic source. Paid search visitors arrive with high intent, while organic and social traffic require more trust-building before converting.
- Paid search landing pages convert at 6–12% when properly optimized, compared to 3–6% for the average treatment center page (Webserv, 2026).
- Branded traffic converts at 2–3× the rate of non-branded traffic, with branded visitors already past the awareness stage (Webserv, 2026).
- Organic traffic landing pages convert at lower rates (3–5%) but produce leads with a 14.6% close rate but produce leads with a 14.6% close rate — nearly double the paid search close rate (Promodo, 2026).
- Meta/Facebook paid social traffic converts at lower rates on form-primary pages but responds 2–3× better on phone-primary landing pages (Webserv, 2026).
- Realistic treatment center website conversion rates range from 3% to 8%, with phone calls converting at 40–60% higher rates than form fills (Netvisits, 2026).
- The general healthcare landing page median is 3.80%, but addiction treatment outperforms due to higher urgency (Benchmarketing, 2026).
Conversion Rate by Program Type
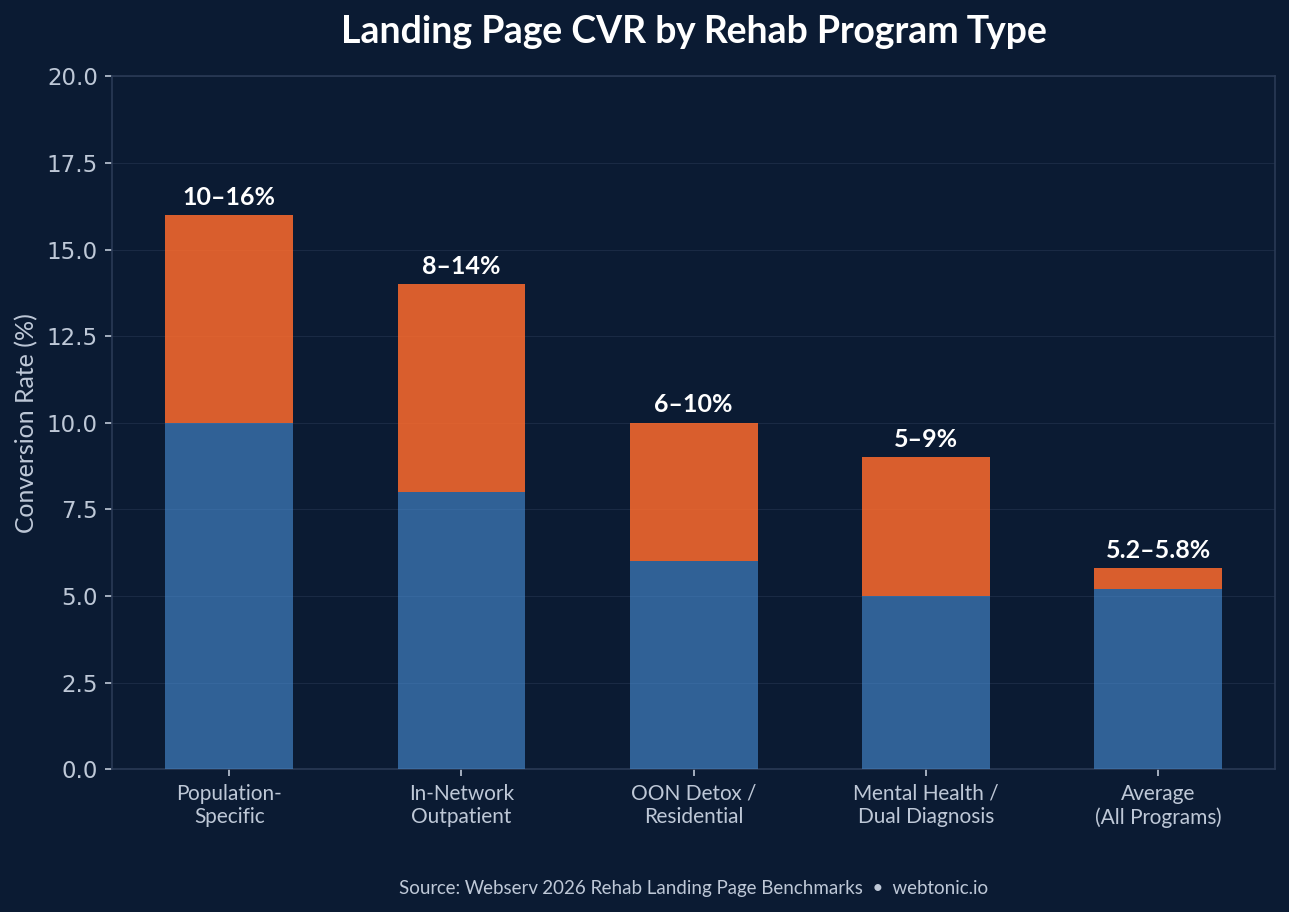
| Program Type | CVR Range | Key Driver |
|---|---|---|
| Out-of-network detox/residential | 6–10% | High urgency, insurance pre-verification |
| In-network local outpatient | 8–14% | Lower barrier, local intent |
| Population-specific (veteran, executive) | 10–16% | Matched audience targeting |
| Mental health / dual diagnosis | 5–9% | Complex decision, longer research cycle |
| Average across all programs | 5.2–5.8% | Blended across modalities |
Mobile Optimization and Page Speed Statistics
With 70–85% of addiction treatment traffic arriving on mobile devices, page speed and mobile experience directly control whether a prospect converts or bounces.
- 70–85% of treatment center landing page traffic arrives on mobile devices, with the share climbing past 80% for "near me" and late-night searches (Webserv, 2026).
- The realistic LCP target for treatment center sites is 1.8–2.2 seconds at the 75th percentile on mobile; 2.5 seconds is the minimum threshold (Webserv, 2026).
- Family members researching treatment at 11 PM are on their phones — every design decision should be tested on mobile first, not adapted from desktop (Webserv, 2026).
- 60%+ of conversions in the addiction treatment vertical come from mobile, despite desktop showing higher per-session conversion rates (RehabGrowth, 2026).
- INP (Interaction to Next Paint) under 200ms is the new Core Web Vitals target that affects both user experience and Google ranking signals (Webserv, 2026).
- Sites with LCP under 2 seconds see materially better ranking signals and user experience scores than those at the 2.5-second threshold (Webserv, 2026).
Form Design and CTA Statistics
The structure of landing page forms and calls-to-action determines whether high-intent visitors convert or abandon the page. HIPAA compliance adds a layer of complexity that most conversion optimization guides ignore.
- Two-step VOB forms outperform single-step 8-field forms by 30–50% on completion rate — 4 fields above the fold, 4 more after a "verify now" click (Webserv, 2026).
- Click-to-call CTAs convert at 18.5% compared to 2.8% for form fills, making phone the dominant action on addiction treatment landing pages (CuFinder, 2026).
- Landing pages that lead with family-decision-maker language outperform patient-direct language on conversion lift (CaptivContent, A/B test across 14 treatment centers).
- HIPAA-compliant forms with clear privacy disclaimers do not reduce conversion rates — transparent data-use language actually lowers bounce rates (ConversionTeam, 2026).
- Insurance verification widgets placed above the fold reduce the number of unqualified calls and increase VOB completion rates (Webserv, 2026).
- Strategic form testing increased patient signups by 29.7% (from 2.17% to 2.81% CVR) in a controlled healthcare case study (ConversionTeam, 2026).
- Sticky mobile call buttons combined with sub-2-second LCP produce the highest conversion combination on mobile treatment center pages (Webserv, 2026).
Addiction Treatment vs. Other Industries: Landing Page Conversion
| Industry | Median LP CVR | Top 10% CVR | Patient/Customer Acq. Cost |
|---|---|---|---|
| Addiction Treatment | 5.2% | 12–16% | $2,500–$5,000 |
| General Healthcare | 3.80% | 12.4% | $155–$2,500 |
| Dental | 5.6% | ~14% | $150–$350 |
| Hospitals (service-specific) | 6.1% | ~15% | $300–$800 |
| All Industries Median | 2.35% | ~11% | Varies |
Admissions Funnel Conversion Statistics
The gap between a landing page visitor and an admitted patient is a multi-stage funnel. Understanding conversion rates at each stage is critical for diagnosing where prospects drop off and where optimization investments will produce the highest ROI.
| Funnel Stage | Average Rate | Top Performer |
|---|---|---|
| Visitor → initial inquiry (call/form) | 4.8% | 8–12% |
| Initial → qualified (admissions-screened) | 58% | 70–75% |
| Qualified → VOB completed | ~60% | 75–80% |
| VOB → admitted | ~35% | 45–55% |
| Overall visitor → admit | 1–2% | 3–5% |
| Lead-to-admission rate | 3–8% | 8–15% |
- For every 100 unique site visitors, 4.8 convert into form submissions or calls, of which 58% are reached and qualified — producing 2.8 qualified leads per 100 visitors (CaptivContent, 2026).
- Moving landing page conversion from 2% to 3% (a 50% relative lift) reduces cost per admit by 33% when other funnel gates remain constant (Webserv, 2026).
- Lead-to-admission rates range from 3–8% average to 8–15% for top performers, with the gap driven primarily by response time and intake team performance (Netvisits, 2026).
- Speed-to-lead is the highest-leverage variable — responding to initial inquiries in under 10 minutes for callbacks and under 5 minutes for form follow-ups significantly increases qualification rates (Webserv, 2026).
- Cost per admission ranges from $2,500–$8,000 average to $1,200–$3,500 for top performers, with landing page optimization being the single largest driver of improvement (Netvisits, 2026).
- 60–75% of admission inquiries arrive by phone — a form-only A/B test ignores the channel producing most of the revenue (Webserv, 2026).
Core Web Vitals Statistics for Treatment Centers
Core Web Vitals directly impact both search rankings and user experience on landing pages. Treatment center sites face unique challenges because of heavy hero images, embedded insurance verification widgets, and HIPAA-compliant tracking scripts.
- The realistic LCP target for treatment center sites is 1.8–2.2 seconds at the 75th percentile on mobile (Webserv, 2026).
- INP (Interaction to Next Paint) under 200ms is the Core Web Vitals interaction threshold that affects both ranking signal and user perception of responsiveness (Webserv, 2026).
- CLS (Cumulative Layout Shift) must stay under 0.1 — insurance verification widgets and chat overlays are the most common CLS offenders on treatment center pages (Webserv, 2026).
- Healthcare websites underperform general industry CWV benchmarks due to heavier page weight from compliance scripts, hero imagery, and embedded third-party widgets (Webserv, 2026).
- A 60-day optimization sequence (image compression → render-blocking removal → lazy loading → script deferral) is the recommended approach for treatment centers (Webserv, 2026).
- CWV improvements compound with E-E-A-T signals, schema markup, and AI search optimization — fixing page speed alone delivers partial results, but the combination multiplies organic visibility (Webserv, 2026).
Best Practices for Rehab Landing Pages
- Design mobile-first with a sticky call button — 70–85% of traffic is mobile, and the family member researching at midnight needs one tap to connect — a principle central to any growth marketing strategy.
- Lead with a confidentiality statement above the fold — privacy fears are the #1 conversion barrier in addiction treatment. State "Your call is private and confidential" before asking for any information.
- Use a two-step VOB form with 4 fields visible initially (name, phone, insurance carrier, substance) and expand on click — this structure outperforms 8-field forms by 30–50%.
- Place insurance verification widgets above the fold to pre-qualify visitors and reduce unqualified call volume.
- Write for the family decision-maker, not the clinical audience — A/B tests show family-facing language outperforms patient-direct copy on form completion rates.
- Hit LCP under 2 seconds on mobile by lazy-loading below-fold images, using next-gen formats (WebP/AVIF), and minimizing render-blocking scripts.
- Include HIPAA compliance badges and encryption indicators on forms — transparent data-use language reduces bounce rates, not conversions.
- Track three conversion tiers separately: initial (call + form), qualified (admissions-screened), and admit (verified-policy through to intake).
Related reading
- Rehab & Addiction Treatment Shopify Statistics (2026)
- Rehab & Addiction Treatment WordPress Statistics (2026)
- 47 Statistics Shaping Webflow in Rehab & Addiction Treatment (2026)
- Landing Page Design services at Web Tonic
Frequently Asked Questions
What is a good conversion rate for a rehab landing page?
A good conversion rate for a drug rehab landing page is 8% or higher on paid search traffic. The industry median sits at 5.2%, but treatment centers with optimized pages reach 12–16%. The benchmark varies by program type: in-network outpatient pages convert at 8–14%, while out-of-network residential pages convert at 6–10%. Population-specific pages (veteran, executive, adolescent) targeting matched audiences can reach 10–16%.
Should rehab landing pages prioritize phone calls or form fills?
Phone calls, overwhelmingly. Click-to-call converts at 18.5% versus 2.8% for form fills in the addiction treatment vertical. Roughly 60–75% of all admission inquiries arrive by phone. Phone-primary pages convert at 2–3× the rate of form-primary pages on Meta social traffic. The recommended approach is a hybrid: sticky call button on mobile with a secondary two-step VOB form for visitors who prefer written contact.
How does mobile optimization affect rehab landing page performance?
Mobile optimization directly controls conversion outcomes because 70–85% of treatment center traffic arrives on mobile devices. Pages with LCP under 2 seconds on mobile see materially higher conversion rates. Over 60% of actual conversions come from mobile devices. The combination of a sticky call button, sub-2-second load time, and a simplified above-the-fold hero section produces the highest conversion rates across behavioral health landing pages.
What landing page elements increase trust for addiction treatment visitors?
The highest-impact trust elements are: confidentiality statements above the fold, HIPAA compliance badges on forms, LegitScript certification logos, accreditation badges (CARF, Joint Commission), staff credentials with photos, and real patient testimonials with consent. Landing pages that lead with family-decision-maker language outperform patient-direct pages on conversion lift, based on A/B tests across 14 treatment centers.
How much does patient acquisition cost through landing pages?
Patient acquisition cost for behavioral health is $2,500 to $5,000, the highest of any healthcare specialty. The cost breaks down into stages: average CPL of $285 on Google Ads, with only 58% of leads qualifying after the admissions screen, and a 3–15% lead-to-admission rate depending on page quality. Top-performing pages cut cost per admission to $1,200–$3,500, while average pages run $2,500–$8,000 (Netvisits, 2026).
Sources
cufinder.io/blog/benchmarks/addiction-treatment
webserv.io — Rehab Landing Page Conversion Rate Benchmarks
webserv.io — Landing Page Optimization for Addiction Treatment
webserv.io — Core Web Vitals Benchmarks for Treatment Centers
foundrycro.com — Healthcare Marketing Benchmarks 2026
benchmarketing.org — Addiction Treatment Benchmarks 2026
conversionteam.com — Form Testing Case Study
netvisits.com — Treatment Center Conversion Benchmarks 2026
nida.nih.gov — Trends & Statistics


