Table of contents
A pool builder's website is a photo gallery pretending to be a sales tool - which makes technical SEO less of an IT chore than a lead-generation lever. With 68.5% of pool website sessions on mobile and organic search supplying about 48% of traffic, the load time of your finished-build gallery is a revenue number.
Key Takeaways
- Only 42% of websites pass all three Core Web Vitals, and 34% of crawled URLs fail at least one threshold.
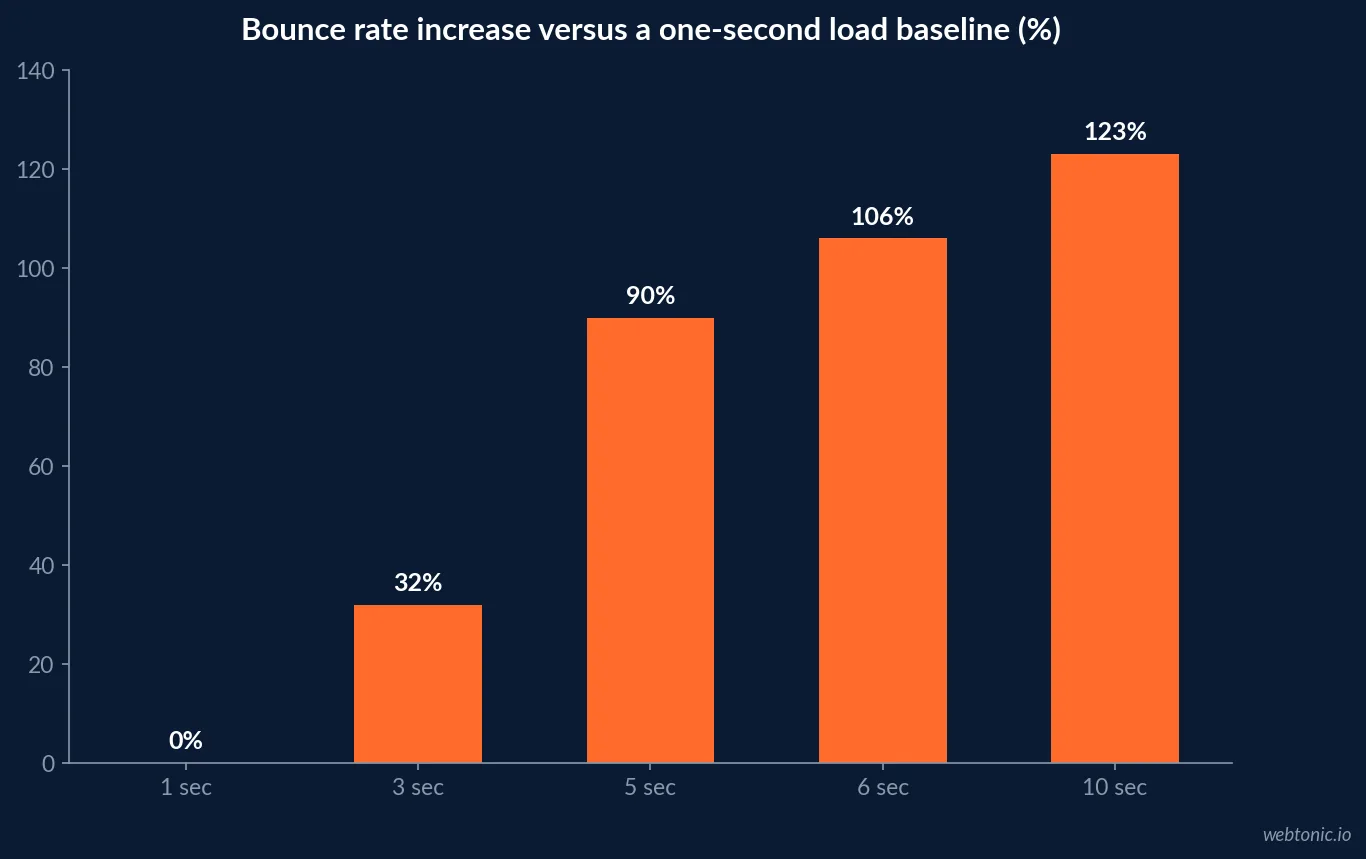
- Every extra second of load time costs roughly 7% of conversions and adds about 11% to bounce rate; bounce rises 32% at three seconds and 90% at five.
- Pool sites average a 52.4% bounce rate and a 3.2% conversion rate, versus 5.8% for top performers.
- Median load time of a Google top-ten result is 1.65 seconds; the average web page is now 2.3 MB, up 18% since 2023.
- Only 39% of all sites use any structured data; in a 5,000-site audit 71% deployed schema but just 22% passed the Rich Results Test cleanly.
- FAQ schema is linked to ~87% more clicks, Review schema to ~35% higher CTR and Product schema to ~25% more clicks.
- Crawl waste averages 30-40% on unmanaged sites, and only 45.9% of global crawler requests return a 200.
- AI crawlers now generate 35.6% of bot traffic versus 26.2% for classic search engines - technical health is now an AI-visibility input too.
Pool website benchmarks at a glance
Start with what a pool company's own analytics typically look like, because that is what the technical work has to move.
| Metric | 2026 pool industry benchmark | Technical implication |
|---|---|---|
| Mobile share of sessions | 68.5% | Every decision is a mobile decision |
| Desktop / tablet share | 27.0% / 4.5% | Desktop is the minority experience |
| Average bounce rate | 52.4% | Above 60% usually means speed, not traffic quality |
| Website conversion rate | 3.2% average | Top performers reach 5.8% |
| Organic share of traffic | 48% globally, 42% in the US | Technical SEO protects the largest channel |
| Paid search share | 16% globally, 24% in the US | Slow pages inflate paid CPA as well |
| New vs returning visitors | 72% new / 28% returning | First impressions decide almost everything |
| Google Ads CPC, construction terms | $7.50 - $11.00 | A bounced paid click is a $10 loss |
| Lead-to-sale, construction | 8% - 12% | Small conversion gains compound through a long cycle |
Those figures come from 2026 swimming pool industry benchmarks. The uncomfortable part is the 72% new visitor share: most people who ever see your site see it once, on a phone, probably on cellular data, while comparing you with two other builders.
Core Web Vitals: where pool sites fail
The three thresholds have not moved. What has changed is how clearly the field data points at images.
| Metric | Good threshold | Phone field p75 (2026) | Share rated good | Pool-site risk |
|---|---|---|---|---|
| LCP | under 2.5 s | 2,209 ms | 81.7% | High - hero and gallery imagery |
| INP | under 200 ms | 128 ms | 91.9% | Low - unless heavy quote calculators |
| CLS | under 0.1 | 0.02 | 88.8% | Medium - lazy-loaded galleries and review widgets |
| All three combined | Pass all | - | ~42% of sites | Gallery-heavy builds fail on LCP first |
Field outcomes across roughly 200,000 sites show INP and CLS largely solved and LCP still the common failure point - which is exactly the metric a 4,000-pixel-wide photo of a gunite shell destroys. Aggregate 2026 crawl data puts 34% of crawled URLs in breach of at least one threshold.
The conversion arithmetic of one extra second
Speed work is easier to fund when it is framed as lead volume rather than a score out of 100.
| Load time | Bounce increase vs 1 s | Estimated conversion effect | What it means at 3.2% baseline |
|---|---|---|---|
| 1 second | Baseline | Baseline | 3.2% - top-decile experience |
| 2 seconds | Modest | About -7% | ~2.98% conversion |
| 3 seconds | +32% | About -14% | ~2.75% conversion |
| 5 seconds | +90% | About -28% | ~2.30% conversion |
| 6 seconds | +106% | Severe | Most mobile sessions abandoned |
| 10 seconds | +123% | Severe | Paid traffic is being burned outright |
Two seconds of avoidable latency is roughly the difference between an average pool site and a top performer. On paid traffic the loss is cash: at $7.50-$11.00 per construction click, a bounce rate inflated 32% by a three-second load is a direct media write-off. This is the same measurement discipline we cover in the pool building marketing dashboards statistics breakdown - technical metrics only get funded once they sit next to cost per lead.
Page weight, images and JavaScript
Pool sites carry more media per page than almost any other trade. The web-wide trend is already going the wrong way.
| Factor | Web-wide 2026 figure | Why it hits pool builders harder |
|---|---|---|
| Average page weight | 2.3 MB, +18% vs 2023 | Galleries, drone video, before-and-after sliders |
| Average JavaScript per page | 507 KB compressed, +22% since 2023 | Lightbox, slider and booking widgets stack up |
| Sites using JavaScript | 97% | Rendering cost is universal, budget is not |
| Fully client-side rendered sites | 12% | Roughly 32% less content gets indexed |
| Google rendering queue delay | 5-10 seconds or more | New project pages index slowly |
| Single-page applications | 47% fewer pages indexed without SSR | Avoid SPA frameworks for service-area pages |
| Async or deferred scripts | LCP improves ~28% on average | Cheapest single speed win available |
| Speculation Rules prerendering | Up to 85% lower perceived load; 8.7% adoption | Under-used edge for gallery navigation |
2026 technical SEO statistics also record LCP under 2.5 seconds correlating with about 27% more organic traffic, and non-mobile-optimised sites losing an average of 68% of organic mobile traffic. For a channel that already delivers 48% of pool site visits, that is not a rounding error.
Schema markup: mostly deployed, rarely valid
Structured data is the cheapest technical differentiator left for a local builder, provided it validates.
| Finding | Figure | Scope of the measurement |
|---|---|---|
| Sites using any structured data | 39% | All websites, web-wide crawl data |
| Sites deploying at least one schema type | 71% | Stratified audit of 5,000 production sites |
| Sites passing Rich Results Test cleanly | 22% | Same 5,000-site audit, every detected type |
| Deployed-but-broken tier | 49% of sites | Largest single segment in the audit |
| Sites with a validation error among schema users | ~60% | Web-wide crawl data |
| Most common error: missing required properties | 38% of error pages | 5,000-site audit |
| Second most common: invalid ISO-8601 dates | 24% of error pages | 5,000-site audit |
| FAQ schema click uplift | ~87% more clicks | Web-wide rich-result studies |
| Review schema CTR uplift | ~35% | Web-wide rich-result studies |
The two adoption figures differ because they measure different populations - 39% is web-wide including the long tail of brochure sites, while the 71% figure comes from a stratified sample of production sites that skews toward businesses with a marketing team. Both point the same direction: the gap is validity, not intention. For a pool builder the high-leverage set is LocalBusiness, Service, FAQPage, ImageObject on gallery items and Review or AggregateRating where the reviews are genuinely first-party.
Crawling, indexation and the AI bot shift
Most pool sites are small enough that crawl budget is irrelevant - until someone generates 400 near-identical city pages.
| Signal | 2026 figure | Action for a pool site |
|---|---|---|
| Global crawler requests returning 200 | 45.9% | Read your server logs, not just Search Console |
| 403 Forbidden share of crawler requests | 20.6% | Check firewall rules are not blocking Googlebot |
| Crawl waste on unmanaged sites | 30-40% | Control parameters, filters and paginated galleries |
| Enterprise pages never crawled | 26% on average | Only a risk once you scale service-area pages |
| Indexation gain after fixing canonical conflicts | 20-35% within 60 days | Audit duplicate city and service pages first |
| Infinite scroll without pagination | 41% fewer items indexed | Paginate the project gallery |
| AI crawler share of bot traffic | 35.6% combined | Ahead of search engines at 26.2% |
| Sites blocking AI crawlers via robots.txt | 28% | Decide deliberately, not by plugin default |

Crawl waste data for 2026 makes a point worth internalising: a crawler that follows your own navigation found a valid page 99.2% of the time, while global crawler requests succeed only 45.9% of the time. The waste is never in the link graph you can see - it is in parameters, old URLs and blocked assets that only server logs reveal.
Fix order for a pool builder's site
Sequenced by return per hour of developer time, not by audit-tool severity colour.
| Priority | Fix | Expected effect | Effort |
|---|---|---|---|
| 1 | Compress, resize and lazy-load gallery and hero images | LCP moves under 2.5 s; ~27% organic traffic edge | Low |
| 2 | Defer or async non-critical scripts | Average 28% LCP improvement | Low |
| 3 | Reserve space for lazy-loaded media and review widgets | Protects CLS under 0.1 | Low |
| 4 | Validated LocalBusiness, Service and FAQ schema | Rich-result eligibility most competitors lack | Medium |
| 5 | Canonicalise and de-duplicate service-area pages | 20-35% indexation coverage gain | Medium |
| 6 | Paginate galleries and control filter parameters | Cuts the 30-40% crawl waste band | Medium |
| 7 | Mobile-first template review of quote forms | Directly moves the 3.2% to 5.8% conversion gap | Medium |
| 8 | Server log review each quarter | Finds the waste crawlers never surface | Low |
Two cautions. First, Search Console reflects a 28-day rolling window of real-user data, so a fix shipped today will not show for weeks - do not judge it in a fortnight. Second, a low indexation ratio on a 40-page pool site is a completely different problem from the same ratio on 40,000 pages; diagnose before remediating. Our data intelligence team treats these as measurement problems first.
What never to do on a pool website
- Upload full-resolution build photography and let the browser resize it.
- Build the project gallery as infinite scroll with no paginated fallback - 41% fewer items get indexed.
- Ship schema without running the Rich Results Test; 49% of sites sit in the broken tier.
- Spin up near-duplicate city pages before canonical and internal linking rules exist.
- Keep AMP alive - adoption has fallen to 0.6% of websites.
- Judge mobile experience on a desktop browser when 68.5% of sessions are phones.
- Block AI crawlers by accident and then wonder why AI answers never mention you.
Metrics to review every quarter
- LCP, INP and CLS at p75 on mobile, against 2.5 s / 200 ms / 0.1.
- Share of your own URLs passing all three, against the 42% web-wide rate.
- Bounce rate against the 52.4% pool benchmark, segmented by device.
- Conversion rate against 3.2% average / 5.8% top performer.
- Indexed versus submitted pages, with exclusion reasons.
- Schema validation status on every template, not just the homepage.
- Crawler status-code mix from server logs, including AI bot traffic.
For the content side of the same channel, see our pool building SEO statistics analysis, or get in touch for a technical audit built around signed jobs rather than scores.
Frequently Asked Questions
Why does technical SEO matter more for pool builders than for most local trades?
Because pool websites are image and video heavy by nature and consumed almost entirely on phones. Roughly 68.5% of swimming pool website sessions happen on mobile, average bounce rate sits at 52.4%, and organic search delivers about 48% of all traffic to pool company sites. A gallery-driven site that fails Core Web Vitals is losing traffic in the channel that supplies nearly half of its visitors.
What Core Web Vitals thresholds should a pool site hit in 2026?
LCP under 2.5 seconds, INP under 200 milliseconds and CLS under 0.1. Only about 42% of websites pass all three, and 34% of crawled URLs fail at least one threshold. Field data from roughly 200,000 sites with complete Chrome data shows phone p75 outcomes of 2,209 ms LCP (81.7% good), 128 ms INP (91.9% good) and 0.02 CLS (88.8% good) - meaning LCP, driven by hero images, is where pool sites lose.
How much does a slow pool website actually cost?
Each additional second of load time reduces conversions by roughly 7% and raises bounce rate by about 11%. Relative to a one-second baseline, bounce climbs 32% at three seconds and 90% at five. Median load time for pages ranking in Google's top ten is 1.65 seconds. With pool sites converting at 3.2% on average and 5.8% for top performers, two wasted seconds is roughly the whole gap between average and best in class.
Does schema markup help a pool builder?
Yes, and most sites deploy it badly. Only about 39% of all websites use any structured data, and in a stratified audit of 5,000 production sites, 71% shipped at least one schema type while only 22% passed Google's Rich Results Test cleanly - leaving 49% in a deployed-but-broken tier. FAQ schema is associated with roughly 87% more clicks and Review schema with about 35% higher CTR, so LocalBusiness, Service, FAQ and Review markup on service and gallery pages is high-leverage work for a builder.
What technical issues should a pool builder fix first?
In order: compress and correctly size gallery and hero imagery to fix LCP, make sure every service area page is crawlable and canonicalised, add validated LocalBusiness plus Service and FAQ schema, remove duplicate or thin city pages, and only then worry about crawl budget. Fixing canonical chain conflicts has been observed to improve indexation coverage by 20-35% within 60 days, while crawl waste on unmanaged sites averages 30-40%.
Sources
SearchLab - Technical SEO Statistics 2026
Crawlix - Top Technical SEO Issues 2026
CoreWebVitals.io - State of Core Web Vitals
Digital Applied - Schema Markup Adoption, 5,000-Site Audit
SEOmator - Crawl Waste Report 2026
JustAnalytics - Core Web Vitals Statistics 2026
CUFinder - Swimming Pool Industry Benchmarks 2026
GetX Media - Pool Builder Marketing Benchmarks 2026
Garrett Handley - Contractor Website Conversion Rates 2026