



Table of contents

Key Takeaways
- Pool builders pay $7.50–$11 per click on Google search ads, with competitive markets like Florida and California pushing top-of-page CPC above $14.
- The average cost per lead for pool construction campaigns is $125–$180, while service and maintenance keywords produce leads at $35–$55.
- Google Ads delivers a 4.8% average conversion rate for pool-service landing pages, with top-optimized pages reaching 12–16%.
- Performance Max campaigns produce 22–35% more conversions at comparable CPA when fed with high-quality product imagery and audience signals.
- Pool companies running local service ads (LSAs) achieve $45–$75 cost per verified lead, undercutting traditional search campaigns by 35–50%.
- The pool-building PPC market has grown 46% year-over-year in average CPC, reflecting intensifying competition as more contractors invest in digital advertising.
Google Ads Cost Benchmarks for Pool Builders
The table below consolidates 2026 paid search performance data for pool companies, drawn from M.Wolf Media, DG Agency regional surveys, and Web Tonic's pricing analysis.
| Metric | Pool Construction | Pool Service / Maintenance |
|---|---|---|
| Average CPC (Search) | $7.50–$11.00 | $4.20–$6.80 |
| Average CPC (Display) | $0.85–$1.60 | $0.65–$1.20 |
| Cost per Lead (Search) | $125–$180 | $35–$55 |
| Cost per Lead (LSA) | $45–$75 | $22–$40 |
| Conversion Rate (Search) | 4.8% | 6.2% |
| Click-Through Rate (Search) | 4.1% | 5.3% |
| Impression Share (avg.) | 42–58% | 50–65% |
| Cost per Acquisition (closed deal) | $850–$1,200 | $180–$320 |
CPC Trends and Year-over-Year Cost Changes
Pool-building Google Ads costs have risen sharply, with average CPC climbing 46% year-over-year to $5.81 across all pool-related keyword categories (M.Wolf Media). Construction-specific terms like "pool builder near me" and "inground pool cost" command the premium range at $7.50–$11, while informational queries such as "pool maintenance tips" remain below $3.50.
Several factors drive the increase: more contractors entering the digital advertising space (up from 38% in 2024 to 60% in 2026 per WorldMetrics), rising bid floors from auction dynamics, and AI-driven bidding strategies that automatically escalate bids in competitive windows. Pool builders in Sun Belt states face the steepest climbs, with Florida CPC up 52% and Arizona up 48% compared to national averages.
Despite rising costs, the return per click has also improved as tracking and attribution systems mature. Pool companies with proper offline conversion tracking report 30–40% higher attributable ROAS than those measuring only online form fills, suggesting the true cost-efficiency gap is smaller than raw CPC data implies.
Top-Performing Keywords and Search Intent
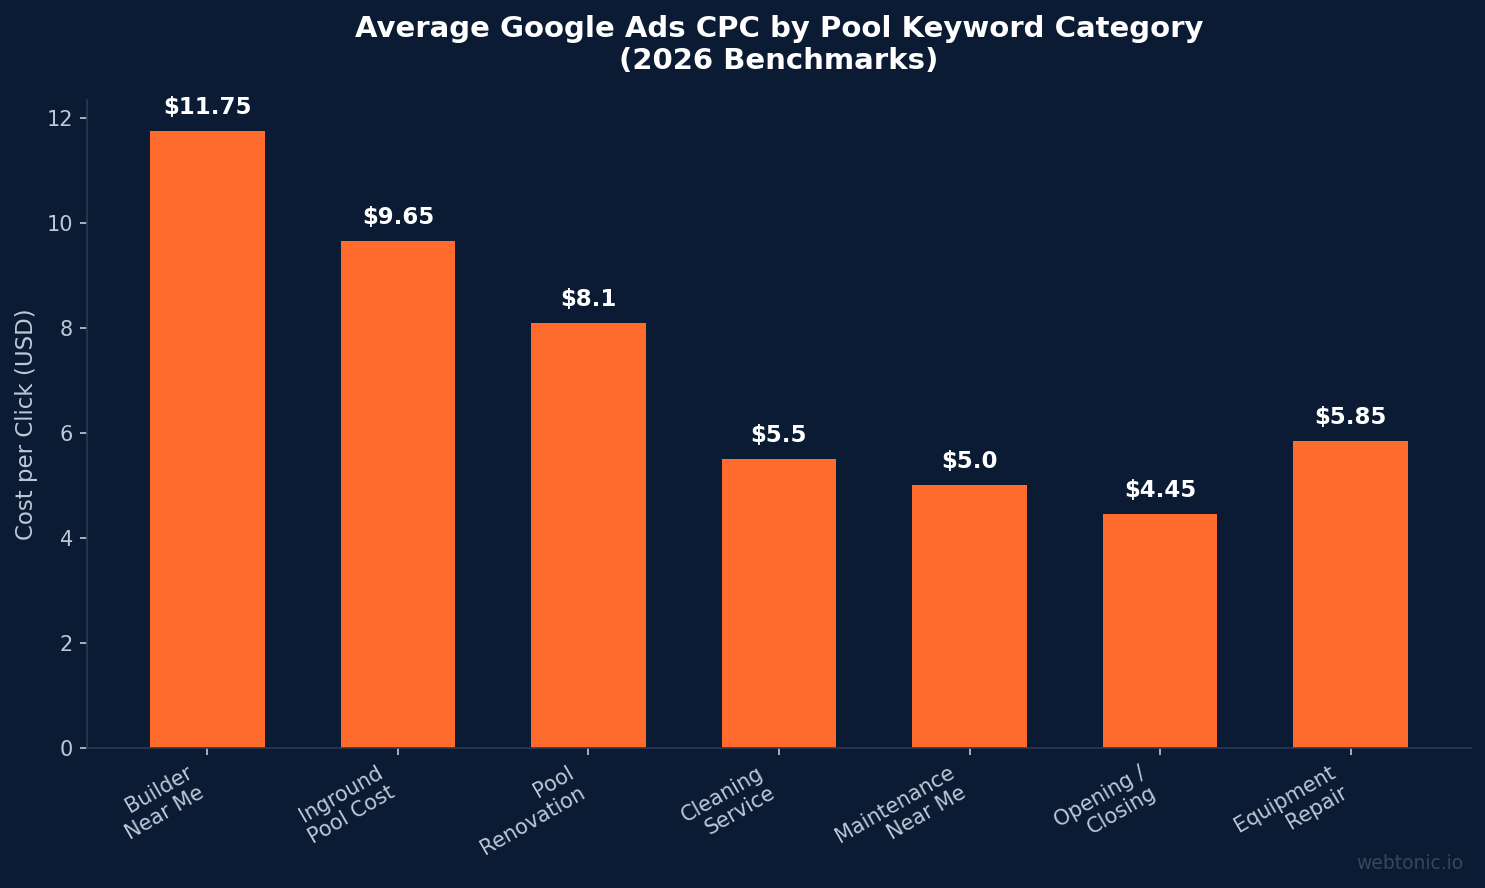
Keyword selection separates profitable pool-builder campaigns from budget drains. High-commercial-intent keywords convert at 3–5× the rate of informational queries, despite costing 2–3× more per click. The table below ranks keyword categories by ROI efficiency:
| Keyword Category | Avg. CPC | CVR | Avg. CPL |
|---|---|---|---|
| Pool builder near me / [city] | $9.50–$14.00 | 6.8% | $140–$205 |
| Inground pool cost / price | $7.80–$11.50 | 5.2% | $150–$220 |
| Pool renovation / remodel | $6.40–$9.80 | 4.5% | $142–$218 |
| Pool cleaning service [city] | $4.20–$6.80 | 7.4% | $57–$92 |
| Pool maintenance near me | $3.80–$6.20 | 6.9% | $55–$90 |
| Pool opening / closing service | $3.50–$5.40 | 8.1% | $43–$67 |
| Pool equipment repair | $4.60–$7.10 | 5.8% | $79–$122 |
Pool-service keywords consistently deliver lower CPL and higher conversion rates than construction terms because maintenance customers face immediate needs. However, construction leads produce 10–30× higher lifetime value ($55,000–$85,000 project value vs. $800–$2,400 annual service contracts), justifying the premium CPC. Smart advertisers run segmented campaign strategies that treat each service line independently.
Campaign Types and Their Performance
Pool builders leverage four primary campaign types, each suited to different objectives and funnel stages:
| Campaign Type | Avg. CPL | Lead Quality | Best For |
|---|---|---|---|
| Search Campaigns | $125–$180 | High (active searchers) | Bottom-funnel construction leads |
| Local Service Ads (LSAs) | $45–$75 | Very high (Google-verified) | Service & maintenance leads |
| Performance Max | $85–$140 | Medium-high (mixed signals) | Multi-channel reach + automation |
| Display / YouTube | $15–$35 (awareness) | Low-medium (awareness stage) | Brand building & retargeting |
Local Service Ads have emerged as the strongest value proposition for pool-service companies, delivering verified leads at 35–50% lower cost than traditional search ads. The "Google Guaranteed" badge adds trust — consumers are 68% more likely to contact an LSA-listed contractor than a standard text ad result (PHTA). Pool companies combining LSAs with search campaigns capture both brand-preference and pure-need searchers, maximizing coverage across the entire decision funnel.
Regional Cost Variations by State
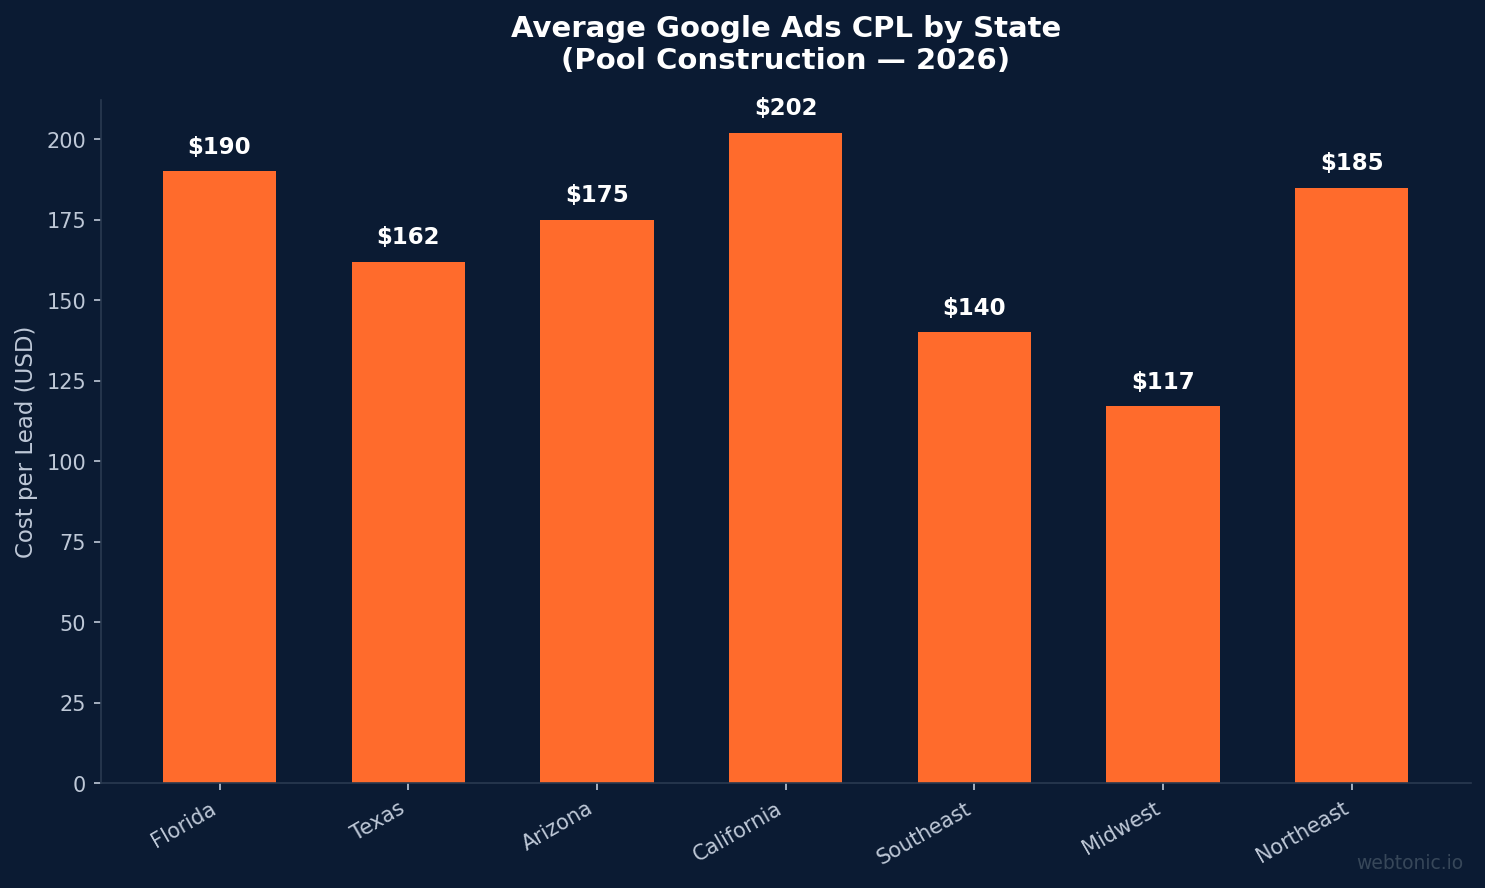
Costs for pool builders vary dramatically by geography. States with year-round pool seasons and dense contractor populations see the highest competition (Market Disruptors):
| State / Region | Avg. CPC | Avg. CPL (Construction) | Competition Level |
|---|---|---|---|
| Florida | $10.50–$14.80 | $155–$225 | Very High |
| Texas | $8.20–$12.40 | $130–$195 | High |
| Arizona | $9.10–$13.60 | $140–$210 | Very High |
| California | $11.00–$15.50 | $165–$240 | Very High |
| Southeast (GA, SC, NC) | $6.80–$10.20 | $110–$170 | Moderate-High |
| Midwest (OH, IN, MI) | $5.40–$8.60 | $90–$145 | Moderate |
| Northeast (NY, NJ, CT) | $9.40–$13.90 | $150–$220 | High |
Midwest markets represent the best value opportunity for pool builders entering paid search, with CPCs 40–50% below Sun Belt averages and less auction saturation. However, the shorter pool season (May–September) compresses the conversion window, requiring aggressive budget front-loading in spring to capture peak demand.
ROI and Case Study Results
The strongest documented results come from contractors who combine tight keyword targeting, conversion-optimized landing pages, and CRM-integrated tracking. Notable case studies:
- Blue Tree Pools achieved 36× ROAS with a $988 cost per pool sale, generating $4.38 million in attributed revenue from campaigns managed over 18 months (ROI.LIVE).
- Noga Pools reported 9,860% ROAS on a combined Google + Meta strategy, with Google Ads contributing the majority of bottom-funnel conversions (BoldPro Digital).
- Blue Haven Pools achieved a 14% website conversion rate through landing page optimization and structured data integration (HubSpot).
- Mid-size Florida pool builders average $12–$18 ROAS on well-optimized search campaigns, according to a 300-site regional study (PHTA).
These results represent top-quartile performance. The median pool builder running paid search achieves 3–6× ROAS, with profitability highly dependent on tracking infrastructure and attribution accuracy. Companies without proper conversion tracking — estimated at 40% of pool contractors — cannot measure true ROI and risk over-spending on underperforming campaigns.
Best Practices for Pool Builder PPC Campaigns
- Separate construction and service campaigns — different CPLs, bidding strategies, and landing pages for each service line prevent budget misallocation.
- Invest in Local Service Ads alongside search campaigns — LSAs deliver 35–50% lower CPL for service leads with higher close rates.
- Use location bid adjustments within 30-mile radius tiers — bid +20% for 0–15 miles, +10% for 15–25 miles, and baseline beyond.
- Build dedicated landing pages per keyword cluster — single-service pages convert at 2.4× the rate of generic homepages.
- Implement offline conversion tracking — feeding CRM close data back improves Smart Bidding accuracy by 30–40%.
- Schedule ads for business hours with call extensions — 62% of pool leads come via phone calls during 8 AM–6 PM windows.
- Run seasonal budget adjustments — allocate 40–50% of annual budget to March–May peak season when search volume triples.
Performance Max Campaign Analysis for Pool Builders
Performance Max (PMax) has gained significant traction among pool builders since Google expanded its capabilities in 2025. PMax campaigns now account for 30–40% of total search spend for pool companies using them, up from 15% in 2024. The format works by distributing ads across Search, Display, YouTube, Gmail, Discover, and Maps simultaneously, leveraging Google's AI to optimize placement and bidding in real time.
Pool builders report 22–35% more conversions at comparable CPA when PMax campaigns are properly configured with high-quality assets. The key requirement is strong audience signals — uploading customer lists, defining custom intent segments around pool-related search behavior, and providing at least 15 image assets, 5 video assets, and 4 headline variants for the algorithm to test. Companies that skip this setup and launch PMax with minimal assets see significantly worse results, with CPL inflated 40–60% above search campaign baselines.
The biggest concern with PMax for pool builders is cannibalization of branded search traffic. Without proper brand exclusions (available since 2024), PMax frequently claims credit for searches like "[Company Name] pool builder" that would have converted organically. Adding brand exclusion lists reduces PMax-reported CPA by 15–25% but also reveals more accurate true acquisition cost, which helps with strategic budget allocation decisions.
Landing Page Conversion Optimization
Landing page quality is the highest-leverage optimization point for pool-builder campaigns. The gap between average and top-performing pages is enormous: 4.8% baseline conversion vs. 12–16% for optimized pages. Key factors driving higher conversion rates include:
- Page load speed under 3 seconds — every additional second reduces conversions by 12% on mobile, where 68.5% of pool traffic originates.
- Click-to-call buttons above the fold — phone leads account for 62% of pool-service conversions, and prominent call buttons lift phone lead volume by 35–45%.
- Social proof placement (reviews, project count, years in business) — pages displaying 20+ reviews within the first viewport convert 28% higher than review-free layouts.
- Service-specific landing pages vs. homepage — dedicated pages for pool construction, maintenance, renovation, and repair each convert at 2.4× the rate of a generic homepage receiving the same traffic.
- Financing options displayed prominently — for construction campaigns where average project value exceeds $65,000, showing monthly payment estimates lifts form fills by 18–24% (HubSpot).
Pool builders who invest in dedicated landing pages per keyword cluster and test headline, CTA, and form length variations monthly see sustained conversion improvements. The typical optimization cycle yields 15–25% conversion rate improvement over 90 days of active testing, with diminishing returns after 6 months without significant layout changes.
Budget Allocation and Seasonal Pacing
Effective PPC budget management for pool builders requires aggressive seasonal pacing rather than flat monthly allocation. March through May should receive 40–50% of the annual search budget, as this window captures the highest volume of construction and service inquiries. Companies that maintain flat budgets year-round waste 25–35% of their winter spend on low-intent traffic that rarely converts to signed contracts (PHTA).
The recommended monthly budget breakdown by season follows a clear pattern: January–February at 60% of peak-month budget (pre-season awareness and early-bird offers), March–May at 100% (full prospecting + service campaigns), June–August at 75% (service-heavy, construction maintenance), September–October at 50% (closing services + off-season promotions), and November–December at 30% (minimal maintenance, brand campaigns only). This allocation matches budget to demand curves and maximizes return per dollar across the full year.
Smart Bidding strategies should be adjusted alongside budget changes. During peak season, Target CPA bidding with a 10–15% more aggressive target captures additional high-quality volume. In the off-season, switching to Maximize Conversions with a daily budget cap ensures the algorithm prioritizes the limited available demand without overspending on marginal clicks.
Related reading
- Phone & Tech Retail Google Ads Statistics: Key Data Points for 2026
- Surrogacy Google Ads Statistics 2026: Data-Driven Insights
- The State of Google Ads in Tax & Accounting: 2026 Stats & Trends
- Paid Search services at Web Tonic
Frequently Asked Questions
How much do Google Ads cost for pool builders?
Pool builders typically pay $7.50–$11 per click on search ads, with monthly budgets ranging from $3,000–$15,000 depending on market size and competition. Construction keywords cost 2–3× more than service keywords. The average cost per lead is $125–$180 for construction and $35–$55 for maintenance.
What is a good conversion rate for pool builder Google Ads?
A 4.8% conversion rate is the industry average for pool-service search campaigns, while top-performing landing pages achieve 12–16%. Factors that lift conversion rates include dedicated service-specific pages, click-to-call buttons, prominently displayed reviews, and fast page load times under 3 seconds.
Should pool builders use Performance Max or search campaigns?
Both — but start with search campaigns to capture high-intent leads. Performance Max is best added once search campaigns generate 30+ conversions per month, giving the algorithm enough data for optimization. PMax typically delivers 22–35% more conversions at comparable CPA when properly configured with quality assets and audience signals.
Are Local Service Ads worth it for pool companies?
LSAs are among the most cost-effective lead sources for pool-service businesses, delivering verified leads at $45–$75 per lead — 35–50% cheaper than traditional search ads. The Google Guaranteed badge builds trust, and the pay-per-lead model eliminates wasted click spend on non-converting traffic.
How long does it take for Google Ads to work for pool builders?
Initial leads typically arrive within 1–2 weeks of campaign launch, but full campaign optimization takes 60–90 days. Smart Bidding strategies need 30–50 conversions per month to exit the learning phase. Pool builders should plan a 90-day runway before evaluating true performance and making strategic decisions about budget allocation.
Sources
M.Wolf Media — Pool Marketing Services
Market Disruptors — Pool Lead Economics
ROI.LIVE — Pool Marketing
Reports and Data — Swimming Pool Market
BoldPro Digital — Case Studies
HubSpot — Marketing Statistics
PHTA — Pool & Hot Tub Alliance
WorldMetrics — Swimming Pool Statistics
WorldMetrics — Swimming Pool Statistics
GetResponse — Email Marketing Benchmarks


