



Table of contents
Consumer electronics retailers pay an average CPC of $1.20–$2.50 on Google Search, with conversion rates of 3–5% and a Shopping ROAS of 3.8× — well below the 4× threshold needed to break even at typical 25% margins. Here are the benchmarks, cost trends, and performance data that define Google Ads for phone and tech retail in 2026.
Key Takeaways
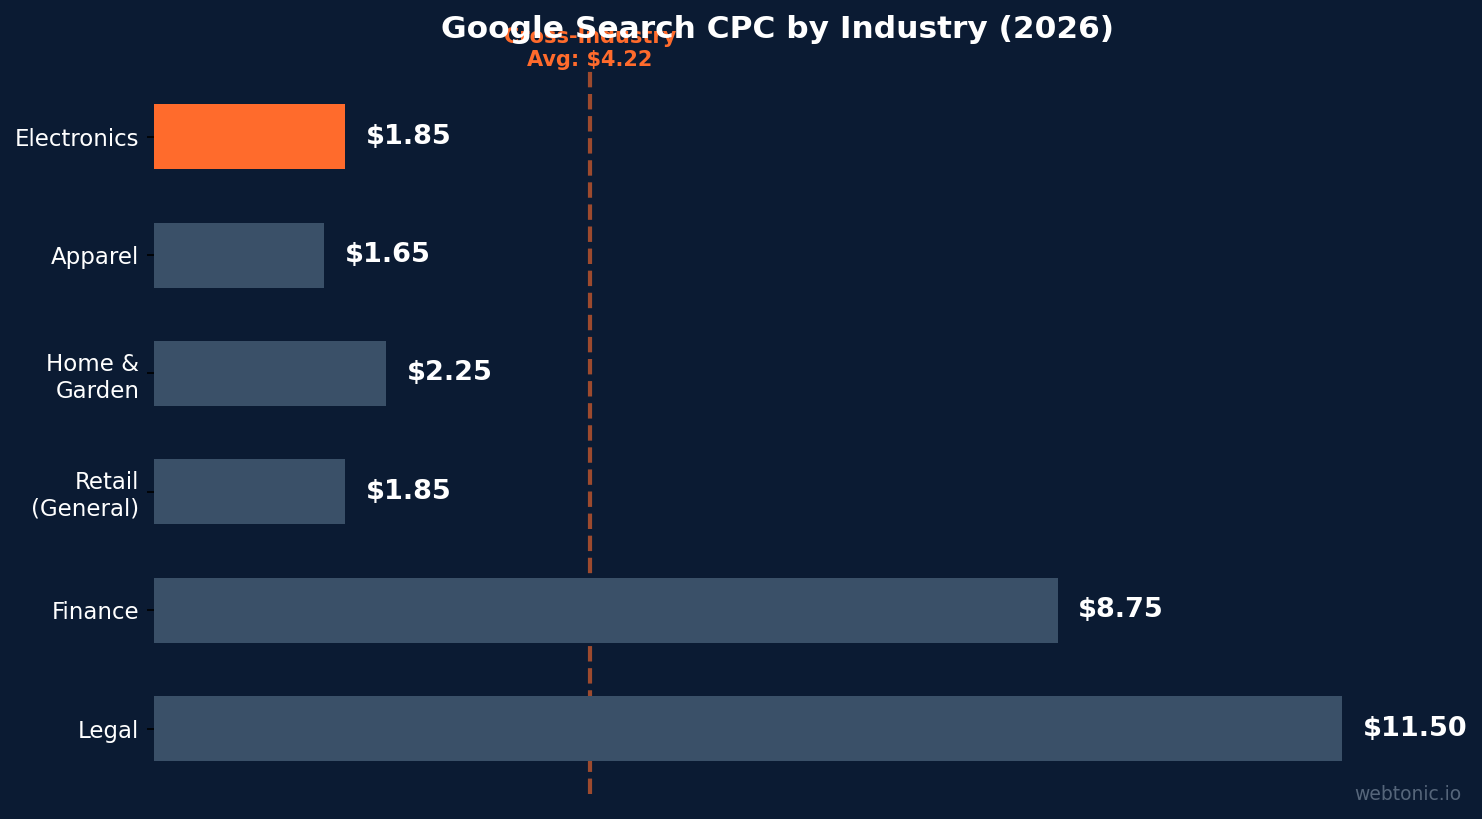
- Electronics retail CPC averages $1.20–$2.50 on Google Search — significantly below the $4.22 cross-industry average, reflecting high competition but lower intent per click.
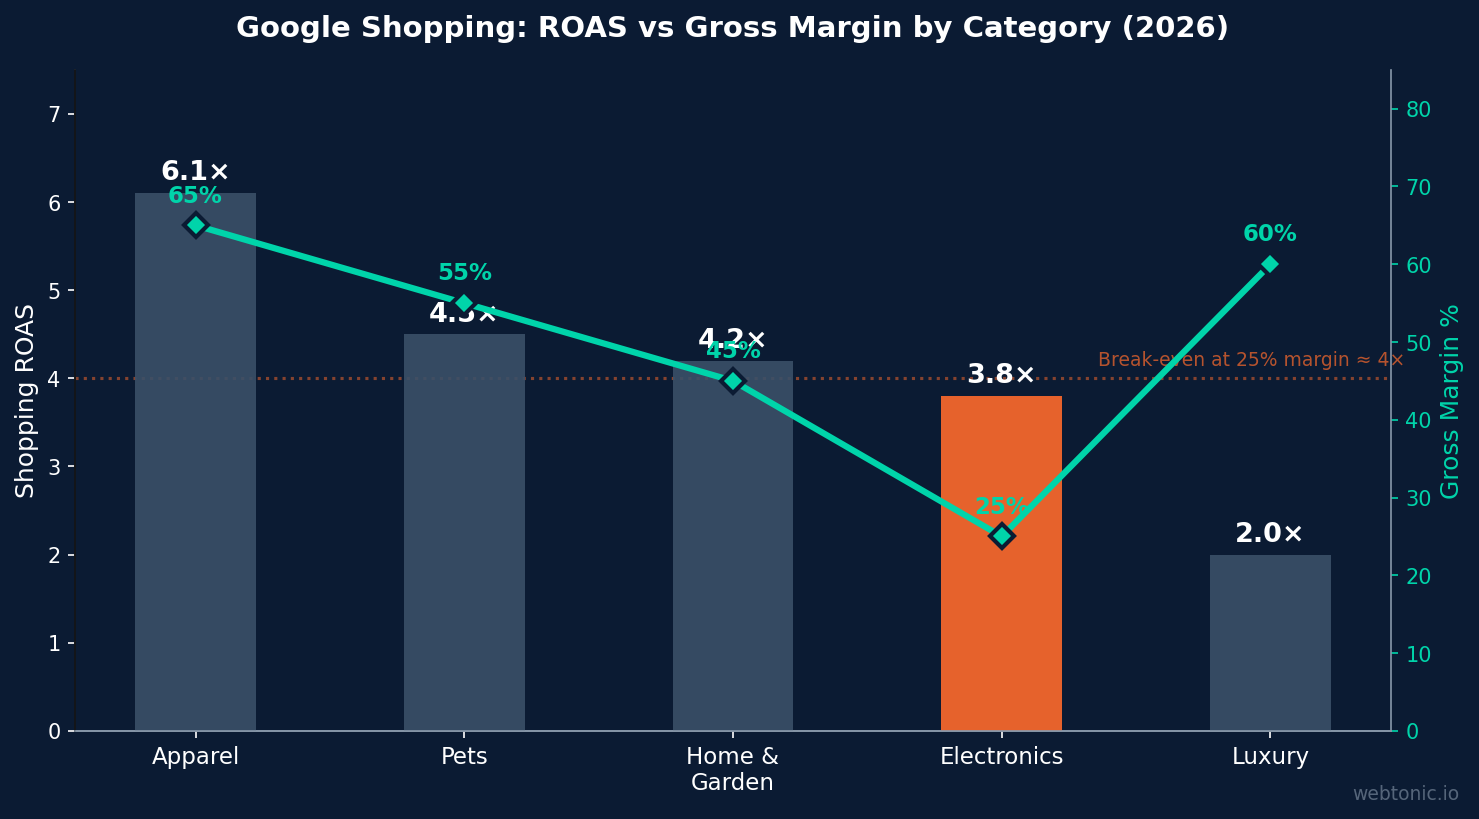
- Google Shopping delivers 3.8× ROAS for electronics, but at 25% margins this barely covers costs — brands need 4×+ to profit (FoundryCRO).
- Cross-industry Search conversion rate reached 7.04% in 2026, while electronics converts at just 3–5% due to extended research cycles (DollarPocket).
- Performance Max captures 45–60% of electronics Google Ads budgets, blending Search, Shopping, YouTube, Display, and Discover into a single automated campaign.
- Google Shopping CPC for electronics averages $0.45–$0.85, making it 40–65% cheaper per click than text search ads for the same products.
- Mobile search drives 78% of electronics product queries but converts at less than half the desktop rate — a $47K/year revenue gap for unprepared retailers.
- Consumer electronics digital ad spend reached $26.32 billion in 2026, with search advertising claiming 38% of the total digital budget (eMarketer).
- WordStream's 13,474-campaign study shows Retail CPC at $1.46 with a 4.81% conversion rate across all search platforms.
- Smart Bidding adoption in electronics exceeds 85%, with Target ROAS being the dominant strategy for Shopping campaigns.
- Brand search campaigns deliver 8–12× ROAS for electronics, protecting market share from competitor conquesting at minimal cost.
Phone & Tech Retail Google Ads Benchmarks at a Glance
| Metric | Electronics | Cross-Industry Avg | Index |
|---|---|---|---|
| Search CPC | $1.20–$2.50 | $4.22 | 0.41× |
| Search CTR | 5.8–7.2% | 6.42% | ~1.0× |
| Search Conversion Rate | 3.0–5.0% | 7.04% | 0.57× |
| Shopping CPC | $0.45–$0.85 | $0.65 | ~1.0× |
| Shopping ROAS | 3.8× | 5.2× | 0.73× |
| Display CTR | 0.40–0.55% | 0.46% | ~1.0× |
| Cost per Lead | $35–$65 | $53.52 | ~1.0× |
Sources: DollarPocket 2026 Benchmarks, FoundryCRO Shopping Benchmarks, WordStream/LocaliQ 2026 Report.
Search vs. Shopping Campaign Performance
Electronics retailers split Google Ads budgets between text search and Shopping campaigns, with distinct performance profiles for each. FoundryCRO's 2026 benchmark study reveals the margin challenge unique to electronics:
- Shopping ROAS of 3.8× looks healthy until adjusted for margins — at 25% gross margins, electronics needs 4× ROAS just to break even
- Apparel achieves 6.1× Shopping ROAS with 65% margins, making the same ROAS nearly 4× more profitable than electronics
- Shopping CPC ($0.45–$0.85) runs 40–65% below search CPC ($1.20–$2.50), making Shopping the efficiency leader for product-level queries
- Search campaigns capture high-intent queries like "best phone under $500" with 5–7% conversion rates — 2× the Shopping rate for generic browsing queries
The optimal budget split for electronics retailers is 55–65% Shopping (including PMax Shopping allocation) and 35–45% Search. Brands that over-index on Search without Shopping infrastructure leave the most cost-efficient clicks on the table.
Performance Max Adoption and Channel Distribution
Performance Max now captures 45–60% of electronics Google Ads budgets, driven by Google's push toward automated, multi-channel campaigns. For electronics retailers, PMax blends Shopping, Search, YouTube, Display, Discover, Gmail, and Maps into a single campaign that optimizes across channels automatically.
Channel distribution within electronics PMax campaigns typically breaks down as:
| Channel | Spend Share | Conversion Share | CPA Index |
|---|---|---|---|
| Shopping | 50–65% | 55–70% | Low |
| Search | 15–25% | 15–20% | Medium |
| YouTube | 8–15% | 3–8% | High |
| Display | 5–10% | 2–5% | High |
| Discover/Gmail | 3–8% | 2–4% | Medium |
Electronics PMax campaigns that provide at least 15 high-quality assets (including video) see 18–25% lower CPA than under-built asset groups. Product feed quality remains the single most impactful lever — titles optimized with search query terms deliver 12–18% higher Shopping impression share.
CPC and Cost Trends for Electronics Search Advertising
Google Ads costs for electronics reflect both platform-wide inflation and category-specific dynamics. Triple Whale's analysis of 18,000+ brands reveals declining marketing efficiency ratios (MER) alongside rising costs:
- Average Search CPC rose 8–14% year-over-year for electronics keywords, outpacing the 6% cross-industry average
- Brand keyword CPC remains low ($0.25–$0.60) but competitor conquesting inflates costs by 15–25% when rivals bid on your brand terms
- Long-tail keywords ($0.80–$1.40 CPC) convert at 2× the rate of head terms ($1.80–$2.50 CPC), offering superior ROI for budget-constrained advertisers
- Cost per lead in electronics averages $35–$65, with variance driven by product category — phone accessories at the low end, enterprise tech at the high end
The COREPPC 2026 ecommerce study of 500+ Shopify and DTC accounts confirms that electronics brands spending $10K+/month achieve 15–20% lower CPC than those under $5K, likely due to better quality scores from higher click volumes and more conversion data feeding Smart Bidding.
Conversion Rate and Quality Score Dynamics
Electronics conversion rates on Google Search (3–5%) sit well below the 7.04% cross-industry average reported by DollarPocket. The gap reflects fundamental buyer behavior differences:
- Average electronics purchase decision takes 14–28 days, compared to 1–3 days for apparel and accessories
- Price comparison behavior is 3× higher in electronics — shoppers visit an average of 4.2 sites before purchasing
- Quality Score for electronics keywords averages 5–7/10, with landing page experience being the most common drag factor
- Each 1-point Quality Score improvement reduces CPC by approximately 13% and improves ad rank without increasing bids
Conversion rate by device shows a stark divide: desktop converts at 4.5–6.2%, tablets at 3.2–4.1%, and mobile at 2.0–3.1%. The mobile conversion gap costs electronics retailers an estimated $47,000 per year in lost revenue per $100K in ad spend (CuFinder). Express checkout, streamlined mobile product pages, and strategic Google Ads optimization help close this gap.
Electronics vs. Other Industries on Google Ads
| Industry | Search CPC | Search CVR | Shopping ROAS | CPL |
|---|---|---|---|---|
| Electronics / Tech Retail | $1.20–$2.50 | 3.0–5.0% | 3.8× | $35–$65 |
| Apparel & Fashion | $1.30–$2.00 | 4.5–6.5% | 6.1× | $25–$45 |
| Home & Garden | $1.50–$3.00 | 3.5–5.5% | 4.2× | $40–$70 |
| Legal Services | $8.00–$15.00 | 6.5–9.0% | N/A | $85–$150 |
| Finance / Insurance | $5.50–$12.00 | 4.0–6.0% | N/A | $70–$120 |
| Retail (General) | $1.20–$2.50 | 4.8–6.5% | 5.2× | $30–$55 |
Electronics occupies a unique position: low CPC but also low conversion rates create moderate overall cost per acquisition. The margin squeeze is the critical differentiator — while a fashion brand profits handsomely at 4× ROAS (65% margins), an electronics retailer at the same ROAS barely covers fulfillment costs (25% margins). This makes feed optimization, bid strategy, and conversion rate optimization existential priorities rather than incremental improvements.
Best Practices for Electronics Google Ads Campaigns
- Prioritize Shopping feed quality — optimized product titles with search query terms deliver 12–18% higher impression share and lower CPC. Include brand, model, key specs, and color in every title.
- Split budgets 55–65% Shopping, 35–45% Search — Shopping's lower CPC ($0.45–$0.85 vs. $1.20–$2.50) delivers better volume efficiency for product-level queries.
- Target long-tail keywords aggressively — $0.80–$1.40 CPC with 2× the conversion rate of head terms makes long-tail the highest-ROI keyword strategy.
- Build brand campaigns defensively — even at low CPC ($0.25–$0.60), brand search delivers 8–12× ROAS and protects against competitor conquesting.
- Invest in PMax asset quality — campaigns with 15+ assets (including video) see 18–25% lower CPA than under-built asset groups.
- Optimize for Quality Score 7+ — each point improvement reduces CPC by ~13%. Focus on landing page experience, the most common weakness for electronics.
- Address the mobile conversion gap — express checkout and mobile-optimized product pages can recover the $47K/year revenue loss per $100K spend.
- Layer audience signals on Search — past purchasers and cart abandoners as observation audiences improve Smart Bidding by 10–15% on target CPA.
Smart Bidding and Automation Strategies for Electronics
Smart Bidding adoption in electronics exceeds 85% of active campaigns, with Target ROAS being the dominant strategy for Shopping and Performance Max campaigns. The shift from manual CPC to automated bidding has reshaped how electronics retailers compete in Google auctions:
- Target ROAS campaigns deliver 10–18% more conversions at the same budget compared to manual CPC for electronics advertisers with 50+ monthly conversions
- Target CPA bidding works best for lead generation electronics brands (B2B tech, enterprise accessories) where ROAS measurement is delayed or complex
- Learning period averages 7–14 days for electronics campaigns — brands that make bid changes more frequently than every two weeks see 12–20% higher CPAs from perpetual learning-phase disruption
- Portfolio bid strategies across 3–5 related campaigns improve conversion volume by pooling data, particularly valuable for electronics sub-categories with thin individual volume
- Seasonality adjustments are critical during Q4 — manually increasing conversion rate expectations by 30–50% during Black Friday prevents Smart Bidding from under-bidding during the highest-intent shopping period
The data shows that electronics accounts spending over 0,000 monthly see the greatest benefit from Smart Bidding, as the algorithm receives enough conversion signals to optimize effectively. Accounts below this threshold often benefit from a hybrid approach — Smart Bidding on high-volume campaigns and enhanced CPC on tail campaigns with fewer than 15 monthly conversions.
Remarketing and Customer Acquisition Cost Dynamics
The extended electronics purchase cycle creates a massive remarketing opportunity. Remarketing lists for search ads (RLSA) deliver 35–50% lower CPA and 2× higher conversion rates than cold search campaigns for electronics retailers. Key remarketing statistics:
- Electronics shoppers visit 4.2 websites on average before purchasing, making cross-session remarketing essential for capturing conversions
- Cart abandonment remarketing on Google Display delivers 3–5× ROAS with CPMs 40–60% below prospecting Display campaigns
- Customer match audiences from CRM data improve Search campaign performance by 20–30% when layered as audience signals in Smart Bidding
- New customer acquisition cost averages 5–7× the cost of retaining existing customers, making lifetime value modeling essential for electronics Google Ads profitability
- Cross-sell campaigns targeting accessory purchases within 30 days of hardware purchase generate 6–10× ROAS at –5 CPA — the highest-margin segment in electronics PPC
Electronics retailers that build robust first-party data strategies — including enhanced conversions, customer match, and offline conversion imports — consistently outperform competitors relying solely on Google's algorithmic audience targeting. First-party data campaigns deliver 25–40% lower CPA than equivalent third-party audience segments on Google Display and YouTube.
Related reading
- What B2B Tech Media Buyers Should Budget for Google Ads in 2026
- Home Renovation Retail Google Ads Statistics, 2026
- Pool Building Google Ads Statistics
- Paid Search services at Web Tonic
FAQ
What is a good CPC for electronics Google Ads?
A competitive CPC for electronics on Google Search is $1.20–$2.50, well below the $4.22 cross-industry average. Shopping CPC runs even lower at $0.45–$0.85. The key metric is not CPC alone but cost per acquisition — aim for a CPA that allows positive margin after accounting for product costs, shipping, and returns.
Why is electronics conversion rate lower than other industries?
Electronics converts at 3–5% versus the 7.04% cross-industry average because purchase decisions take 14–28 days, involve price comparison across 4+ retailers, and carry higher financial risk. Video reviews, comparison tools, and remarketing lists for search ads (RLSA) help capture intent across this extended funnel.
Should electronics retailers use Performance Max or Standard Shopping?
Performance Max is recommended for most electronics retailers spending $5K+/month. It captures 45–60% of category budgets and automates cross-channel distribution. However, maintaining a Standard Shopping campaign alongside PMax gives you search term visibility and more granular product-level control that PMax does not provide.
How much should phone and tech retailers spend on Google Ads?
Electronics brands typically allocate 8–15% of revenue to Google Ads. A minimum monthly budget of $5,000–$10,000 is needed for PMax to generate sufficient conversion data (30–50 conversions/month) for Smart Bidding optimization. Brands spending $10K+ achieve 15–20% lower CPC than smaller accounts.
What Shopping ROAS should electronics retailers target?
At typical 25% gross margins, electronics retailers need 4×+ Shopping ROAS to break even. The category average is 3.8×, meaning most brands operate near breakeven on new customer acquisition. Lifetime value (repeat purchases, accessories) justifies the investment — electronics customers acquired through Google Shopping show 28% higher 12-month repeat rates than organic customers.
Sources
DollarPocket — Google Ads Benchmarks 2026
FoundryCRO — Google Shopping Benchmarks 2026
COREPPC — Google Ads Ecommerce Benchmarks 2026
Triple Whale — Google Ads Benchmarks
WordStream/LocaliQ — Search Advertising Benchmarks 2026
Zipdo — Marketing in the Electronics Industry
CuFinder — Retail Mobile vs Desktop Benchmarks
eMarketer — Digital Ad Spending Data
AdLibrary — Ecommerce Benchmarks 2026
Skai — Commerce Media Report


