Table of contents

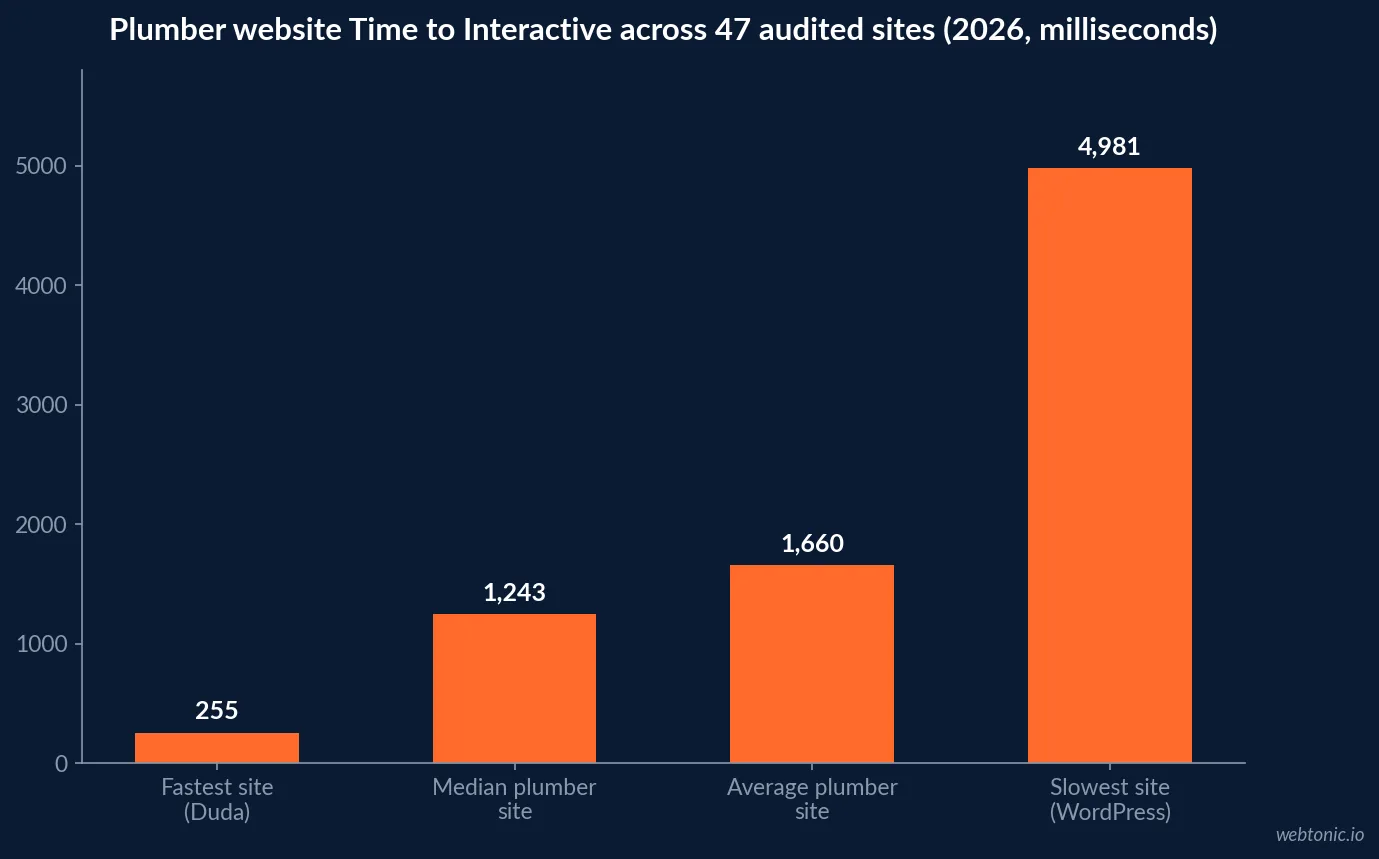
Plumbing is the one trade where technical SEO is measured in seconds. A homeowner standing in an inch of water does not wait for a hero video to decode. Across 47 audited plumber websites the average Time to Interactive was 1,660 ms (Claremont Software, 2026), the fastest loaded in 255 ms and the slowest took 4,981 ms — and 38% had no analytics installed at all, so their owners cannot even see the leads they lose.
Key Takeaways
- Only 42% of websites pass all three Core Web Vitals, and LCP remains the most common failure point on image-heavy service sites.
- 60% of plumber websites run on WordPress; the study's slowest site (4,981 ms) was a misconfigured WordPress install, while custom/static builds delivered an 11.8% content-to-code ratio against a 4.4% average.
- 38% of plumber sites have zero analytics and 24% do not prominently display a phone number — two failures no amount of ranking fixes.
- 53% of mobile visitors abandon above three seconds, and each extra second costs roughly 7% of conversions and adds about 11% to bounce rate.
- Only 39% of websites use structured data, and roughly 60% of schema implementations carry a validation error that blocks rich-result eligibility.
- 45.9% of crawler requests globally return a 200; 20.6% are 403s, 12.6% are redirect hops and only 1.2% end in an efficient 304 revalidation.
- 76% of contractor searches happen on mobile and 96% of website visitors leave without converting, so mobile technical debt is the largest single leak in plumbing marketing.
Plumbing technical SEO benchmarks at a glance
The numbers below mix two scopes deliberately: a 47-site plumber-specific audit and web-wide datasets. Read the plumber column as "what your competitors actually do" and the web-wide column as "what Google compares you against".
| Metric | Plumbing benchmark | Web-wide benchmark | What to target |
|---|---|---|---|
| Time to Interactive (mobile) | 1,660 ms average / 1,243 ms median | 1.65 s median load for Google top-10 results | Under 1,000 ms |
| Sites under 500 ms | 13% of 47 audited plumber sites | — | Join that 13% |
| Core Web Vitals pass (all three) | Majority fail, LCP first | 42% of all websites | Pass all three on mobile |
| Content-to-code ratio | 4.4% average (Wix 0.1%, Webflow 5.0%, static 11.8%) | — | Above 5% |
| Analytics installed | 62% of plumber sites | — | 100%, plus call tracking |
| Structured data present | Sparse; commonly invalid | 39% of all websites use schema | Valid LocalBusiness + Service + FAQ |
| HTTPS | 100% of audited plumber sites | 95.6% of Google top-10 pages | Baseline, not an advantage |
| Site conversion rate | 1–3% typical, 12–16% top tier | 7.8% home-services average | 5–7% within 90–120 days |
Speed is the plumbing conversion metric
Every other trade can argue about whether milliseconds matter. Plumbing cannot, because a meaningful share of demand is same-day and panicked. 70–80% of plumbing calls are urgent and 71% of homeowners book with the first contractor who answers, which means the page has to render the phone number before the visitor reconsiders.
The measured cost curve is brutal. Per the Searchlab 2026 dataset, bounce rate climbs 32% at three seconds and 90% at five seconds against a one-second baseline. Conversion falls roughly 7% per additional second. And 53% of mobile users abandon above the three-second mark — on a $5,000 monthly ad budget that is about $2,650 of spend that never reaches the funnel.
| Mobile load time | Relative bounce increase | Practical effect on a plumbing page |
|---|---|---|
| 1 second | Baseline (+7%) | Emergency callers convert; tap-to-call visible instantly |
| 3 seconds | +32% | Threshold where 53% of mobile users abandon |
| 5 seconds | +90% | Most paid clicks are wasted before the form renders |
| 6 seconds | +106% | Converting at roughly 65–80% of the 3-second rate |
| 10 seconds | +123% | Effectively an unranked, unbookable page |
The fixes are unglamorous and cheap: compressing and correctly sizing hero images typically removes 1.5–3 seconds, a third-party script audit removes another 200–800 ms per script, and moving to managed hosting behind a CDN removes 1–2 seconds of server response. One documented plumbing CRO rebuild cut mobile load from 6.1 s to 2.3 s and lifted site conversion from 1.4% to 6.2% in 90 days — 45 leads per month to 198 on the same traffic.
The platform and code-bloat problem
Platform choice explains most of the speed spread. In the 47-site audit, WordPress held 58–60% share, enterprise CMS platforms 13%, Duda 9%, custom/static HTML 11% and Webflow 4%. The content rate — the share of delivered HTML that is readable text — averaged 4.4%, meaning 95.6% of what the server ships is code.
| Platform | Share of plumber sites | Content-to-code ratio | Speed read |
|---|---|---|---|
| WordPress | 58–60% | 4.3% | Fine with a CDN and caching; slowest site in the study was WordPress |
| Enterprise / franchise CMS | 13% | 2.8% | Heavy markup overhead from centralised brand systems |
| Custom / static HTML | 11% | 11.8% | Cleanest output by roughly 3x |
| Duda | 9% | — | Produced the study's fastest site at 255 ms |
| Webflow | 4% | 5.0% | Second-best content ratio; cleaner default output than legacy CMS |
| Consumer builders (Wix) | 4% | 0.1% | Worst ratio in the study; consistent SEO underperformers |
Content volume is the other half. 60% of audited plumber sites carried over 1,000 words on the main page (1,462-word average), while the thinnest had 52 words. Only 4% sat under 300 words — a band where ranking for competitive local terms is close to impossible. If you are choosing or rebuilding a platform, our growth marketing team treats build decisions as lead-flow decisions, not aesthetic ones.
Core Web Vitals, mobile-first and JavaScript
Google has indexed mobile-first for 100% of sites since July 2024, and 63.4% of global web traffic is mobile — 76% for contractor searches specifically. That makes the mobile field data the only field data that matters.
- LCP must land under 2.5 s; unoptimised image-led plumbing heroes routinely sit in the 2.5–4 s "needs improvement" band.
- INP must stay under 200 ms, and Google is weighing a tighter 150 ms threshold. Chat widgets and booking embeds are the usual culprits.
- CLS under 0.1; sticky call bars and late-loading review badges are the classic shifters.
- JavaScript weight now averages 507 KB compressed per page, with third-party scripts at 54% of total JS. Deferring or async-loading them improves LCP by about 28%.
- Client-side rendered sites see roughly 32% less content indexed, and SPAs average 47% fewer indexed pages than comparable multi-page builds.
Sites that pass all three vitals see about 24% fewer bounces, and pages under a 2.5 s LCP average 27% more organic traffic than slower ones.

Crawl waste: small site, real leak
Web-wide, only 45.9% of crawler requests return a usable 200. The rest is waste: 20.6% 403s, 12.6% redirect hops, 7.8% 404s, 6.3% 429 rate limits and a shamefully low 1.2% of requests ending in a 304 Not Modified. Crawl budget waste averages 30–40% on sites with faceted or parameterised URLs and no directives.
Two caveats keep this honest. First, that 45.9% is a blended figure across client types — verified AI bots get a 200 73.0% of the time while non-AI bots (SEO tools, scrapers, monitors) get one only 33.3% and absorb a 29.2% block rate. Second, crawling a well-built site through its own navigation returns 200s 99.2% of the time; the waste lives in server logs, not in the link graph. For a plumbing site the waste generator is almost always auto-generated city × service permutations and old promo URLs.
AI crawlers are now the majority story: search-engine crawlers generate 26.2% of bot traffic while AI training, assistant and AI-search bots combine for 35.6%, and 28% of websites now block AI crawlers in robots.txt. Decide that deliberately — for local service businesses, being quotable inside an assistant answer is usually worth more than the bandwidth.
Schema, entities and the local pack
Structured data is where plumbing sites leave the most cheap ground uncovered. Only 39% of websites use any schema, and about 60% of implementations contain at least one validation validation error that removes rich-result eligibility. Sites with valid structured data average roughly 40% higher CTR in search; FAQ markup is associated with about 87% more clicks and review markup with a 35% CTR lift.
| Schema type | Why a plumber needs it | Common implementation error |
|---|---|---|
| LocalBusiness / Plumber | Ties NAP, hours and service area to the entity Google already has from GBP | Address mismatched with Google Business Profile |
| Service | Distinguishes drain cleaning from repiping so service pages can rank separately | One generic Service block reused site-wide |
| FAQPage | Feeds both rich results and AI answer extraction | Markup that does not match visible on-page text |
| AggregateRating | Surfaces review counts where 88% of homeowners choose review-responders | Self-serving ratings without a verifiable source |
| BreadcrumbList | Clarifies the city/service hierarchy on large location trees | Breadcrumbs contradicting the URL structure |
Schema is also the bridge to your Google Business Profile, which is where most emergency demand actually resolves. Only about 44% of clicks go to the top three local results in many markets, competitive metros need 40–80 reviews above 4.5 stars to enter the pack, and profiles with 100+ photos report dramatically more calls than sparse ones. Our plumbing SEO statistics breakdown covers the ranking side; this page stays on the technical layer that supports it.
Measurement gaps: the 38% flying blind
The single most alarming plumbing finding is not speed. It is that only 62% of audited plumber websites had Google Analytics or Tag Manager installed — two in five operate with no visitor data whatsoever. Alongside that, 24% do not prominently display a phone number, only 36% show an email address, 21% are missing Open Graph tags and 79% have them correctly implemented.
Because 96% of visitors leave without converting and about 92% stay anonymous, the measurement stack is not a reporting nicety — it is the only way to know which technical fix paid. A minimum viable setup is GA4 plus consent mode, call tracking with dynamic number insertion, form-submit and tap-to-call events, and server-side tagging once monthly spend justifies it. Our data intelligence practice builds exactly that layer before touching campaign budgets.
Conversion mechanics the audit keeps exposing
Technical SEO gets traffic to the page; six mechanical details decide whether it books. Typical plumbing sites convert at 1–3% while well-optimised operators reach 12–16%, against a 7.8% home-services average.
- Sticky tap-to-call: 64–80 px tall, full width, high contrast. Moves mobile conversion from 1–1.5% to 3–4%, often inside a week.
- Above-the-fold trust stack: licence, insurance, star rating and review count in the first 800 px. Specific CTA copy beats generic "Contact Us" by 20–40%.
- Service-specific landing pages: convert at 8–15% versus 1–3% for a homepage funnel, and homepage-only sites cap out around 2–3% regardless of other fixes.
- Three-field forms: each field past three costs roughly 10–15% of conversions; a seven-field form converts at 40–60% of a three-field form, and multi-step forms beat single-page by 30–50%.
- No captchas on mobile: they cut plumbing mobile conversion 15–30%.
- Speed last, but not optional: the same rebuild that fixed all five moved cost per lead from $267 to $61 on an unchanged budget.
A 90-day plumbing technical SEO sequence
Ordered by hours-to-impact, not by audit-tool severity score.
| Window | Work | Expected effect |
|---|---|---|
| Week 1 | Install GA4 + GTM + call tracking; ship sticky tap-to-call; expose phone number site-wide | Escape the 38% with no data; +1–1.5 pts conversion |
| Week 2 | Compress and resize hero imagery; defer third-party scripts; enable caching + CDN | 1.5–3 s off mobile load; LCP into the good band |
| Weeks 3–4 | Cut forms to three fields, remove captchas, add above-the-fold trust stack | +0.5–1 pt conversion; fewer mobile abandons |
| Weeks 4–6 | Valid LocalBusiness, Service, FAQPage and AggregateRating schema; fix validation errors | Rich-result eligibility; cleaner entity data for AI answers |
| Weeks 6–9 | Server-log crawl audit: kill redirect chains, 404s, duplicate city permutations; fix 304 revalidation | Crawl waste down from the 30–40% band |
| Weeks 9–13 | Build service-specific landing pages for emergency, water heater, sewer, repipe | Largest single lift: +1.5–3 pts conversion |
What plumbing technical SEO must never do
- Never ship a rebuild without analytics and call tracking live on day one — you lose the before-picture.
- Never let a chat widget auto-trigger five seconds in; it inflates INP and interrupts emergency intent.
- Never generate hundreds of thin city × service URLs to "cover" a metro; that is exactly the crawl waste pattern that eats budget and dilutes the pages that could rank.
- Never mark up ratings, hours or addresses that contradict the Google Business Profile — mismatches are worse than no schema.
- Never block AI crawlers by reflex. Search-engine bots are 26.2% of bot traffic; AI bots are 35.6% and are increasingly where "who fixes burst pipes near me" gets answered.
- Never test only on desktop broadband. The buyer is on a mid-range phone, on cellular, standing in water.
Judge all of it on booked jobs rather than audit scores — that is how we scope work at Web Tonic.
Metrics to report every month
- Mobile LCP, INP and CLS from field data (28-day rolling), plus TTI against the 1,000 ms target.
- Share of crawler requests returning 200 versus 403/404/301/429, from server logs.
- Indexation ratio: valid indexed URLs divided by submitted URLs.
- Schema validation errors outstanding, by type.
- Mobile conversion rate split by page template (home, emergency, service, city).
- Tap-to-call events and form submissions per 1,000 mobile sessions.
- Cost per booked job from organic and paid, so technical work is judged on jobs and not on scores.
Frequently Asked Questions
What is a good page load time for a plumbing website in 2026?
Aim for under 1,000 ms Time to Interactive. Across 47 audited plumber sites the average TTI was 1,660 ms with a median of 1,243 ms; the fastest site loaded in 255 ms and the slowest in 4,981 ms. Only 13% of those sites came in under 500 ms. Because 53% of mobile users abandon a page that takes longer than three seconds, and every extra second costs roughly 7% of conversions, speed is a booking metric before it is a ranking metric.
Do plumbing websites actually pass Core Web Vitals?
Most do not. Only 42% of all websites pass all three Core Web Vitals thresholds, and plumbing sites skew worse because 60% run on WordPress with render-blocking scripts and uncompressed hero imagery. LCP is the most common failure point, and INP is now the metric that separates a good mobile experience from a merely acceptable one.
Does schema markup help a plumber rank?
Schema does not directly raise rankings, but only 39% of websites use structured data at all and roughly 60% of the sites that do have at least one validation error blocking rich results. For plumbers, LocalBusiness/Plumber, Service, FAQPage and AggregateRating markup is what feeds the entity data that Google and AI assistants reuse when they answer 'emergency plumber near me' questions.
How much crawl budget does a small plumbing site really need?
For sites under roughly 1,000 URLs crawl budget is rarely the bottleneck. It becomes one when a plumbing site generates hundreds of near-duplicate city or service permutations: globally only 45.9% of crawler requests return a usable 200, 20.6% are 403s and 12.6% are redirect hops, so waste is real — it just usually lives in server logs rather than in the internal link graph.
What is the fastest technical fix that increases plumbing leads?
A sticky tap-to-call button plus hero-image compression. Sites that add a properly implemented full-width call button typically move mobile conversion from 1–1.5% to 3–4% within a week, and compressing hero images cuts 1.5–3 seconds off mobile load. Both are hours of work, not a rebuild.
Sources
Claremont Software — 47 Plumber Websites Analyzed (2026)
Searchlab — Technical SEO Statistics 2026
SEOmator — Crawl Waste Report 2026
Astra Results — Plumbing Website Conversion (2026)
Authority Specialist — Technical SEO Benchmarks 2026
PipelineOn — Home Service Marketing Benchmarks 2026
PipelineOn — Local SEO for Plumbers
Core Web Vitals — State of CWV
Digital Applied — Schema Markup Adoption Audit 2026