Table of contents

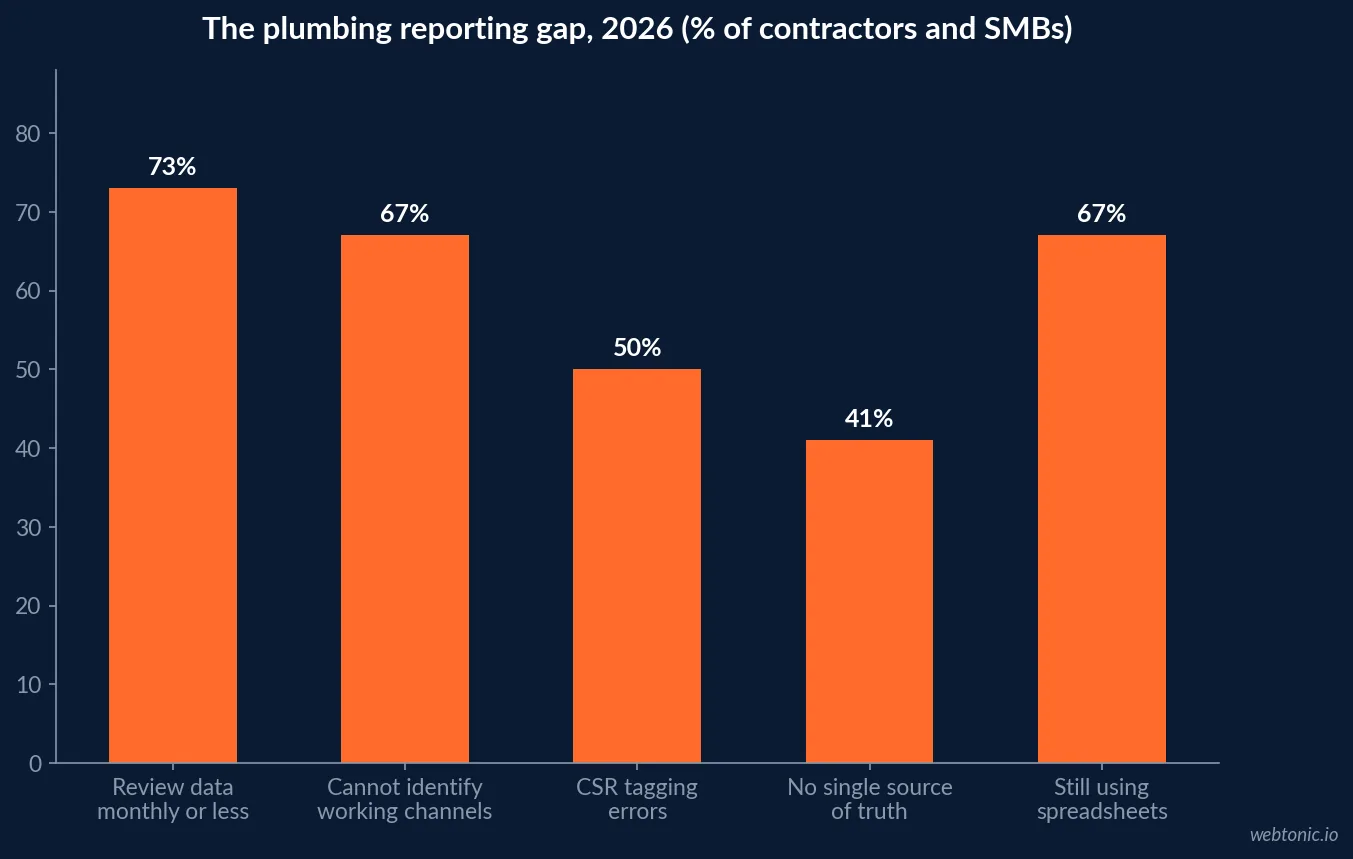
73% of home service owners review their marketing numbers monthly or less, and 41% admit they have no single source of truth for cost per lead by channel. For plumbing contractors - where one lead can mean a $150 drain clear or a $15,000 repipe - that reporting gap is expensive.
Key Takeaways
- 73% of home service owners review marketing numbers monthly or less; 41% have no single source of truth for CPL by channel (1,200 contractors).
- Moving from monthly to weekly review cuts blended CAC 15-25% within a quarter.
- 67% of home services companies struggle to identify which channels work.
- CSR call tagging is wrong 30-50% of the time in audited accounts.
- Call tracking reduces cost per lead 10-20% and lifts call lead-to-close 7%.
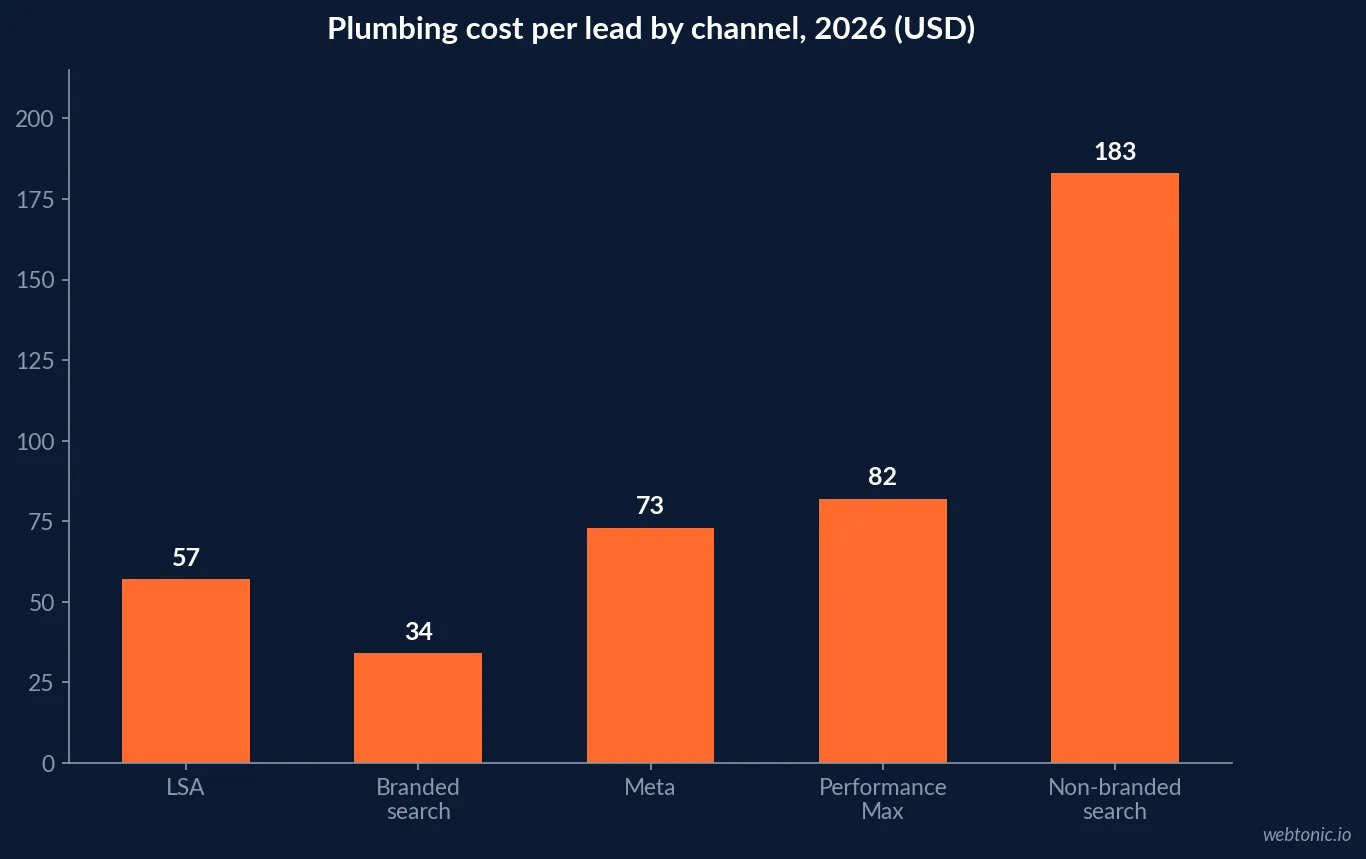
- Non-branded plumbing Google Ads CPL is $183 across 524 contractors and $14.6M of spend; Performance Max lands at $82.
- Plumbing LSA leads average $57 with a 44.5% book rate and a $1,714 ticket - a 6.85x closed ROAS.
- SMB managers spend 12.4 hours per week on manual reporting, roughly 30% of productive time.
- Manually compiled reports carry 8-12% error rates versus under 0.5% automated.
- Dashboard automation shows a 340% median first-year ROI for 5-50 employee businesses.
Plumbing reporting benchmarks at a glance
Every number below is measured on contractor accounts or SMB survey panels, not modelled.
| Metric | 2026 benchmark | Why it matters |
|---|---|---|
| Owners reviewing marketing data monthly or less | 73% | Decisions arrive after the money is spent |
| Contractors with no single source of truth for CPL | 41% | Channel comparisons are guesses |
| CAC reduction from weekly review cadence | 15-25% in a quarter | Cadence beats tooling |
| CSR call-tagging error rate | 30-50% | Manual source capture cannot be trusted |
| CPL reduction from call tracking | 10-20% | Measurement itself is an optimisation |
| Healthy booking rate on qualified inbound calls | 40-60% | Below 40% is a CSR problem, not a media problem |
| Manual reporting time, SMB managers | 12.4 hrs / week | About $30,000 per year in loaded labour |
| Median first-year ROI, dashboard automation | 340% | Payback measured in weeks, not quarters |
The reporting cadence gap
The most consequential dashboard statistic in the trades is not about tooling. Benchmark work across 1,200 contractors found 73% review their marketing numbers monthly or less, and 41% have no single source of truth for cost per lead by channel (contractor marketing dashboard research). Separately, 67% of home services companies say they struggle to understand which marketing channels are actually working, while 72% plan to increase marketing budgets in 2026 and 85% outsource at least some marketing (home services marketing statistics). Spending more through channels you cannot rank is the definition of an expensive year.
The fix is unglamorous: shops that move from monthly to weekly review cut blended customer acquisition cost 15-25% within a quarter. Nothing about the media changes - the owner simply sees a pacing problem in week two instead of week six.
The seven metrics a plumbing dashboard has to show
A working dashboard answers one question: where should the next marketing dollar go? That takes seven fields, and lead count is not one of them.
| Metric | Plumbing benchmark or target | Decision it drives |
|---|---|---|
| Cost per lead by channel | LSA $53, non-branded Google $149, Meta $73 (home services blend) | Which channel gets the next $1,000 |
| Cost per booked job by channel | Google LSA $80-$240 vs Google Search $330-$1,100 | The only fair channel comparison |
| Booking rate by channel | 40-60% healthy; emergency calls 70-80% | Separates CSR issues from media issues |
| Average ticket by channel | Drain call $250-$450 vs install $1,500-$5,500 | Reveals which channel buys the good jobs |
| Revenue attribution in dollars | Track booked-job revenue, not leads | A channel at 18% of leads can be 41% of revenue |
| Spend pacing vs budget | Weekly, per channel | Prevents month-end overspend and blackouts |
| Booked jobs by day of week | Weekly pattern | Staffing and ad scheduling |
Percentile data explains why a single blended CPL is useless. Across 465 plumbing accounts with meaningful spend, non-branded CPL ran $77 at the 10th percentile, $107 at the 25th, $168 median, $253 at the 75th and $396 at the 90th - a 5x spread (SearchLight plumbing CPL benchmark). Without percentiles on the dashboard, a contractor at $250 has no idea they are in the bottom quartile.
Plumbing channel economics worth putting on the screen
The benchmark set below is drawn from platform-level attribution data across hundreds of plumbing accounts. The pattern is consistent: paid search buys volume, Local Services Ads buy efficiency, and ticket size decides everything.
| Channel | Cost per lead | Book rate | Average ticket | Closed ROAS |
|---|---|---|---|---|
| Google LSA (plumbing) | $57 | 44.5% | $1,714 | 6.85x |
| Non-branded Google Search | $183 | ~18-25% | $1,680-$2,208 | 2.58x |
| Performance Max | $82 | 20-28% | Varies | 5.54x |
| Branded search | $34 | High | Varies | Highest, lowest volume |
| Meta / Facebook | $73 | 12-20% | Lower mix | Volume channel |
| Lead aggregators (Thumbtack/Angi) | $20-$60 | 15-20% | Lower mix | 2-4x |
Two lines matter most. First, a $50 lead closing at 10% is a $500 customer while a $150 lead closing at 40% is a $375 customer - cost per lead ranks channels wrongly almost every time. Second, the trade-level blend from $14.9M of spend across 8,077 campaigns put plumbing at $104 per lead with a 41.5% book rate and a $2,208 ticket, producing 2.72x ROAS (cost per booked job by channel, 2026). LSA analysis puts the same logic in profit terms: a plumbing company with a $650 average ticket, 55% margin and 65% booking rate produces $232 in gross profit per lead, or 4.2x true ROAS at a $55 CPL (plumbing LSA ROI benchmarks). Our plumbing Google Ads statistics breaks the paid side down further.
Why the numbers in four systems never match
Every plumbing operation of scale has at least four competing claim systems: GA4 sees the website session, call tracking sees the inbound call, the field service CRM sees the booked job, and each ad platform claims its click. Each uses a different attribution window, identifier and definition of a conversion, so they will never agree - and a prettier dashboard does not fix a definitional problem (home services attribution architecture).
The largest single leak is human. Audits of field service software reporting find CSRs select the wrong campaign, skip the source question or default to "Google" 30-50% of the time, single-touch credit is given to multi-touch journeys, and offline channels are invisible without dedicated numbers - while the analytics add-on still costs $200-$600 per month (field service marketing ROI audit). Even with those gaps the data is not worthless: if campaign A converts calls to jobs at 60% and campaign B at 25%, that difference is real.
| Attribution leak | Typical impact | Fix that works |
|---|---|---|
| CSR mis-tagging | 30-50% of calls mislabelled | Dynamic number insertion per channel, not questions |
| Multi-touch collapse | Last click takes 100% of credit | Capture GCLID/FBCLID into the CRM record |
| Untracked form fills | CRM records with no source | Share session data between form vendor and site |
| Branded calls credited to organic | Overstates SEO, understates brand | Separate branded from non-branded reporting |
| iOS conversion loss without server-side tracking | 30-50% untracked | Conversions API / server-side events |
For the modelling side of this problem, see our plumbing marketing attribution statistics; for the measurement stack itself, our plumbing analytics statistics.
What manual reporting costs a plumbing shop
The dashboard business case is usually made on decisions, but the labour arithmetic is more concrete. SMB managers spend an average of 12.4 hours per week on manual reporting - about 30% of productive work time - and at a loaded operations-manager rate of $48.50 per hour that is roughly $30,264 per year spent compiling numbers (SMB dashboard automation ROI analysis).
| Cost of manual reporting | Weekly hours | Annual cost at $48.50/hr |
|---|---|---|
| Data collection across platforms | 3.5 | $8,827 |
| Spreadsheet compilation and formatting | 4.2 | $10,594 |
| Chart creation and presentation prep | 2.1 | $5,297 |
| Report distribution and follow-up | 1.8 | $4,540 |
| Total | ~12.4 | ~$30,264 |
Accuracy compounds the loss. 67% of businesses with fewer than 50 employees still rely primarily on manual spreadsheets, 41% of those made at least one significant operational decision per quarter on data that turned out to be wrong, and manually compiled reports carry 8-12% error rates against under 0.5% for automated pipelines. Delayed access to performance data is estimated to cost small businesses 3.2% of annual revenue in missed opportunities - about $64,000 on $2M of revenue. Reported first-year ROI on dashboard automation for 5-50 employee firms sits at a 340% median, and structured real-time dashboards can cut reporting time up to 80% (SMB dashboard guide).
Tooling: what contractors actually pay
Reporting cost is not the constraint. The stack below covers almost every plumbing operation under $10M in revenue.
| Tool category | Typical 2026 cost | What it is good at |
|---|---|---|
| Free BI (Looker Studio) | $0, 1,000+ connectors | Blending ad platforms and GA4 into one view |
| Attribution-first reporting | $30-$160 / month | Lead-to-revenue tracking with source fidelity |
| Call tracking (CallRail, WhatConverts, Nimbata) | $50-$200 / month | Channel-level call attribution and recordings |
| Field service marketing add-on | $200-$600 / month | 40+ pre-built KPIs tied to booked jobs |
| Warehouse + reconciliation | Varies | Reconciling channel attribution to financial actuals |
Adoption context: dashboards are mainstream elsewhere - 67% of enterprises had adopted them by the most recent survey year, 71% of mid-market firms use them regularly, 78% of data analysts use them daily and 76% of users report faster decision-making (dashboard statistics roundup). Meanwhile 76% of analytics initiatives never connect to operational processes, and decision-first implementations hit 84% adoption in 4-6 week cycles versus 29% adoption over 18-24 months for platform-first rollouts (business analytics reporting statistics). Build the seven-metric view first; buy the platform later.
A weekly reporting routine that fits a plumbing week
Ordered by what the data says pays:
- Review weekly, not monthly. Worth 15-25% blended CAC on its own.
- Report cost per booked job, never cost per lead alone. LSA at $80-$240 per booked job against search at $330-$1,100 only shows up this way.
- Kill manual source questions. With tagging wrong 30-50% of the time, use per-channel numbers and click IDs.
- Segment by job type. A $150 drain clear and a $15,000 repipe cannot share a ROAS target.
- Watch booking rate as a CSR metric. 40-60% is healthy; emergency calls should book at 70-80%.
- Reconcile monthly to the financials. Marketing-to-CRM, then CRM-to-revenue.
- Benchmark against percentiles, not averages - the plumbing CPL spread is $77 to $396.
Contractor marketing spend benchmarks sit at 5-10% of gross revenue; below 5% is under-investment and sustained spend above 12% signals broken unit economics (contractor marketing statistics 2026). If you want the reporting layer built rather than bought, that is what our data intelligence service does.
Limits of the data
Three caveats. First, most CPL and ROAS benchmarks here are drawn from managed accounts - agencies publish their own book, which skews toward better-instrumented contractors than the market average. Second, the manual-reporting labour figures come from cross-industry SMB panels, not plumbing specifically; the hours are directionally right but a five-truck shop with one office manager will not match a $10M operation. Third, a dashboard measures, it does not close: with booking rates ranging 15-80% by channel, the largest available gain in most plumbing accounts is still CSR call handling, not the reporting layer sitting above it. Local demand capture deserves the same scrutiny - see our plumbing local SEO statistics.
Frequently Asked Questions
What should a plumbing marketing dashboard actually track?
Seven metrics carry almost all the decision weight: cost per lead by channel, cost per booked job by channel, booking rate by channel, average ticket by channel, revenue attribution in dollars rather than lead counts, spend pacing against budget, and booked jobs by day of week. Lead counts alone mislead - a channel producing 31% of leads and 9% of revenue is a channel to cut, and you cannot see that without dollar-level attribution.
How much does a plumbing marketing dashboard cost to run?
Less than most contractors assume. Looker Studio is free and connects to 1,000+ data sources; attribution-first tools such as WhatConverts run roughly $30-$160 per month; call tracking platforms sit at $50-$200 per month; and ServiceTitan Marketing Pro ships 40+ pre-built KPIs as a $200-$600 per month add-on. Against a median non-branded plumbing Google Ads spend of about $5,055 per month, a $100 per month reporting layer is under 2% of media spend.
Why do plumbing dashboards disagree with each other?
Because each system has a different definition of a conversion. GA4 sees the website session, call tracking sees the inbound call, the field service CRM sees the booked job, and the ad platforms each claim the click - with different attribution windows and identifiers. They will never agree. The workable fix is one system of record for booked revenue plus monthly reconciliation passes, not a prettier chart.
How accurate is CSR call tagging in plumbing?
Audits repeatedly find CSRs select the wrong campaign, skip the lead-source question, or default to 'Google' 30-50% of the time. That single failure mode invalidates channel-level reporting built on manual tagging, which is why dynamic number insertion, per-channel tracking numbers and click-ID capture matter more than dashboard design. Contractors who add call tracking see cost per lead fall 10-20% and call lead-to-close rates rise about 7%.
Does reviewing marketing numbers more often actually change results?
Yes, and it is the cheapest change available. Home service shops that move from monthly to weekly review typically cut blended customer acquisition cost 15-25% within a quarter, because weekly review catches pacing problems, wasted spend and booking-rate drops while the month is still salvageable. Automated dashboards also recover the reporting time itself - SMB managers average 12.4 hours per week on manual reporting.
Sources
PipelineOn - essential contractor marketing dashboard, 2026
PipelineOn - cost per booked job by channel, 2026
PipelineOn - marketing attribution for home service businesses
SearchLight Digital - plumbing Google Ads CPL benchmark, 524 contractors
BlueGrid Media - plumbing LSA ROI benchmarks 2026
Rivet - tracking marketing ROI in field service software
Sheppard CG - marketing attribution for home services
Click Vision - home services marketing statistics 2026
US Tech Automations - SMB dashboard automation ROI analysis
Business analytics and reporting statistics, 2025-2026
Gitnux - 2026 dashboard statistics
Elev8 Operations - contractor marketing statistics 2026
GeoGrowth Media - why build a marketing dashboard, SMB guide