



Table of contents
Key Takeaways
- Average CPC for plumbing keywords on Google Ads is $8.45, with emergency-related terms like "emergency plumber near me" reaching $25–$45 per click.
- Non-branded search campaigns produce a $183 average CPL based on $14.6M in tracked spend across 524 contractors in Q1 2026.
- Performance Max delivers leads at $82 each — 55% cheaper than non-branded search — with a 5.54× ROAS, more than double the search-only return.
- Local Service Ads average $57 per lead with a 44.5% book rate, making them the most efficient paid channel for residential pipe-work contractors.
- The median contractor spends $5,055 per month on non-branded search, with a median price per paying customer of $333.
- Conversion rate for the trade averages 6.1–11.3%, above the 7.5% cross-industry average, driven by high-intent local queries.
- The typical contractor in the SearchLight dataset spent $14,206/month on all Google advertising across pipe-work, HVAC, electrical, branded, and general trade campaigns.
| Google Ads Metric | Plumbing Benchmark | Home Services Average |
|---|---|---|
| Avg. CPC | $8.45 | $6.50 |
| Avg. CPL (Non-Branded Search) | $183 | $150 |
| Avg. CPL (Performance Max) | $82 | $75 |
| Avg. CPL (Local Service Ads) | $57 | $53 |
| Conversion Rate | 6.1–11.3% | 7.5% |
| ROAS (Non-Branded Search) | 2.58× | 3.0× |
| ROAS (Local Service Ads) | 6.85× | 7.84× |
| Median Monthly Spend | $5,055 | $4,500 |
Cost Per Click Breakdown by Keyword Category
CPC in the pipe-work vertical varies dramatically by keyword intent and competition level. The industry-wide average CPC sits at $8.45 according to PPC Chief's 2026 benchmark dataset, but that average masks significant variation across keyword categories (PPC Chief).
High-intent emergency keywords command the steepest prices. "Emergency plumber near me" averages $25–$45 per click in competitive metro areas, while service-specific terms carry more moderate pricing:
- "Plumber near me" — average CPC $18–$32, highest search volume across the category
- "Drain cleaning service" — average CPC $14–$28, strong intent signal with moderate competition
- "Water heater repair" — average CPC $22–$40, high average ticket value justifies the premium
- "Sewer line inspection" — average CPC $15–$30, growing demand category
- "[Company name] + [city]" branded — average CPC $1–$3, lowest competition by far
Well-optimized accounts can achieve 20–40% lower expenses than the industry average through aggressive negative keyword management, Quality Score improvement, and smart bid strategies (PPC Chief). Contractors spending $5,000+/month on paid search who invest in landing page optimization and conversion tracking consistently outperform those who set and forget their campaigns.
CPL by Campaign Type
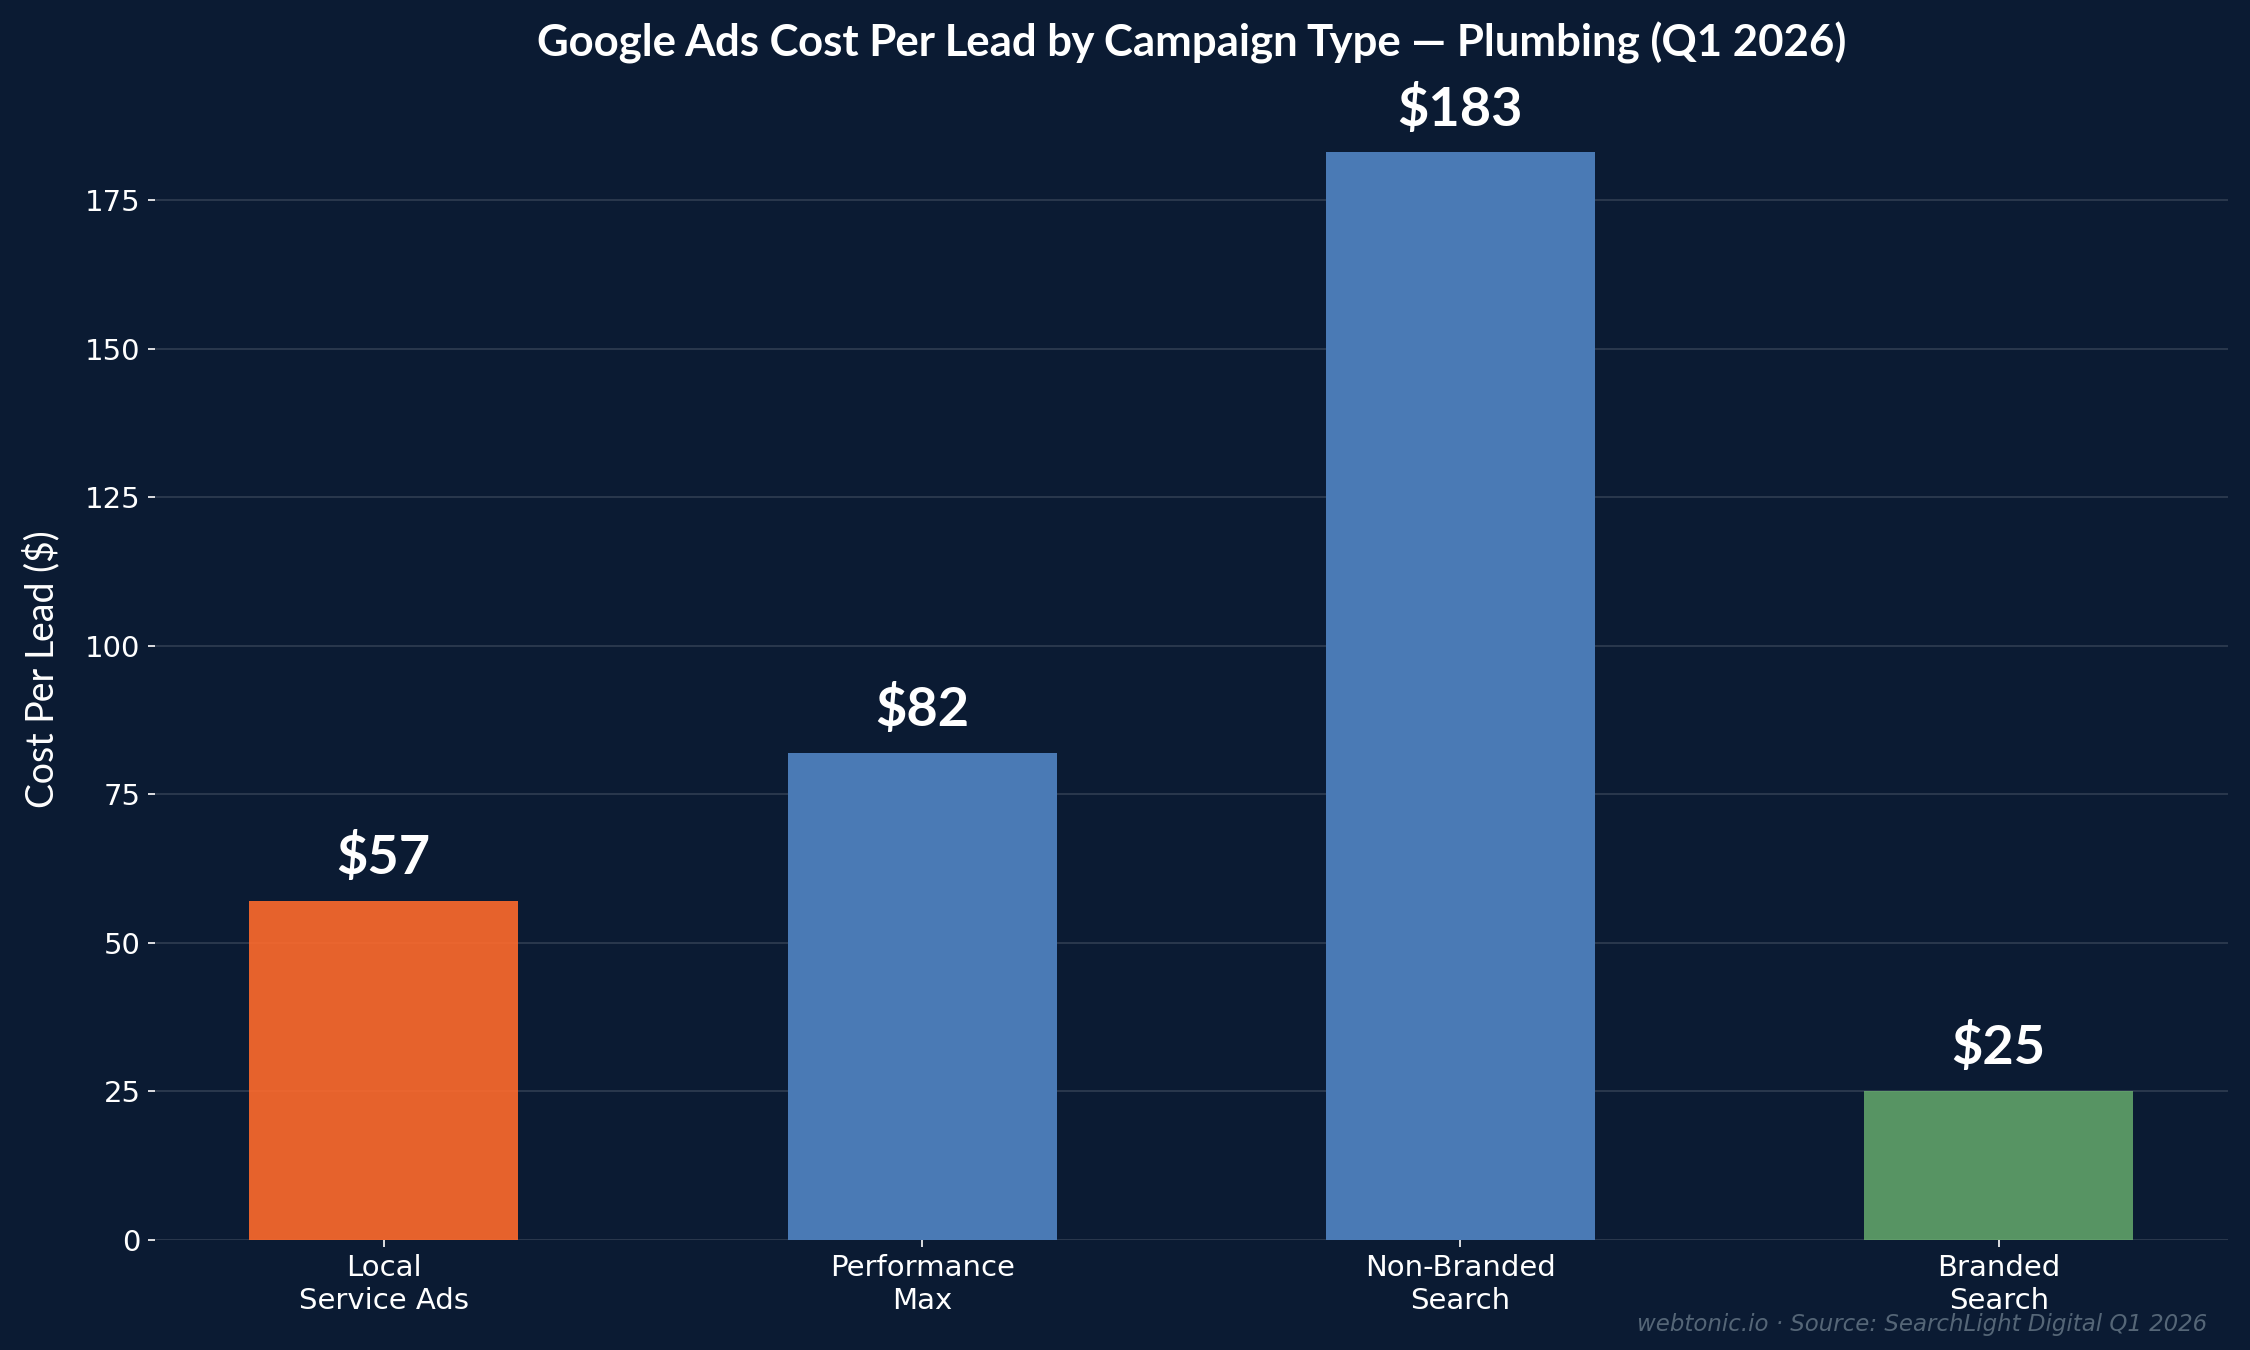
The SearchLight Digital revenue attribution platform tracked $14.6M in non-branded spend across 524 pipe-work contractors and 2,554 non-branded and PMax campaigns from January through March 2026, providing the most granular CPL data available for the trade (SearchLight Digital).
| Campaign Type | CPL | Accounts | Spend | Median Mo. Spend | ROAS |
|---|---|---|---|---|---|
| Non-Branded Search | $183 | 524 | $14.6M | $5,055 | 2.58× |
| Performance Max | $82 | 169 | $1.3M | $1,856 | 5.54× |
| Local Service Ads | $57 | 230 | $2.03M | N/A | 6.85× |
PMax delivers prospects at $82 each — 55% less expensive than non-branded search — with a 5.54× ROAS that more than doubles the search-only return. However, this data comes with an important caveat: SearchLight could not differentiate branded PMax from non-branded PMax, so the lower expense likely includes some brand traffic inflation. The median PMax adopter allocates $1,856 per month to this format, and PMax volume remains limited compared to traditional search.
At $183 per non-branded search inquiry, the median contractor needs roughly $333 in spend to acquire one paying customer, factoring in the inquiry-to-customer conversion rate. For a $1,714 average ticket (the LSA benchmark), that translates to roughly 5× return on the advertising dollar before accounting for repeat business and referrals.
Local Service Ads Performance
Local Service Ads have become the most efficient paid channel for residential pipe-work firms. LSA averages $57 per lead with a 44.5% book rate, producing a price per booked job of approximately $128–$168 and a 6.85× closed ROAS based on $2.03M in observed spend across 230 accounts (SearchLight Digital).
The Google Guaranteed badge — which requires an active master plumber license, $1M–$2M general liability insurance, and a background check — increases click-through rates by 38% compared to standard text promotions (PipelineOn). LSA ranking is driven by three factors:
- Review volume and recency — shops with 100+ reviews and weekly new review flow rank highest
- Responsiveness — answering within 30 seconds or returning missed calls within 5 minutes improves ranking signals
- Geographic proximity — closer proximity to the searcher produces higher placement
Pipe-work CPL through LSA trails only electrical ($39) in the home-service LSA landscape, and outperforms drain/sewer ($59) and water heater ($71) as standalone categories. Companies running both LSA and traditional search simultaneously report 22% more total inquiries than those using either channel alone.
Conversion Rates and Quality Score Data
The average conversion rate for the pipe-work vertical on paid search is 6.1%, with well-optimized accounts pushing past 11.3% (PPC Chief). Both figures sit above the 7.5% cross-industry average, reflecting the high-intent nature of queries in this sector — someone searching "water heater repair near me" at 2 AM is not browsing; they are buying.
Quality Score has an outsized impact on both CPC and conversion rates in this competitive space. Typical campaigns waste approximately 26% of spend on poor targeting — irrelevant queries, broad match leakage, and geographic overshoot. Contractors who invest in strategic campaign structure and landing page relevance achieve 20–40% lower expenses at the same or higher conversion rates.
| Optimization Factor | Below Average | Average | Top Performers |
|---|---|---|---|
| Conversion Rate | 2–4% | 6.1% | 11–15% |
| CPC Relative to Benchmark | +30–50% | $8.45 | -20–40% |
| Waste Rate | 35–50% | 26% | 8–15% |
| CPL | $250+ | $183 | $90–$130 |
| Negative Keyword List Size | <50 | 100–200 | 500+ |
ROAS and Revenue Attribution
Return on ad spend varies dramatically by channel type and campaign sophistication. Non-branded search delivers a 2.58× ROAS, meaning every dollar invested returns $2.58 in attributed revenue. PMax more than doubles that figure at 5.54×, and LSA reaches 6.85× — making it the most efficient paid channel for the sector.

The key metric connecting CPL to profitability is the average ticket per paying customer. For the pipe-work vertical, the LSA benchmark shows a $1,714 average ticket. At a $57 CPL with a 44.5% book rate, that translates to roughly $128 invested per booked job generating $1,714 in revenue — a highly favorable ratio for most contractors (SearchLight Digital).
Contractors should measure price per paying customer, not just CPL, to evaluate true channel performance. A $183 inquiry that converts to a $1,714 job at a 55% close rate produces a $333 acquisition expense — still under 20% of the ticket value, well within healthy margins for most firms in the space.
Budget Allocation and Spend Benchmarks
The typical contractor in the SearchLight dataset invested $14,206/month across all channels — including pipe-work, HVAC, electrical, branded, and general trade initiatives. For pipe-work non-branded search alone, the median monthly investment was $5,055 (SearchLight Digital).
Optimal allocation for a residential pipe-work shop depends on maturity and growth targets:
| Channel | Recommended Share | Expected CPL | Expected ROAS |
|---|---|---|---|
| Local Service Ads | 25–35% | $57 | 6.85× |
| Non-Branded Search | 35–45% | $130–$183 | 2.5–4.0× |
| Performance Max | 15–25% | $82 | 5.54× |
| Branded Search | 5–10% | $15–$25 | 12×+ |
Shops spending under $3,000/month should start with LSA + branded search only before layering in non-branded terms. LSA provides the best efficiency at low volumes, while branded search defends against competitors bidding on your company name. Firms investing $5,000–$15,000/month should run all four initiative types with aggressive negative keyword management and regular account optimization.
Seasonal Trends and Demand Patterns
Pipe-work paid search demand follows predictable seasonal patterns that directly impact CPC and CPL:
- Winter (December–February) — emergency demand spikes for frozen pipe repairs and water heater failures; CPCs increase 15–25% above annual averages
- Spring (March–May) — remodeling and inspection season drives moderate demand; CPCs normalize to annual averages
- Summer (June–August) — water line and sewer work increases; moderate demand with stable pricing
- Fall (September–November) — pre-winter preparation and maintenance; lowest CPCs of the year, 10–15% below average
Savvy contractors adjust their paid search investments seasonally — pulling spend forward into fall when CPCs are lowest and building brand awareness through pipe winterization promotions. Emergency keywords during winter carry the highest expense but also the highest conversion rates (8–12%) and largest average tickets ($800–$2,500 for emergency calls versus $350–$600 for routine work).
65% of firms in the sector use paid search advertising, with 40% of their ad allocation going to location-specific initiatives (Zipdo). This local focus reflects the reality that pipe-work is inherently a proximity business — homeowners overwhelmingly hire the closest qualified contractor who answers the phone.
Comparing Paid Search to Other Channels
Understanding how paid search fits within the broader marketing mix helps contractors allocate their budgets effectively. The data shows that no single channel dominates across all metrics:
- Paid Search delivers the highest volume of high-intent inquiries but at the steepest per-inquiry expense ($82–$183)
- LSA provides the best price-per-booked-job ratio ($128–$168) with a built-in trust signal via the Guaranteed badge
- SEO delivers the lowest ongoing CPL ($25–$45) but requires 6–12 months to produce results and significant upfront content investment
- Meta (social) offers cheap traffic ($0.90 CPC) but low-intent prospects with $280–$520 per booked job for standard work
- Email marketing generates the highest ROI per dollar ($36–$42) but only works with an existing customer list
The most successful contractors run a multi-channel approach: LSA for volume efficiency, non-branded search for competitive positioning, PMax for AI-optimized reach, and SEO for long-term acquisition expense reduction. Firms that run both LSA and traditional search simultaneously report 22% more total inquiries than single-channel operators (PipelineOn).
FAQ
What is the average CPC for plumbing on Google Ads?
The average CPC for the pipe-work vertical is $8.45, though actual expenses range from $1–$3 for branded terms up to $25–$45 for emergency keywords in competitive metro areas. Well-optimized accounts achieve 20–40% lower expenses than these averages through Quality Score improvements and strategic bid management.
What is a good CPL for plumbing paid search?
A good CPL depends on the initiative type. LSA averages $57, PMax averages $82, and non-branded search averages $183 based on SearchLight Digital's Q1 2026 data across 524 contractors. Top-performing accounts achieve $90–$130 on non-branded search through aggressive optimization.
Are Local Service Ads worth it for contractors?
Yes — LSA is the most efficient paid channel for residential pipe-work firms. At $57 per inquiry with a 44.5% book rate, the price per booked job comes to approximately $128–$168. The Google Guaranteed badge builds immediate trust, and ROAS averages 6.85× across the category.
How much should a contractor spend monthly on paid search?
The median contractor allocates $5,055/month on non-branded search, with total monthly advertising investment averaging $14,206 across all channels. Shops under $3,000/month should start with LSA + branded search only. Firms investing $5,000–$15,000/month can run all four initiative types effectively.
What ROAS should contractors expect from paid search?
Non-branded search delivers a 2.58× ROAS, PMax achieves 5.54×, and LSA reaches 6.85×. These figures are based on Q1 2026 data from 524 pipe-work contractors. Branded search typically achieves 12× or higher, as those queries come from prospects already familiar with the company.
Sources
https://searchlightdigital.io/plumbing-google-ads-cost-per-lead/
https://ppcchief.com/google-ads-benchmarks/plumbing
https://searchlightdigital.io/google-local-service-ads-cost-per-lead/
https://pipelineon.com/blog/local-service-ads-plumbing/
https://pipelineon.com/blog/plumbing-marketing/
https://zipdo.co/marketing-in-the-plumbing-industry-statistics/
https://www.wordstream.com/blog/2026-google-ads-benchmarks
https://www.servicetitan.com/blog/plumbing-industry-statistics
https://authorityspecialist.com/industry/plumbing/


