



Table of contents
The U.S. plumbing services industry reached $191.4 billion in market size in 2026, and the contractors winning in this market are the ones tracking granular operational data — from quote conversion rates to revenue per employee metrics that separate top performers from the rest.
Key Takeaways
- The U.S. plumbing industry market size is $191.4 billion in 2026, making it one of the largest segments within the broader home services sector (IBISWorld, 2026).
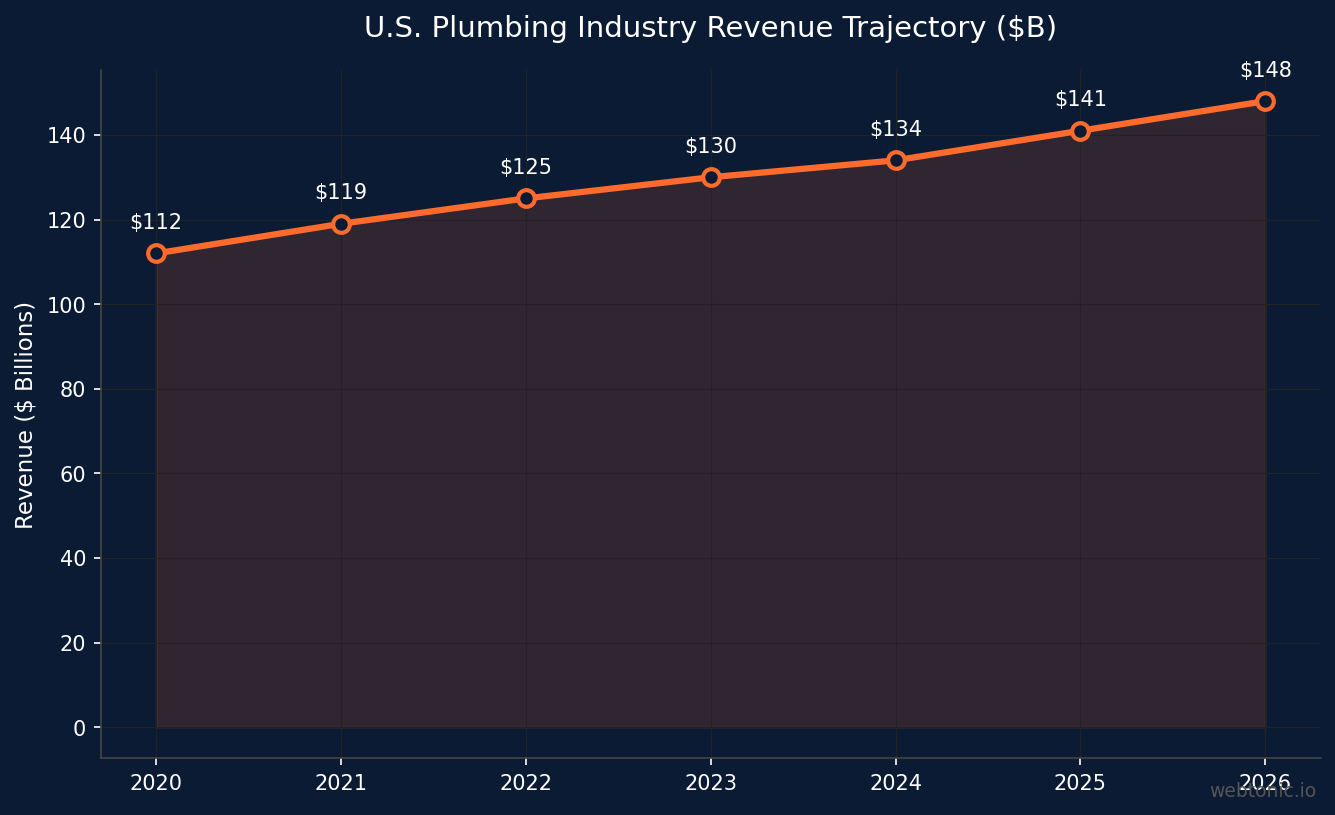
- Plumbing services generate approximately $134 billion in annual revenue across residential, commercial, and new construction segments, employing roughly 486,000 plumbers nationwide (CallJolt, 2026).
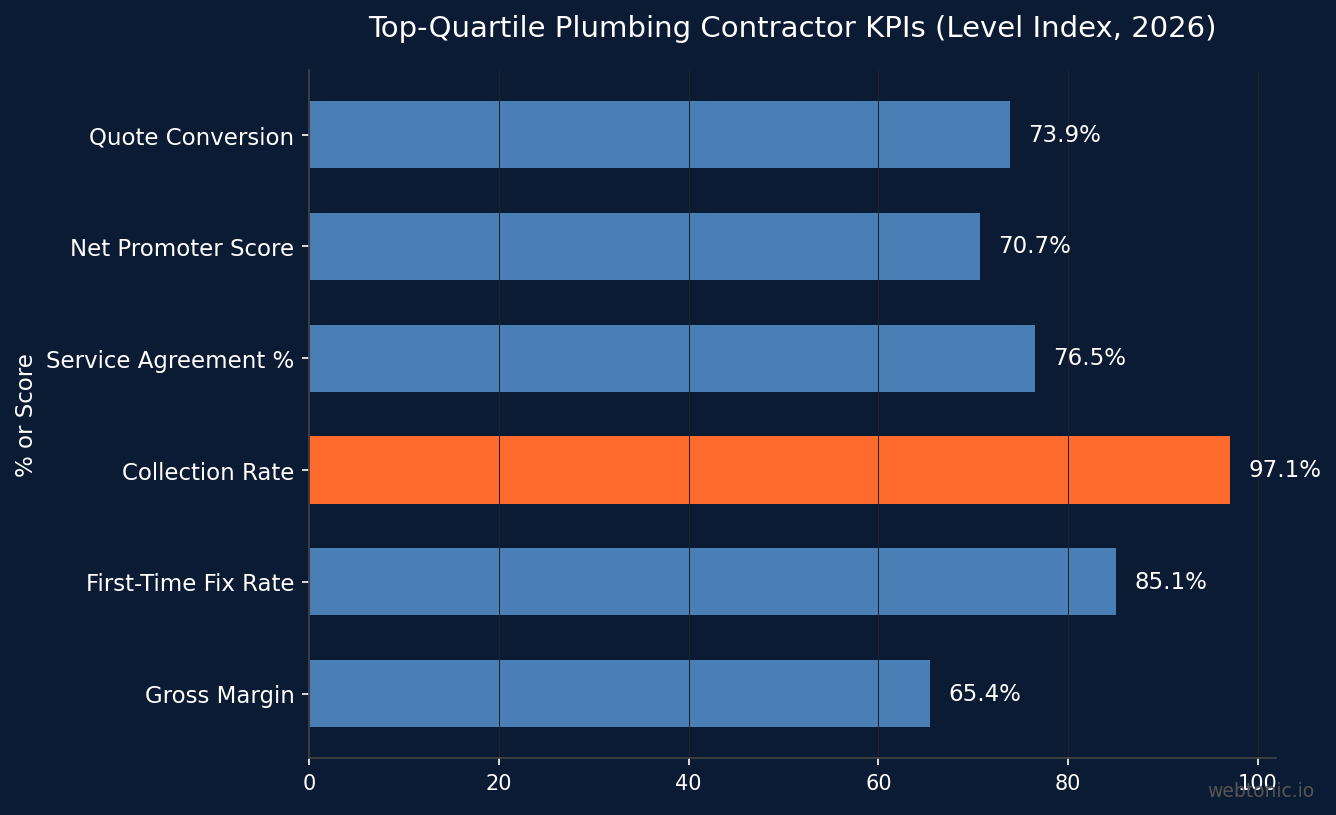
- Top-quartile plumbing contractors achieve a 73.9% quote conversion rate, compared to just 61.3% for the median — a 12.6-point gap worth six figures in annual revenue for a mid-sized operation (Level Index, 2026).
- The global MEP (mechanical, electrical, plumbing) services market is projected to reach $239.41 billion by 2030, growing at a 6.78% CAGR from a 2025 base of $172.46 billion (Mordor Intelligence).
- Top-performing plumbing companies generate $64,100 in service agreement revenue per employee, while bottom-quartile firms manage only $5,900 — an 11× performance gap (Level Index, 2026).
- Plumbing businesses average a $4,148 average job ticket with a 65.4% gross margin at the median, according to data from 276 plumbing companies in the Level Index benchmarking study.
Plumbing Industry Market Data at a Glance
| Metric | Value | Source |
|---|---|---|
| U.S. plumbing industry size (2026) | $191.4B | IBISWorld |
| U.S. plumbing services revenue | $134B | CallJolt |
| Number of U.S. plumbers | 486,000 | CallJolt |
| Global MEP market (2025) | $172.46B | Mordor Intelligence |
| Global MEP market (2030 projected) | $239.41B | Mordor Intelligence |
| MEP services CAGR | 6.78% | Mordor Intelligence |
| Plumbing companies in Level Index | 276 | Level CFO |
| Avg. job ticket (plumbing) | $4,148 | Level CFO |
| Median gross margin | 65.4% | Level CFO |
| Top-quartile quote conversion | 73.9% | Level CFO |
U.S. Plumbing Industry Revenue Growth
IBISWorld estimates the U.S. plumbing industry at $191.4 billion in 2026, encompassing residential service and repair, commercial plumbing, new construction, and specialty segments like fire suppression and water treatment (IBISWorld, 2026). CallJolt's 2026 analysis narrows the services-only segment to approximately $134 billion in annual revenue, with 486,000 active plumbers across the country.
The growth trajectory has been steady. Infrastructure spending mandates, aging housing stock (median U.S. home age now exceeds 40 years), and water-efficiency retrofit demand continue to push revenue upward. The global picture is even more aggressive — the MEP services market is forecast to grow from $172.46 billion in 2025 to $239.41 billion by 2030, a 6.78% compound annual growth rate that reflects rising demand across Asia Pacific and North America.
Key Performance Indicators for Plumbing Contractors
The Level Index — built from operational records of 2,200+ contractor companies including 276 plumbing firms — provides the most granular benchmarking dataset available for the trade. The performance gaps between quartiles are striking:
| KPI | Bottom Quartile | Median | Top Quartile | Top Decile |
|---|---|---|---|---|
| Quote Conversion Rate | 31.8% | 61.3% | 73.9% | 81.3% |
| Net Promoter Score | 68.8 | 70.7 | 85.1 | 92.7 |
| SA Revenue per Employee | $5,900 | $11,400 | $28,500 | $64,100 |
| Service Agreement Attach Rate | 0.3% | 76.5% | 90.1% | 97.1% |
| Collection Rate | — | — | 97.1% | 99.6% |
| Gross Margin | — | 65.4% | ~70% | — |
The most actionable metric is service agreement revenue per employee. Top-decile plumbing firms generate $64,100 per employee from recurring service agreements, while bottom-quartile firms manage just $5,900 — an 11× gap that compounds across every technician on the roster. Tracking this metric monthly and tying it to data intelligence dashboards is a prerequisite for scaling beyond the owner-operator stage.
Marketing and Lead Tracking Metrics
Lead tracking is the only way to connect ad spend to actual revenue — a principle that PlumbingSEO Agency emphasizes as the foundational layer of plumbing marketing analytics. Without tracing booked jobs back to individual clicks, every optimization decision is a guess.
The data supports this assertion. Plumbing contractors using Google Ads with proper call tracking and CRM integration report a cost per booked job of approximately $300 when all channels are aggregated. Those without tracking typically overestimate their cost per acquisition by 30–40% because they cannot distinguish repeat customers from new leads or organic inquiries from paid clicks.
Avoca AI reports that plumbing businesses using their call analytics platform see measurable improvements in booking rates and lead conversion by monitoring every call, text, and chat interaction. The combination of call recording, sentiment analysis, and automated lead scoring gives dispatchers real-time insight into which technicians convert at the highest rate — and which marketing channels produce the highest-intent callers.
Regional Market Analysis
| Region | Market Contribution | Growth Driver | Avg. Job Ticket |
|---|---|---|---|
| North America | Largest market | Aging infrastructure, retrofit demand | $4,148 |
| Asia Pacific | Fastest-growing | Urbanization, new construction | $2,800–$3,500 |
| Europe | Mature, stable | Water-efficiency regulations | $3,200–$4,000 |
| Middle East & Africa | Emerging | Smart city development | $3,500–$4,200 |
| Latin America | Developing | Housing expansion | $1,800–$2,500 |
Best Practices for Plumbing Business Analytics
- Track cost per booked job, not just cost per lead — a $129 CPL means nothing if only 41.5% of leads convert to jobs. The true acquisition cost is $300+ per booked job on Google Ads.
- Benchmark quote conversion rate monthly — top-quartile firms close 73.9% of quotes. If your rate is below 60%, the issue is pricing presentation or follow-up speed, not lead quality.
- Monitor service agreement attach rate as a growth metric — recurring revenue from service agreements is the single strongest predictor of company valuation. Top-decile firms attach agreements to 97.1% of customers.
- Implement call tracking with recording across all channels — without call-level attribution linking Meta Ads and search campaigns to booked jobs, budget allocation decisions are based on incomplete information.
- Track revenue per employee quarterly — the 11× gap between top and bottom performers ($64,100 vs $5,900 SA revenue per employee) reveals where operational improvements will compound fastest.
- Use field service management software with integrated reporting — platforms like ServiceTitan, Housecall Pro, and Jobber centralize job costing, technician performance, and marketing ROI in a single dashboard.
- Audit gross margin by service category — the median 65.4% gross margin masks wide variation between drain cleaning (higher margin) and new construction (lower margin). Category-level analysis reveals where to focus marketing spend.
Workforce and Labor Market Data
The United States employs approximately 486,000 plumbers as of 2026, according to CallJolt's industry analysis. The Bureau of Labor Statistics projects continued demand growth, driven by retirement attrition (an estimated 15–20% of the current workforce is over 55) and new construction activity that outpaces the apprenticeship pipeline.
Labor shortages directly impact pricing and profitability. Markets with acute plumber shortages see average hourly billing rates 20–35% above the national median, creating a natural tailwind for companies that can recruit and retain technicians. Top-performing firms in the Level Index data invest 3–5% of revenue in recruitment and training, treating labor acquisition with the same analytical rigor as customer acquisition.
The revenue-per-employee metric underscores this dynamic. Top-decile plumbing companies generate $150,500 in total revenue per employee, while bottom-quartile firms produce just $5,900 per employee from service agreements alone. This 11× gap reflects differences in routing efficiency, upsell training, and service agreement attachment — all of which are measurable through field service management analytics platforms.
Technology Adoption in Plumbing Businesses
Field service management (FSM) software adoption is the clearest predictor of whether a plumbing company operates on data or intuition. Platforms like ServiceTitan, Housecall Pro, and Jobber centralize dispatching, invoicing, customer history, and marketing attribution in a single dashboard. Companies using FSM software report 15–25% higher revenue per technician compared to those managing operations through spreadsheets or paper-based systems.
Call tracking integration has become table stakes for data-driven plumbing companies. Dynamic number insertion (DNI) links every inbound call to its marketing source — whether Google Ads, organic search, direct mail, or a yard sign. Without DNI, a plumbing company cannot calculate true cost per acquisition by channel, making budget allocation decisions arbitrary rather than evidence-based.
The most analytically mature plumbing businesses layer CRM data, call recordings, and job costing into unified dashboards that update in real time. This integration reveals metrics invisible to basic reporting: which zip codes produce the highest-ticket jobs, which service types have the shortest sales cycles, and which technicians generate the most repeat business. The investment in analytics infrastructure — typically $500–$2,000 per month for a mid-sized operation — pays for itself through improved close rates, optimized routing, and targeted marketing spend.
Plumbing Industry Segment Breakdown
| Segment | Revenue Share | Avg. Ticket | Growth Trend |
|---|---|---|---|
| Residential Service & Repair | 45–50% | $350–$2,500 | Steady (3–4% YoY) |
| Commercial Plumbing | 25–30% | $5,000–$50,000+ | Growing (5–6% YoY) |
| New Construction | 15–20% | $8,000–$25,000 | Cyclical (tied to housing starts) |
| Specialty (Water Treatment, Fire Suppression) | 5–10% | $3,000–$15,000 | Fast-growing (7–9% YoY) |
The residential service and repair segment accounts for 45–50% of industry revenue and is the primary battleground for digital marketing and analytics investment. This segment benefits most from call tracking, review management, and real-time dispatching — the operational layers where analytical maturity creates the widest competitive advantage. Commercial and new construction segments rely more heavily on relationship selling and bid processes, though Google Ads targeting for commercial plumbing keywords is growing rapidly.
Related reading
- Mold Removal Analytics Statistics (2026): Benchmarks & Trends
- Painting Analytics & Tracking Statistics: 2026 Attribution, ROI & KPI Benchmarks
- PI Law Analytics Stats 2026 | Web Tonic™
- Marketing Analytics services at Web Tonic
Frequently Asked Questions
How big is the U.S. plumbing industry in 2026?
The U.S. plumbing industry is valued at $191.4 billion in 2026 according to IBISWorld. The services-only segment generates approximately $134 billion in annual revenue across residential, commercial, and new construction, employing about 486,000 plumbers nationwide.
What is the global plumbing market growth rate?
The global MEP (mechanical, electrical, and plumbing) services market is projected to grow at a 6.78% CAGR from $172.46 billion in 2025 to $239.41 billion by 2030, driven by urbanization in Asia Pacific and infrastructure upgrades in North America.
What KPIs should plumbing companies track?
The most important KPIs for plumbing businesses include quote conversion rate (top quartile: 73.9%), service agreement revenue per employee (top decile: $64,100), collection rate (top quartile: 97.1%), gross margin (median: 65.4%), and Net Promoter Score (top quartile: 85.1). The Level Index benchmarking study provides quartile breakdowns from 276 plumbing companies.
What is the average job ticket for plumbing services?
Plumbing businesses average a $4,148 job ticket according to Level CFO data from 276 plumbing companies. This varies significantly by service type — emergency repairs and water heater replacements tend to carry higher tickets than routine drain cleaning or fixture installations.
How does lead tracking improve plumbing business performance?
Lead tracking connects marketing spend to actual booked jobs, revealing the true cost per acquisition of approximately $300 on Google Ads. Without call tracking and CRM integration, contractors typically overestimate their acquisition cost by 30–40% because they cannot distinguish new leads from repeat customers or organic inquiries from paid clicks.
Sources
IBISWorld — Plumbers in the US Industry Analysis 2026
CallJolt — Plumbing Industry Statistics 2026
Level CFO — The Level Index: 2,200 Contractors Benchmarked
Level CFO — Contractor Benchmarks 2026
Mordor Intelligence — MEP Services Market
PlumbingSEO Agency — Lead Tracking for Plumbers
Avoca AI — Plumbing Call Analytics
Applause — 2026 State of Home Services Benchmark Report
Contractor Bear — Plumber Marketing Budget 2026


