



Table of contents

Key Takeaways
- 85% of plumbing companies now invest in at least one digital marketing channel, up from 68% in 2023, with Google Ads and local SEO leading adoption.
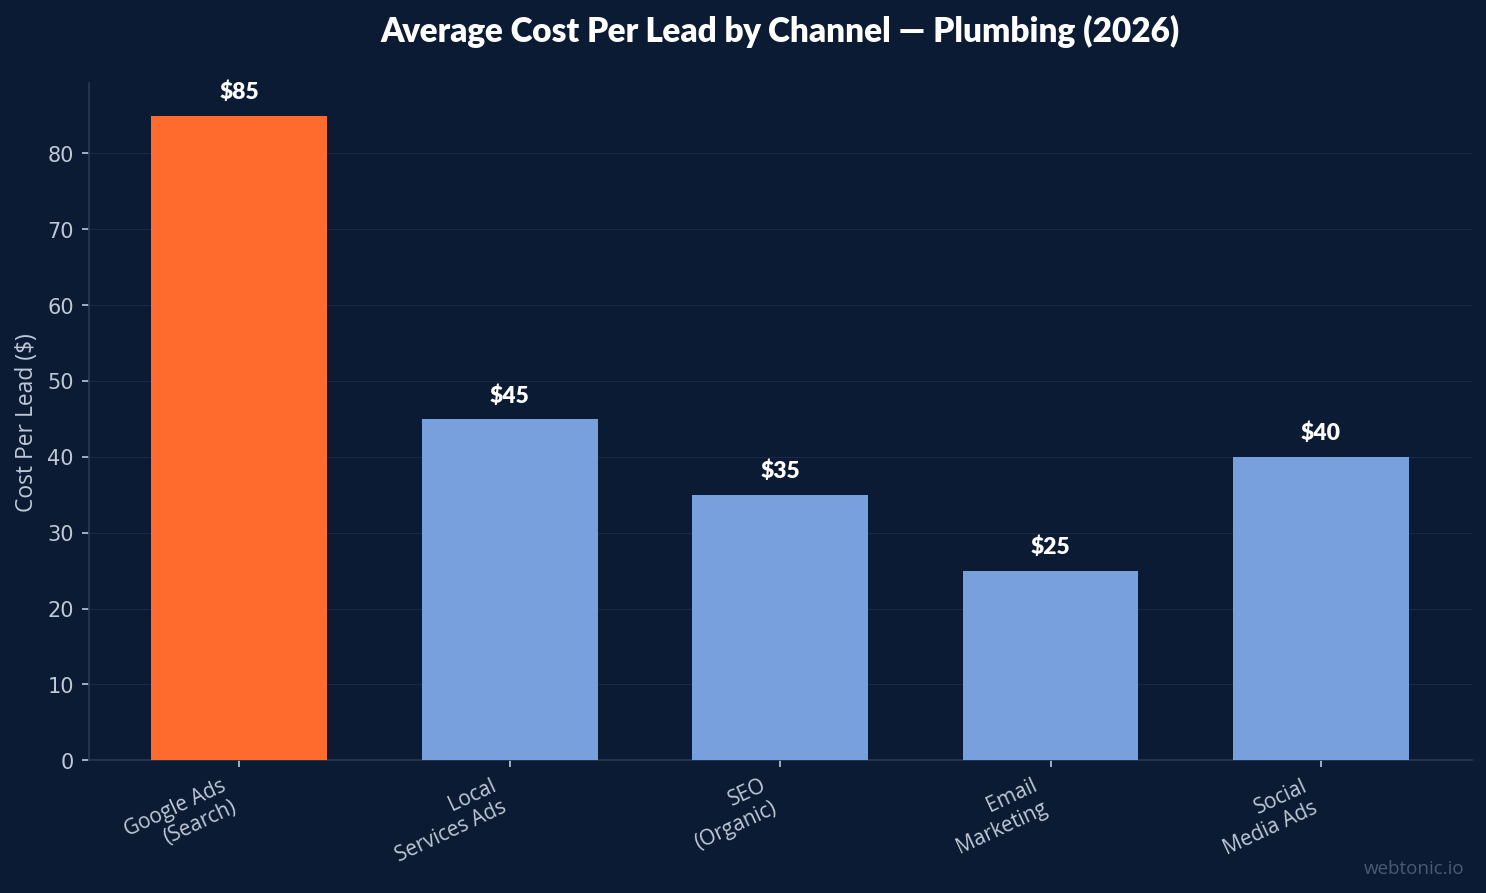
- Average cost per lead for plumbing companies ranges from $25 to $85 depending on the channel, with SEO delivering the lowest CPL at $25–$45.
- Google Ads average CPC for plumbing keywords is $12–$35, with emergency-related terms like "emergency plumber near me" reaching $45–$75.
- 97% of consumers search online before hiring a local plumber, making digital visibility a non-negotiable for plumbing businesses.
- Plumbing companies with optimized Google Business Profiles generate 4.2× more calls than those with basic or unverified listings.
- The average plumbing company allocates 7–12% of revenue to marketing, with top-performing firms spending 10–15% and achieving 5–8× ROI.
- Social media marketing generates brand awareness for 64% of plumbing companies, though direct lead attribution remains under 8% of total leads.
| Digital Marketing Metric | Plumbing Benchmark | Home Services Average |
|---|---|---|
| Avg. Cost Per Lead (all channels) | $25–$85 | $30–$90 |
| Google Ads Avg. CPC | $12–$35 | $10–$40 |
| SEO Cost Per Lead | $25–$45 | $20–$50 |
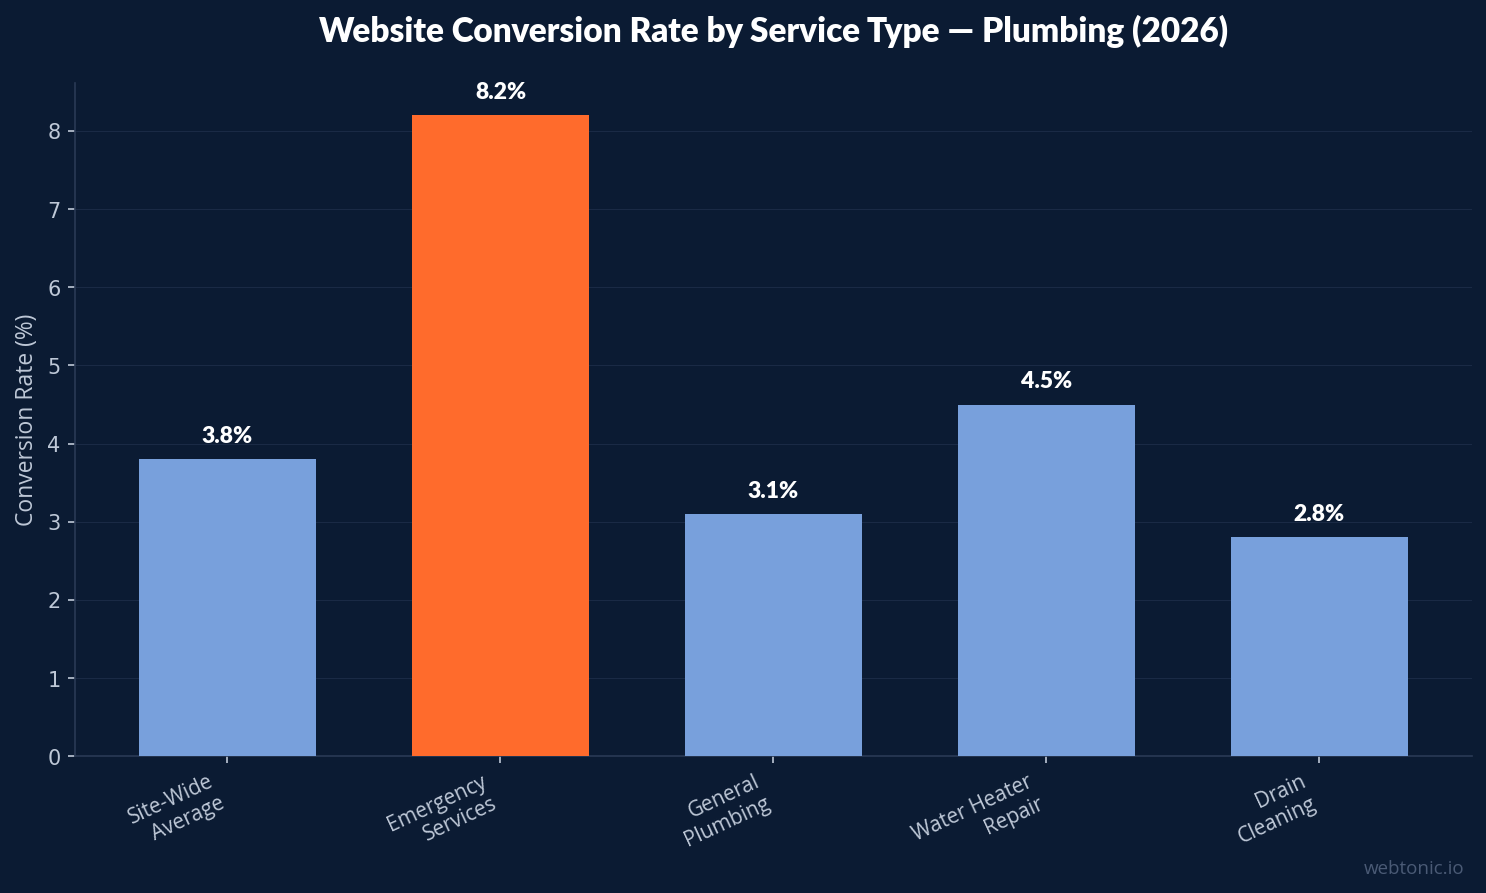
| Website Conversion Rate | 3.8% | 3.3% |
| Google Business Profile CTR | 7.6% | 5.8% |
| Marketing Budget (% of Revenue) | 7–12% | 6–10% |
| Online Reviews (avg. top-3 firm) | 120+ | 85+ |
Digital Marketing Spend and Budget Allocation
Plumbing companies are steadily increasing their digital marketing investments as traditional channels lose effectiveness. The average plumbing business allocates 7–12% of gross revenue to marketing, with digital channels now commanding 65–80% of that budget (ServiceTitan). Top-performing plumbing companies — those growing revenue by 15% or more annually — typically invest 10–15% of revenue in marketing and report 5–8× return on investment.
Budget allocation varies significantly by company size and service area. Solo plumbers and small shops (under $500K revenue) average $1,500–$4,000 per month on digital marketing, while mid-size plumbing companies ($1M–$5M revenue) invest $5,000–$15,000 monthly. The most effective allocation for plumbing businesses follows a channel-diversified approach:
| Marketing Channel | Recommended Budget Share | Expected CPL |
|---|---|---|
| Google Ads (Search + LSA) | 35–45% | $35–$85 |
| SEO and Content Marketing | 20–30% | $25–$45 |
| Social Media (Organic + Paid) | 10–15% | $40–$75 |
| Email Marketing and CRM | 5–10% | $15–$30 |
| Website and Conversion Optimization | 10–15% | Indirect |
Google Ads commands the largest share of plumbing marketing budgets at 35–45%, reflecting the platform's ability to capture high-intent, ready-to-book customers. However, SEO delivers the best long-term ROI, with plumbing companies investing in organic search for 12+ months seeing a 40% reduction in overall customer acquisition cost.
Google Ads Performance for Plumbing Companies
Google Ads remains the primary lead generation engine for plumbing businesses, particularly for emergency and same-day service requests. The average CPC for plumbing keywords ranges from $12 to $35, with significant variation by keyword type and market competitiveness (WordStream).
Keyword-level cost data reveals the competitive landscape:
- "Plumber near me" — average CPC $18–$32, highest search volume
- "Emergency plumber" — average CPC $45–$75, highest conversion rate at 8.2%
- "Drain cleaning service" — average CPC $14–$28, strong intent signal
- "Water heater repair" — average CPC $22–$40, high average ticket value
- "Plumbing company [city]" — average CPC $15–$30, strong local intent
Google Local Services Ads (LSAs) have become a critical channel for plumbing companies, offering a pay-per-lead model with costs averaging $25–$50 per lead (PipelineOn). LSAs appear above traditional search ads and carry the "Google Guaranteed" badge, which increases click-through rates by 38% compared to standard text ads. Plumbing companies with both LSAs and traditional Google Ads campaigns running simultaneously report 22% more total leads than those using either channel alone.
SEO and Local Search Benchmarks
97% of consumers search online before hiring a local plumber, and 46% of all Google searches have local intent (Ahrefs). For plumbing businesses, this means local search visibility directly determines lead volume. Plumbing companies ranking in the top 3 of Google's local pack capture 78% of all local-pack clicks.
Google Business Profile optimization is the single highest-impact local SEO activity for plumbers. Companies with complete, actively managed profiles — including photos, service descriptions, Q&A, and regular Google Posts — generate 4.2× more phone calls than those with basic listings (Podium). Key Google Business Profile performance data for plumbing companies:
| GBP Metric | Top Performers | Industry Average |
|---|---|---|
| Monthly Profile Views | 8,500+ | 2,200 |
| Monthly Phone Calls (from GBP) | 180+ | 45 |
| Direction Requests | 320+ | 85 |
| Website Clicks (from GBP) | 650+ | 160 |
| Avg. Review Count | 250+ | 65 |
| Avg. Star Rating | 4.8 | 4.3 |
Online reviews are the most influential factor in consumer choice for plumbing services. Research shows 88% of potential customers read reviews before contacting a plumber, and firms with 120+ Google reviews and a 4.7+ rating earn 52% more calls from search results than competitors with fewer reviews (BrightLocal). Review velocity — how frequently new reviews are posted — also signals freshness and reliability to both consumers and search algorithms.
Website Performance and Conversion Data
The average plumbing company website converts 3.8% of visitors into leads, slightly above the home services average of 3.3%. However, top-performing plumbing websites achieve conversion rates of 8–12% through optimized design, clear calls-to-action, and trust signals (Authority Specialist).
Key conversion optimization factors for plumbing websites:
- Click-to-call buttons above the fold increase mobile conversions by 45%
- Online scheduling tools boost conversion rates by 28% over phone-only contact
- Trust badges (licensing, insurance, BBB) improve form submission rates by 17%
- Before/after project galleries increase time on site by 62 seconds and lift conversions by 14%
- Page load time under 3 seconds reduces bounce rate by 32% compared to 5+ second pages
Mobile traffic now accounts for 72% of all plumbing website visits, reflecting the urgency-driven nature of plumbing searches. Potential customers searching for emergency services are almost always on mobile devices. Plumbing companies with mobile-optimized sites and one-tap calling functionality report 3.1× more phone leads from mobile visitors than those with non-responsive designs.
Social Media Marketing for Plumbing Businesses
64% of plumbing companies maintain active social media profiles, with Facebook leading at 82% adoption followed by Instagram (41%), YouTube (28%), and TikTok (18%) (Housecall Pro). While social media accounts for fewer than 8% of direct leads for plumbing companies, its impact on brand awareness and trust-building is substantial.
Video content performs dramatically better than static posts for plumbing businesses. Before-and-after repair videos, educational content about common plumbing issues, and team introduction videos generate 4.5× more engagement than image-only posts. Plumbing companies posting short-form video content (Reels, TikTok, Shorts) at least twice weekly see 78% higher follower growth than those posting only images.
Paid social media advertising for plumbing delivers a cost per lead of $40–$75, positioning it between Google Ads and email marketing in cost-effectiveness. Facebook lead form ads perform best for plumbing companies, with completion rates of 12–18% on well-targeted campaigns. The most effective social ad strategy combines awareness campaigns with retargeting of website visitors.
Email Marketing and Customer Retention
Email marketing delivers the highest ROI of any digital channel for plumbing companies at an average of $36 returned per $1 spent. Despite this, only 38% of plumbing businesses actively use email marketing beyond basic appointment confirmations. The channel excels at generating repeat business and referrals — the two most profitable lead sources for established plumbing companies.
Effective email strategies for plumbing businesses include seasonal maintenance reminders (42% open rate), promotional offers for existing customers (35% open rate), and educational newsletters about home maintenance (28% open rate). Plumbing companies that implement automated email sequences for post-service follow-up see 23% higher customer retention rates and 31% more referral leads than those without email automation.
Plumbing Marketing vs. Other Home Service Industries
| Industry | Avg. Google Ads CPC | Avg. CPL (All Channels) | Website Conv. Rate |
|---|---|---|---|
| Plumbing | $12–$35 | $25–$85 | 3.8% |
| HVAC | $15–$42 | $30–$95 | 3.5% |
| Electrical | $10–$28 | $22–$70 | 3.2% |
| Roofing | $18–$55 | $40–$120 | 2.9% |
| Landscaping | $6–$18 | $15–$50 | 4.1% |
| Pest Control | $8–$22 | $18–$55 | 4.4% |
Plumbing sits in the mid-to-upper range of home service marketing costs, with higher CPCs than electrical and landscaping but lower than roofing. The sector's 3.8% average website conversion rate outperforms HVAC (3.5%) and roofing (2.9%), reflecting the urgency-driven nature of plumbing needs that pushes potential customers to convert quickly.
AI Search and Emerging Trends in Plumbing Marketing
AI-generated search results are beginning to reshape how customers find plumbing services. Currently, 28% of informational plumbing queries trigger an AI Overview in search results, though commercial-intent queries like "plumber near me" remain largely unaffected. Plumbing companies that create comprehensive, authoritative content about common plumbing problems position themselves as sources that AI systems cite.
Voice search adoption is accelerating for plumbing services, with 34% of plumbing-related searches now conducted via voice assistants. The conversational nature of voice queries ("Hey Google, find a plumber who can fix a leaking pipe today") favors plumbing businesses with strong local SEO and natural-language content on their websites. Companies optimizing for voice search see 21% more calls from Google Assistant and Siri-driven results. Building a complete Google Ads and search strategy alongside voice and AI optimization ensures plumbing businesses capture customers across all search modalities.
Related reading
- HVAC Digital Marketing Statistics 2026: CPL, Ad Spend & Lead Data
- Medical Spa & Aesthetics Digital Marketing Statistics: 2026 Industry Data
- Mortgage Digital Marketing Statistics: 40+ Benchmarks for 2026
- Marketing Strategy Consulting services at Web Tonic
FAQ
How much should a plumbing company spend on digital marketing?
Most plumbing companies should allocate 7–12% of gross revenue to marketing, with 65–80% of that budget directed to digital channels. For a plumbing business generating $1 million in annual revenue, this translates to roughly $5,000–$10,000 per month in digital marketing spend. Top-performing companies often invest closer to 10–15% and achieve stronger growth as a result.
What is the best digital marketing channel for plumbers?
Google Ads (including Local Services Ads) typically delivers the most immediate results, while SEO provides the best long-term ROI. The ideal strategy combines both: Google Ads for immediate lead flow while SEO compounds over time. LSAs are particularly effective with costs averaging $25–$50 per lead and the trust benefit of the Google Guaranteed badge.
How important are online reviews for plumbing companies?
Reviews are arguably the most important digital marketing asset for plumbers. With 88% of customers reading reviews before contacting a plumber, and firms with 120+ reviews earning 52% more calls, review generation and management should be a daily priority. Aim for a 4.7+ star rating and respond to every review — positive and negative — within 24 hours.
Does social media marketing work for plumbing businesses?
Social media works primarily for brand awareness and trust-building rather than direct lead generation for plumbing companies. It accounts for under 8% of direct leads but contributes to brand recognition that influences how customers choose between competitors. Video content — especially before-and-after project videos — generates the strongest engagement and is worth the investment.
What is the average cost per lead for plumbing Google Ads?
The average cost per lead from Google Ads for plumbing companies is $35–$85, with emergency keywords driving higher CPLs ($60–$120) but also higher conversion-to-booking rates. Google Local Services Ads offer lower CPLs at $25–$50 and are increasingly becoming the preferred paid channel for plumbing businesses due to their prominent placement and pay-per-lead pricing model.
Sources
servicetitan.com/blog/plumbing-industry-statistics
pipelineon.com/blog/plumber-marketing-benchmarks/
wordstream.com/blog/ws/2024/06/google-ads-benchmarks
podium.com/article/plumbing-marketing/
brightlocal.com/research/local-consumer-review-survey/
authorityspecialist.com/industry/plumbing/
housecallpro.com/blog/plumbing-marketing/
ahrefs.com/blog/seo-statistics/


