



Table of contents
A disclosed 2026 dataset of 762 live landscaping Facebook and Instagram ads shows most creative budget is still going to static images that click through to a slow homepage, not a dedicated project gallery. This page tracks where the smarter share of landscaping ad creative spend is actually moving in 2026, using named, sample-sized studies rather than round-number guesses.
Key Takeaways
- 145 landscaping advertisers and 762 live ads sit inside one Q2 2026 dataset.
- Home-services landing pages load in a median 7.3 seconds on mobile.
- 78% of those pages load slower than the 4-second engagement threshold.
- 96% of home-services Facebook advertisers run no server-side conversion tracking.
- 100% of the dataset had no lead-recovery tooling on the landing page.
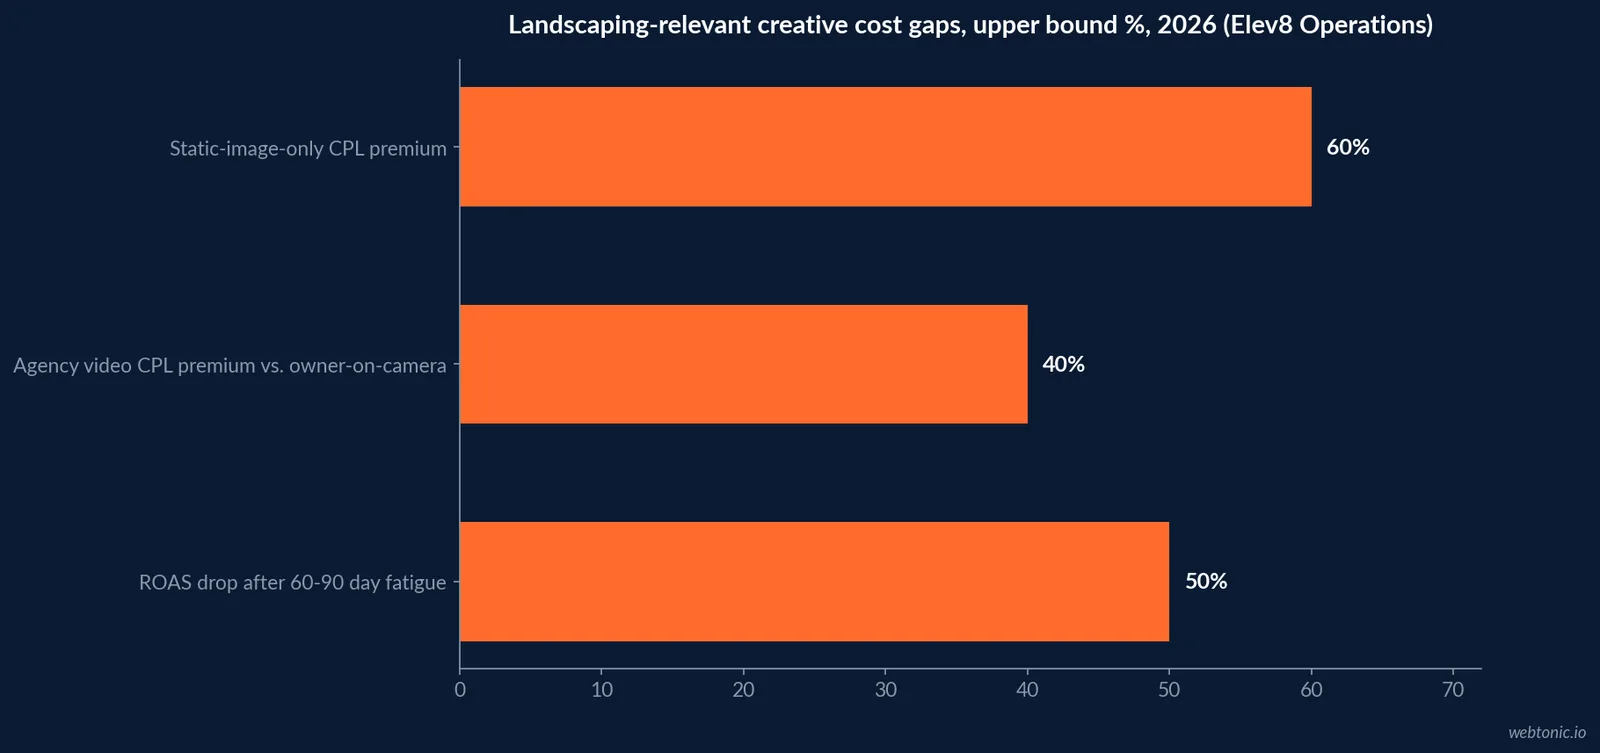
- Static-image-only campaigns cost 30% to 60% more per lead than video-led ones.
- Owner-on-camera video beats agency-produced video by 25% to 40% on cost per lead.
- Creative fatigue sets in at 60 to 90 days of the same asset running.
- ROAS drops 30% to 50% once that fatigue sets in.
- 91% of businesses overall now use video as a marketing tool.
- 93% of marketers call video an important part of their strategy.
- 62% say video production costs the same or less than a year ago.
- 40% of landscape businesses are investing in sales and marketing at all.
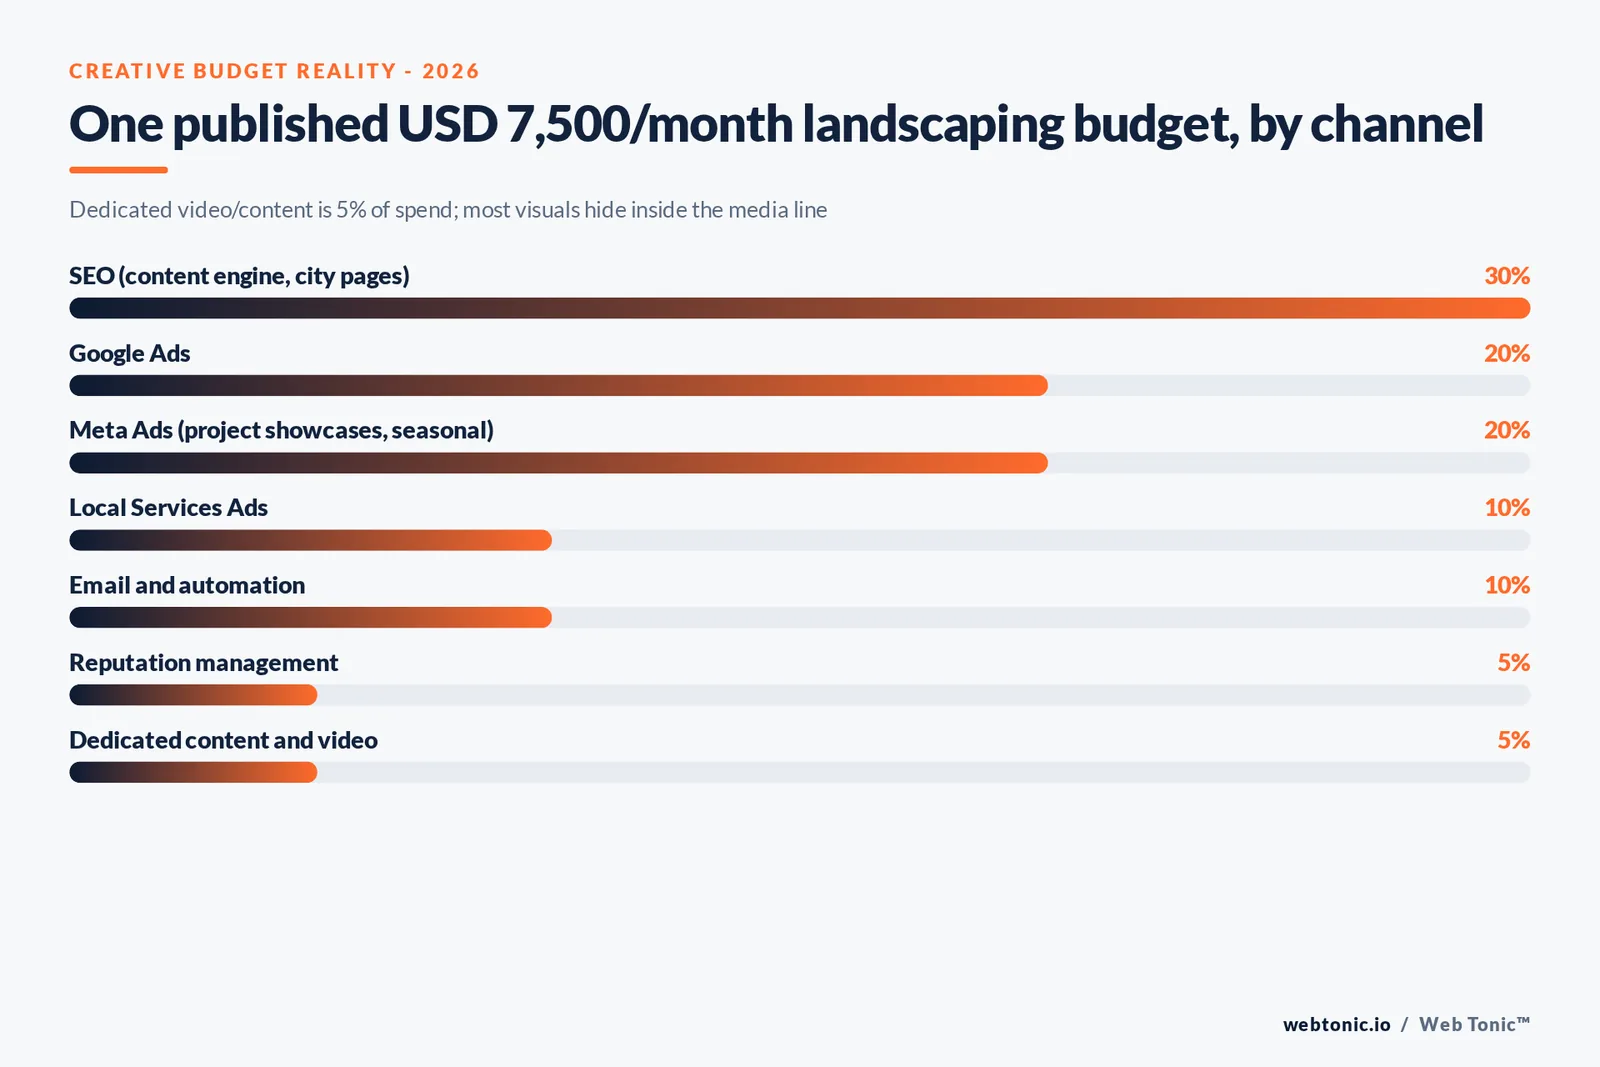
- One published landscaping budget template puts video/content at just 5% of spend.
- The same template folds before-after photography into the Meta Ads line instead.
What the creative is actually running against
Before talking about video versus static, look at where the budget lands once someone clicks. PipelineOn's Q2 2026 Quarterly Home Service Meta Ads Review is a disclosed, citable dataset of 1,222 advertiser-trade rows across 1,143 unique advertisers running 5,834 live ads on Facebook and Instagram between April and June 2026, with Lawn/Landscaping making up 145 advertisers and 762 live ads of that total. Across the full dataset, the median mobile landing page load time is 7.3 seconds, with 78% loading slower than the 4-second mark that keeps most visitors from bouncing.
No creative survives that. A before-and-after video that took real budget to produce is wasted the moment the click lands on a page that takes eight seconds to show it.
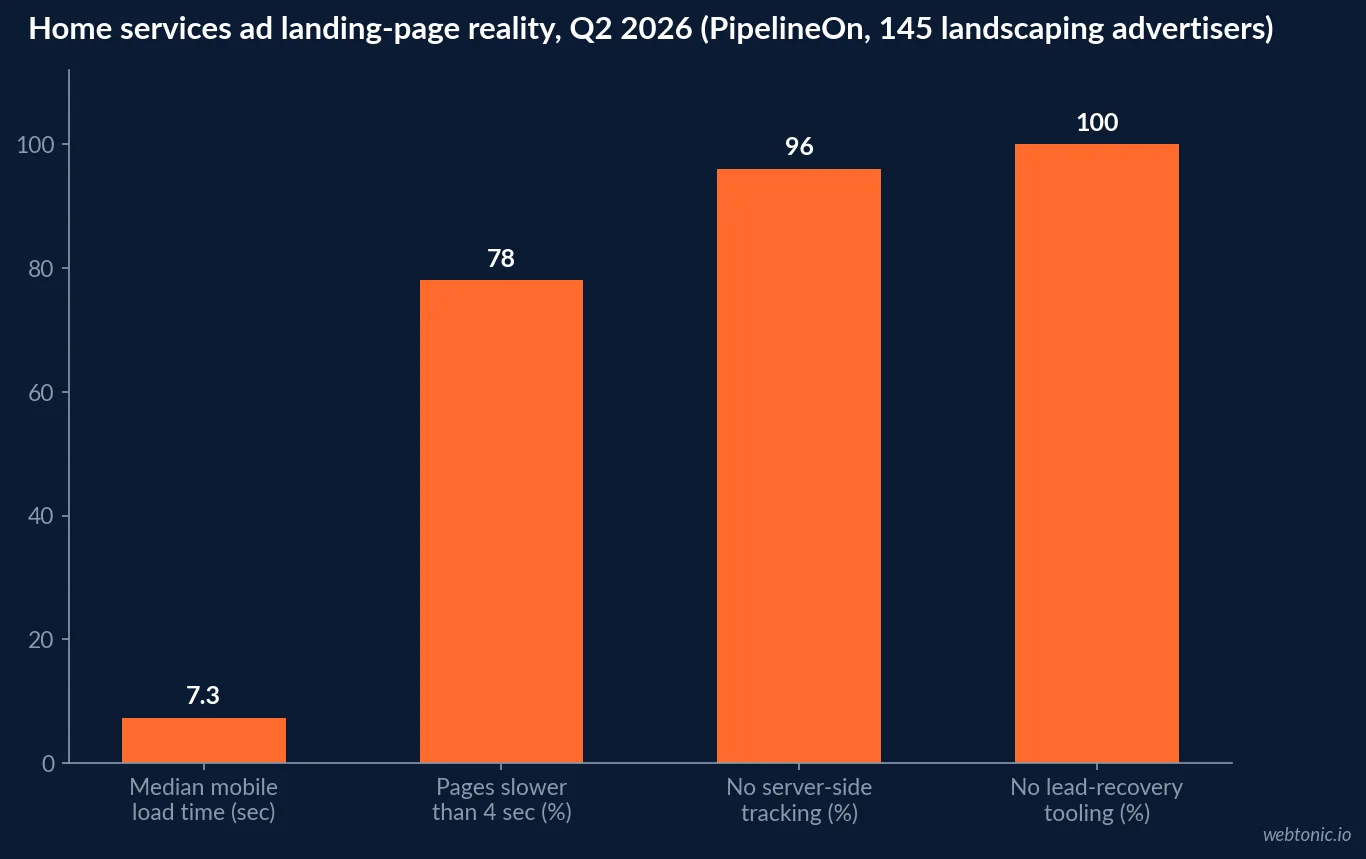
| Landing-page & tracking signal (PipelineOn Q2 2026, home services) | Figure | Why it matters to creative |
|---|---|---|
| Landscaping advertisers in the dataset | 145 | A large enough slice to trust the pattern |
| Landscaping live ads measured | 762 | Most run against the same weak landing setup |
| Median mobile page load time | 7.3 seconds | Best creative loses most viewers before it loads |
| Pages slower than 4 seconds | 78% | The industry standard destination is already broken |
| Advertisers with no server-side (CAPI) tracking | 96% | Creative performance is being measured blind |
| Advertisers with lead-recovery tooling | 0% | A missed form fill is a lost creative investment |
What display and video ads actually cost in this category
LocaliQ's 2026 Display and Video Ads Benchmarks, built from more than 60,000 display and video ad campaigns across industries, puts Home & Home Improvement - the closest industry bucket to landscaping - at a $65.37 cost per lead, the lowest of every category LocaliQ measured, against a $3.49 cost per click and a 0.19% click-through rate. For the video format specifically, LocaliQ's cross-industry data on USA TODAY Network placements shows a 71% average viewability rate, a 67% video completion rate, and a lower, expected 0.09% click-through rate, since video ads are watched rather than clicked.
Read together with the landing-page problem above, the pattern is clear: a landscaping ad's creative format matters less than most budgets assume once it clicks through to a page nearly four in five visitors will abandon before it loads. A well-produced video that gets watched (a 67% completion rate is a real audience) is still wasted spend if it sends that engaged viewer to a seven-second homepage instead of the same project shown in the ad.
| Display & video ad signal (LocaliQ 2026, 60,000+ campaigns) | Figure | Practical read for landscaping |
|---|---|---|
| Home & Home Improvement cost per lead | USD 65.37 (lowest of all industries measured) | Home-category display ads are comparatively cheap per lead |
| Home & Home Improvement cost per click | USD 3.49 | Budget clicks with the landing page fix, not without it |
| Video ad viewability rate | 71% | Most video creative does get seen |
| Video ad completion rate | 67% | Two in three viewers watch the whole clip |
Why video is worth the extra production step
Wyzowl's 2026 State of Video Marketing survey, based on 266 respondents surveyed in late 2025, found 91% of businesses now use video as a marketing tool and 93% call it an important part of their overall strategy. Cost is no longer the barrier it once was: 62% of video marketers say marketing videos cost the same or less to make than a year ago, against only 38% who say costs are rising. For a landscaping company already generating before-and-after footage on every job, the marginal cost of turning that footage into a paid creative asset keeps falling.
| Video adoption signal (Wyzowl 2026, 266 respondents) | Figure |
|---|---|
| Businesses using video as a marketing tool | 91% |
| Marketers calling video an important strategy piece | 93% |
| Marketers saying video costs the same or less than last year | 62% |
| Marketers saying video costs more than last year | 38% |
| Non-users who plan to start video in 2026 | 67% |
Where the real landscaping marketing budget goes
No landscaping-specific study breaks creative production out as its own separate line item, so treat any single split with caution. What is measured is the overall budget: PipelineOn's 2026 landscaping marketing research puts total spend at 7% to 10% of gross revenue, with 65% to 75% of that annual budget compressed into the seven-month March-through-October season - meaning a landscaping company's creative budget is smallest exactly when off-season planning happens, and largest exactly when there is no time to shoot it.
That same research finds Google Local Service Ads, Google Business Profile and organic SEO, and Nextdoor sponsored ads carrying 70% to 80% of inbound residential volume for a well-run 2026 landscaping stack - the same channels this page's video and display data above show benefiting most from a fixed content pipeline, since a stronger before-and-after library feeds every one of those channels at once rather than requiring a separate production budget for each.
| Landscaping marketing budget reality (PipelineOn 2026) | Figure | Monthly amount (USD 1M revenue shop) |
|---|---|---|
| Total marketing spend | 7%-10% of gross revenue | USD 5,800-USD 8,300 |
| Share spent March-October | 65%-75% of the annual budget | Compressed into a 7-month window |
| Share of inbound volume from top 3 channels | 70%-80% | LSA, GBP/SEO, Nextdoor |
What the actual jobs are, and what creative should show
Creative decisions should follow revenue, not the other way around. NALP's coverage of Aspire's 2026 Commercial Landscape Industry Report puts commercial maintenance at 83% of commercial contractors' revenue and residential maintenance at 63% for mixed-book firms - meaning the majority of a landscaping company's actual work is recurring maintenance, not the one-time design-build transformation that dominates most landscaping ad creative. Before-and-after footage sells the transformation job well, but a maintenance-heavy book needs creative that sells reliability and consistency instead: a season-long time-lapse of one property, a testimonial about a missed mow that got made right, or simple proof of a crew showing up on schedule.
Bureau of Labor Statistics data puts the national landscaping and groundskeeping workforce at roughly 930,000 people - the same labor pool competing for the owner-on-camera talent that Elev8's data shows outperforms agency-produced video, which is one more reason the cheapest creative option is often also the most available one.
| Revenue reality (Aspire/NALP 2026) | Share of revenue | What creative should actually sell |
|---|---|---|
| Commercial maintenance contracts | 83% (commercial contractors) | Reliability, consistency, schedule adherence |
| Residential maintenance | 63% (mixed-book firms) | Trust, recurring value, seasonal care |
| One-time design-build transformations | Minority of most books | Before-and-after, the format most creative already uses |
Where video ranks against other formats right now
HubSpot's 2026 marketing-channel research, drawn from more than 1,500 marketers globally, found video platforms have overtaken LinkedIn in both popularity and ROI for B2B-leaning categories, even as short-form video adoption keeps climbing across the board. For a landscaping company, that trend lines up with the cost data above: video is not a nice-to-have production upgrade anymore, it is the format increasingly expected by the same algorithm deciding how cheaply an ad gets delivered.
None of this argues for abandoning static images. A steady stream of quick before-and-after photos, shot on a phone at the end of every job, still fills the gap between quarterly video refreshes at close to zero marginal cost - the two formats are complementary, not competing, budget lines.
| Format | Best use in a landscaping creative rotation | Approx. production effort |
|---|---|---|
| Before-and-after photo | Daily/weekly supply, fills feed between video drops | Minutes per job, phone camera |
| Owner/foreman-on-camera video | Quarterly hero asset per campaign | Under an hour to shoot and edit |
| Drone or time-lapse footage | Large commercial or design-build wins only | Higher cost, use sparingly |
| Agency-produced polished video | Brand campaigns, not lead-gen ads | Highest cost, save for brand campaigns only |
What this means for next season's creative budget
The 2026 data points the same direction from three angles: fix the landing page before spending more on creative, since 78% of the industry's pages are already too slow to show it off; shift the format mix toward video where budget allows, since static costs 30-60% more per lead; and stop treating creative as a line item that only shows up inside the media budget, since that is how it quietly gets under-funded. Our performance creative practice builds the before-and-after video library and the fast landing page it needs to land on, as one project rather than two disconnected budgets.
For the media side of the same account, see our breakdown of what Facebook ad budgets actually cost, or talk to us about auditing where your current creative spend is really going.
Frequently Asked Questions
Should a landscaping company spend more on video or photo creative?
Both, but fix the destination first. LocaliQ's 2026 benchmarks show video ads getting watched (71% viewability, 67% completion) at a healthy rate, so the creative itself is not the weak link for most accounts. The honest budget answer is a steady stream of before-and-after project photos, shot on a phone at the end of every job, backed by one better-produced video refreshed on a quarterly cadence - and a landing page fast enough for either format to actually convert.
What is the biggest creative-adjacent mistake in landscaping ad budgets right now?
Sending paid clicks somewhere that cannot show the work. PipelineOn's Q2 2026 dataset, covering 762 live landscaping Facebook and Instagram ads from 145 advertisers, found the typical home-services landing page loads in a median of 7.3 seconds on mobile, with 78% of all measured pages slower than the 4-second threshold that keeps visitors engaged. A great before-and-after video that lands on a slow homepage loses most of its budget before anyone sees the creative at all.
Is video advertising worth the cost for a landscaping company?
Yes, on the numbers that exist. LocaliQ's cross-industry video benchmarks put average viewability at 71% and completion rate at 67%, meaning most people who start a video ad actually watch it through - a stronger audience signal than the low 0.09% click-through rate suggests on its own, since video ads are built to be watched, not clicked.
How much of a landscaping marketing budget should go to creative production specifically?
There is no landscaping-specific industry standard for this split, so treat any single number with caution. What is measured is total spend: PipelineOn's 2026 research puts landscaping marketing budgets at 7% to 10% of gross revenue, with 65% to 75% of that compressed into the March-through-October season - which is why creative planning has to happen in the off-season, before the budget (and the crew's time) is entirely consumed by the rush.
How often should landscaping ad creative be refreshed?
On a fixed quarterly cadence at minimum, timed to the seasonal budget curve above. Since 65% to 75% of the annual ad budget compresses into a seven-month window, a landscaping account has roughly one real chance per season to refresh its hero video before the same asset runs stale through the busiest months.
Sources
PipelineOn - Quarterly Home Service Meta Ads Review, Q2 2026
PipelineOn - Landscaping Marketing in 2026
LocaliQ - 2026 Display and Video Ads Benchmarks
Wyzowl - Video Marketing Statistics 2026
National Association of Landscape Professionals - The State of Commercial Landscaping in 2026
U.S. Bureau of Labor Statistics - Landscaping and Groundskeeping Workers
HubSpot - The Top Marketing Channels of 2026, According to Marketers


