Table of contents

Electronics storefronts have the richest structured data in retail and the slowest interaction scores in ecommerce. Both facts come from 2026 field data, and together they explain why a phone retailer can win an AI answer box while losing the mobile SERP.
Key Takeaways
- Electronics median mobile LCP is 3.9 seconds; the top quartile hits 2.4.
- Electronics median INP is 320 ms — the worst of any ecommerce vertical measured.
- Google's pass thresholds are LCP 2.5 s, INP 200 ms, CLS 0.1.
- Only 39% of ecommerce sites pass all three Core Web Vitals at once.
- Across the whole web the pass rate is 42%.
- Page-one results pass 47.6% of the time versus 44.2% on page two.
- 67% of failing ranking pages fail on LCP, 60% on INP.
- Ecommerce ranking pages pass at just 42%, versus 67% in legal.
- A 0.1-second mobile gain lifted retail conversion 8.4% and AOV 9.2%.
- Each extra second of load time costs roughly 7% of conversions.
- Faceted navigation can waste 30–60% of crawl capacity.
- Crawl-budget waste averages 30–40% without crawl directives.
- Single-page applications index 47% fewer pages than comparable multi-page sites.
- Google's rendering queue adds 5–10 seconds or more before JavaScript content is seen.
- Only 29.1% of audited product pages had complete required Product schema.
- 61.3% of pages with schema failed Google's Rich Results Test.
- Only 8.9% of product pages carried FAQ schema.
- Complete, valid Product markup made rich results 4.2x more likely.
- Electronics stores earn AI citations 3.2x more often than home goods retailers.
- AI Overviews now appear on about 14% of shopping queries.
- Mobile drives 72.4% of consumer electronics traffic but only 61% of orders.
Core Web Vitals: where electronics sits in the ecommerce field
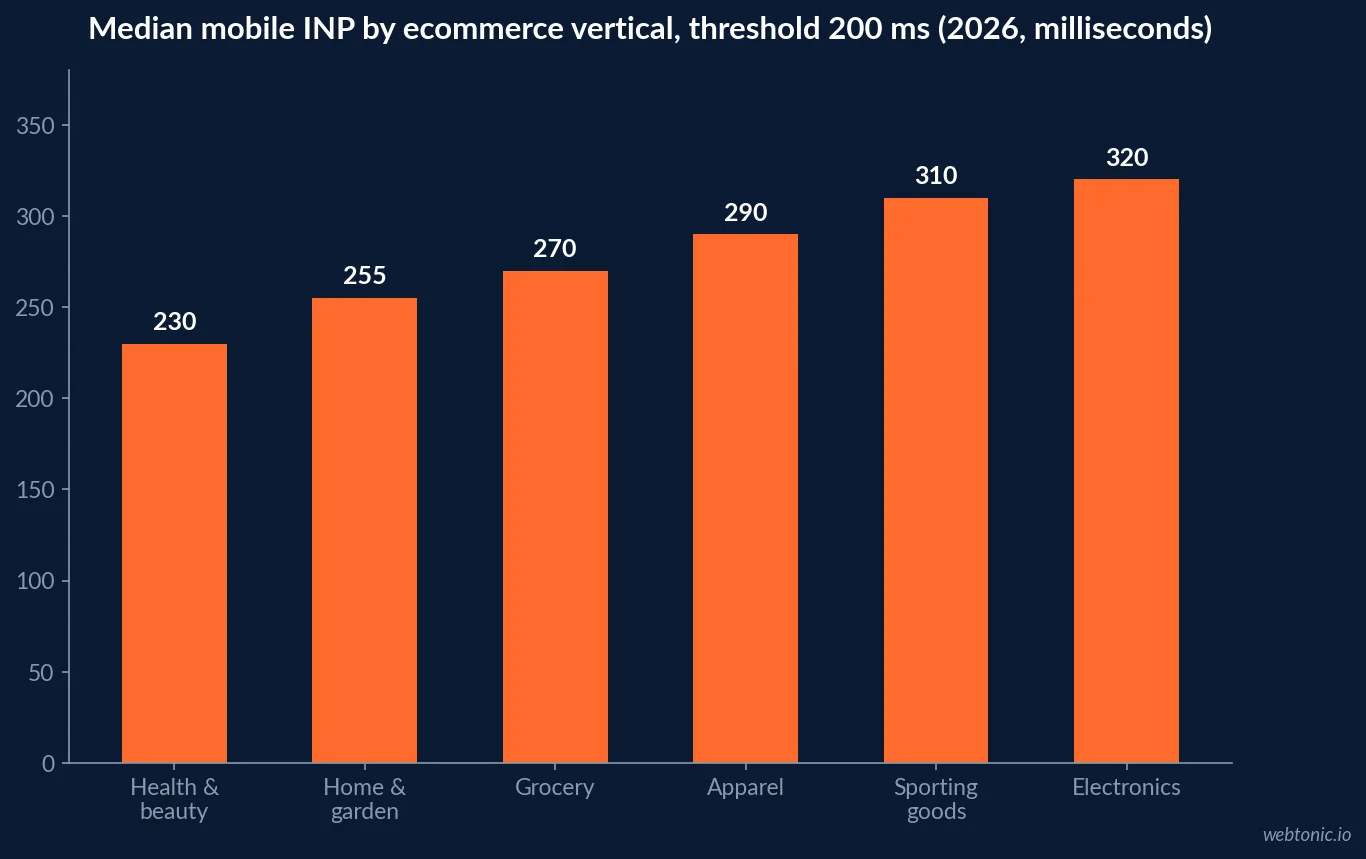
A 2026 vertical benchmark from 1Digital Agency measured median mobile field data by category. Electronics is not the slowest vertical on loading, but it is the worst on interactivity — the direct consequence of spec tables, comparison widgets, financing calculators and review scripts all competing for the main thread.
| Vertical | Median mobile LCP | Top-quartile LCP | Median INP | Median CLS |
|---|---|---|---|---|
| Electronics | 3.9 s | 2.4 s | 320 ms | 0.11 |
| Apparel | 4.1 s | 2.6 s | 290 ms | 0.14 |
| Home & garden | 3.5 s | 2.2 s | 255 ms | 0.09 |
| Health & beauty | 3.2 s | 1.9 s | 230 ms | 0.08 |
| Sporting goods | 4.4 s | 2.8 s | 310 ms | 0.13 |
| Google "good" threshold | 2.5 s | 2.5 s | 200 ms | 0.10 |
Not one vertical median clears the interactivity bar. Electronics misses it by 60%, and only the top quartile of the category comes close to a passing LCP. The aggregate picture matches: Noibu puts the share of ecommerce sites passing all three Core Web Vitals at 39%, with mobile running 40–60% worse than desktop on every metric, while Searchlab reports 42% across the web as a whole.
Does speed move rankings, or only revenue?
The honest answer from the largest 2026 dataset is: barely, and then decisively. PageSpeed Matters analysed 64,864 ranking positions across 37,036 sites with real-user field data.
| Measure | Value | What it means for a device catalog |
|---|---|---|
| Page-one CWV pass rate | 47.6% | Over half of page one fails — passing is an edge, not table stakes |
| Page-two pass rate | 44.2% | The gap is real but small: 3.4 points |
| Top-three pass rate | 50.8% | Even the most contested slots fail half the time |
| Correlation with position | r ≈ 0.09 | Speed explains under 1% of ranking variance |
| Ecommerce vertical pass rate | 42% | Retail sits near the bottom; legal leads at 67% |
| Failure mode split | 67% LCP, 60% INP, 42% CLS | Fix the hero image and the scripts, in that order |
So treat speed as a conversion program with an SEO side effect. Retail field data cited by EcomHint from the Deloitte and Google study of roughly 30 million sessions found a 0.1-second mobile improvement correlated with an 8.4% conversion lift and a 9.2% increase in average order value; Searchlab puts the cost of each extra second at about 7% of conversions. On a catalog where a single handset carries a $900 price tag, that arithmetic beats any ranking argument. Our data intelligence work almost always starts here.
The image problem is a phone-photography problem
EcomHint's benchmark of 1,533 stores with field data found 77% of stores have an image as their LCP element, product pages ship 4–17% more JavaScript than homepages, and product pages fire 9–25% more HTTP requests. Device retail makes this worse than average: colourway galleries, 360-degree spins and zoomable macro shots of ports and cameras are the whole merchandising argument.
| Asset class on a phone product page | Typical weight signal | Practical fix |
|---|---|---|
| Hero device shot | LCP element on 77% of stores | AVIF or WebP under 200 KB, fetchpriority="high" |
| Colourway gallery | Images 687 KB median on PDPs | Lazy-load everything below the first swatch row |
| Spec and comparison scripts | Median 2,731 KB JavaScript on PDPs | Defer; render the spec table server-side |
| Review widget | Unused JS 971 KB median | Load on scroll; keep AggregateRating in the HTML |
| Trade-in / financing calculator | Main-thread blocking | Load on interaction, not on page load |
AVIF now has 96% browser support and delivers files roughly 50% smaller than WebP, yet adoption sits near 8.7%. For a retailer whose LCP is a photo of a phone, that is the cheapest available second.
Crawl waste: storage, colour, carrier, condition
Device catalogs are facet factories. A single "smartphones" category filtered by brand, storage, colour, condition and carrier generates combinatorial URLs at a rate no crawl budget survives. CrawlSense estimates uncontrolled facets burn 30–60% of crawl capacity on URLs that will never rank, and Authority Specialist measures average crawl-budget waste at 30–40% on ecommerce sites without directives. Digital Applied reaches the same conclusion: unchecked facets can eat 40%+ of Googlebot activity.
| Facet pattern | Search demand | Recommended handling |
|---|---|---|
/iphone-cases (brand + category) | High, sustained | Index; unique copy and internal links |
?storage=256gb on a model page | Moderate | Index selectively where volume exists |
?colour=midnight&storage=256gb | Negligible | Canonical to the parent, noindex, follow |
?sort=price-asc, ?view=grid | None | Robots.txt disallow — UI state only |
?carrier=x&condition=refurb&colour=y | None | Block at the parameter level |
Authority Specialist reports that resolving canonical chain conflicts improved indexation coverage 20–35% within 60 days, and that indexation ratios of 70–90% are normal for well-maintained sites. If your submitted-to-indexed ratio sits far below that on a catalog above 5,000 URLs, facets are the first suspect.
JavaScript rendering: the deferred spec sheet
Searchlab's 2026 compilation is blunt about client-side rendering. Google's rendering queue can take 5–10 seconds or longer; single-page applications average 47% fewer indexed pages than comparable multi-page sites without SSR or dynamic rendering; content behind client-side rendering shows about 32% less indexed content; and infinite scroll without pagination leads to 41% fewer indexed items. JavaScript resources block rendering on 23% of pages, average JS weight per page is 507 KB compressed, and third-party scripts account for 54% of that weight.
Two rules follow for device retail. Price, availability and the core specification table must exist in the server-rendered HTML — those are exactly the fields that change most often and matter most in rich results. And AI crawlers do not execute JavaScript at all, which turns a client-side spec table into an invisible one. AI bot traffic has grown sharply: Searchlab records a 340% increase in AI crawl requests since 2024, with 28% of sites now blocking those bots in robots.txt.
Schema is the biggest unclaimed win in device retail
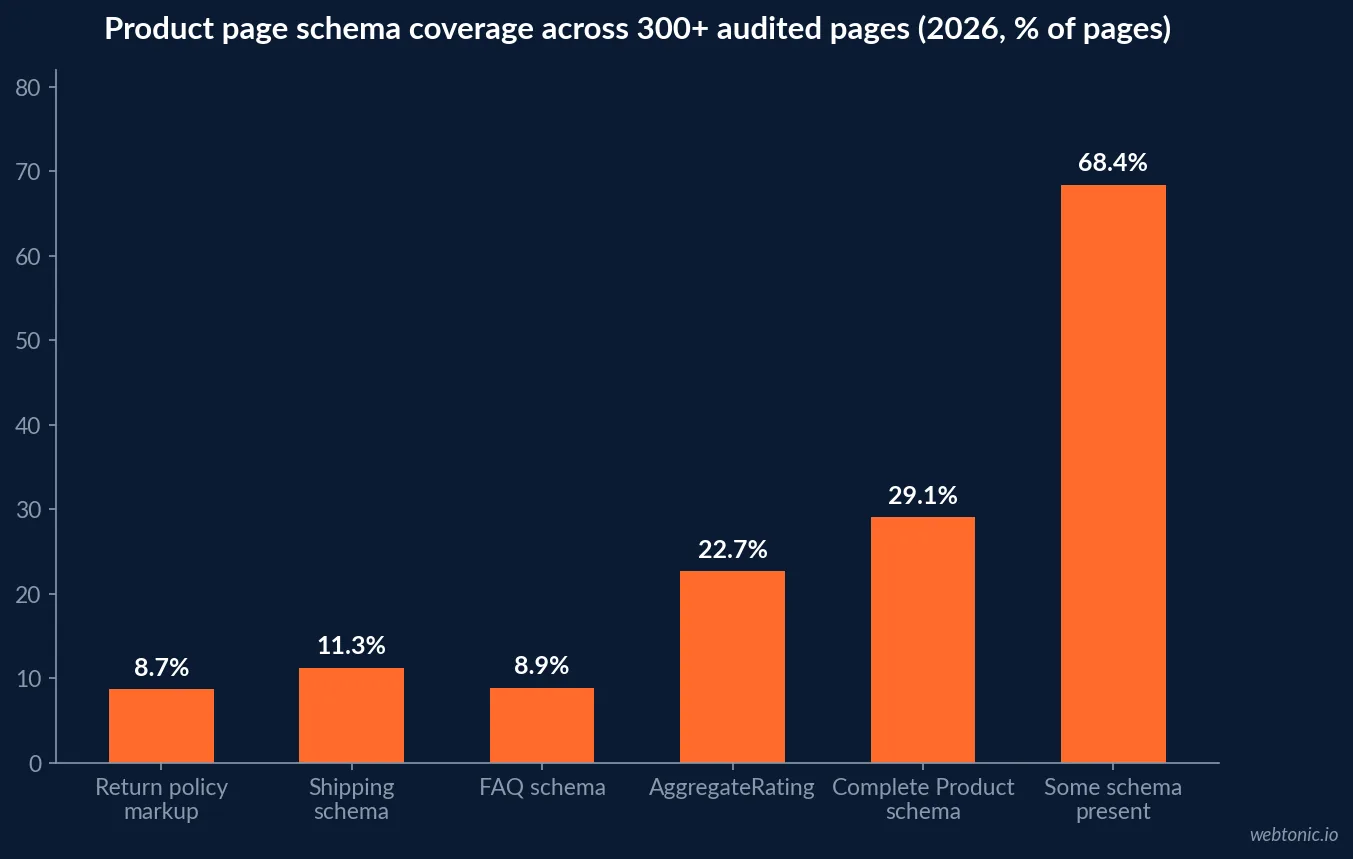
An audit of more than 300 product pages across 12 niches by StoreSEO found the gap is not adoption but completeness.
| Schema element | Share of product pages | Consequence |
|---|---|---|
| Some schema present | 68.4% | Baseline — presence is not eligibility |
| Complete required Product schema | 29.1% | Only these pages are fully rich-result eligible |
| AggregateRating present | 22.7% | Valid and complete: closer to 17% |
| At least one validation error | 61.3% | Disqualifies the page from rich results |
| Shipping schema | 11.3% | Blocks merchant listings without a feed |
| Return policy markup | 8.7% | Same — and a major trust signal for devices |
| FAQ schema | 8.9% | Largest untapped surface on a PDP |
Pages with complete, error-free Product markup were 4.2x more likely to trigger a rich result. Searchlab adds that Product schema correlates with roughly 25% more clicks and FAQ schema with 87% more, while only 39% of all sites use any structured data. That is a wide open lane for anyone selling handsets, accessories or repairs — and it pairs naturally with the on-page work in our growth marketing programs.
Why electronics wins AI citations — and how to keep the lead
Specifications are machine-readable by nature, and AI shopping agents reward that. Shopti found electronics stores are cited 3.2x more often than home goods and 2.8x more than fashion, that 89% of top-performing electronics stores have complete Product schema against 62% of fashion stores, and that electronics still wins by 2.1x even when coverage is equal. Products with complete additionalProperty fields — RAM, storage, screen resolution, battery, codec support, IP rating — earned 2.8x more citations than basic markup.
| AI visibility lever | Measured effect | Effort |
|---|---|---|
| Full Product schema on 95%+ of pages | 3.2x more citations vs under 50% coverage | Medium |
Spec fields as additionalProperty | 2.8x more citations | Medium |
| Review markup with 10+ verified reviews | 2.4x more citations than 1–3 reviews | Ongoing |
| FAQ schema on 60%+ of products | Citation traffic +134% | Low |
| Full schema stack overall | AI citation traffic 0.8% → 2.6% of organic | Medium |
The traffic is also better traffic: Shopti measured AI citation visits converting at 4.2% against 2.8% for standard organic, with 23% higher order values and bounce rates 18% lower. Digital Applied puts AI Overviews on roughly 14% of shopping queries as of March 2026, up from 2.1% the previous November across 20.9 million shopping SERPs. Note the variant trap: 62% of stores with multi-variant products failed to structure variant data properly and lost 41% of citations for variant-specific queries — storage and colour variants are exactly where phone retail lives.
Mobile-first is a revenue split, not a slogan
Consumer electronics benchmarks put mobile at 72.4% of traffic but only 61% of orders, with desktop converting roughly 1.5x better. Since Google indexes the mobile version of every site, the slower, script-heavier experience is the one that defines your rankings while the desktop experience quietly closes the sale. Mobile is also 58.7–63.4% of all web traffic globally, and Authority Specialist puts mobile at 60–75% of ecommerce search traffic specifically.
| Signal | Consumer electronics | Read |
|---|---|---|
| Mobile share of traffic | 72.4% | Mobile-first indexing applies to the worst-performing template |
| Mobile share of orders | 61.0% | Desktop closes disproportionately |
| Desktop share of orders | 37.5% from 25.1% of traffic | ~1.5x conversion efficiency |
| Mobile bounce rate | 54.2% vs 39.8% desktop | Above 58% signals a performance fault |
| Organic share of traffic | 29.0% globally | Second only to direct at 41.5% |
A 90-day technical order of operations
- Fix the LCP image on the product template first — AVIF/WebP under 200 KB with high fetch priority. 67% of failing pages fail here.
- Audit INP on the pages that matter. Electronics medians sit at 320 ms against a 200 ms bar; defer review, chat and financing scripts until interaction.
- Complete Product schema before adding new schema types. Only 29.1% of pages get the required fields right, and 61.3% of marked-up pages carry an error.
- Add every spec as an
additionalProperty. That single change tracked to 2.8x more AI citations for electronics products. - Tier your facets. Index brand and model combinations, canonical the rest, disallow pure UI parameters, and expect 30–60% of crawl capacity back within 60–90 days.
- Server-render price, availability and the spec table. SPAs index 47% fewer pages and AI crawlers never run your JavaScript.
- Ship FAQ schema on the top 60% of products — only 8.9% of pages have it and it tracked to +134% citation traffic.
- Re-measure in field data, not lab data. Lab LCP passes on 1% of Shopify stores while field LCP passes on 86%; only one of those reflects your customers.
If paid and organic are competing for the same device keywords, sequence the work against media spend — the same logic we apply in Google Ads programs, where a faster product template lowers both CPA and the cost of every organic click you were already earning. For a broader benchmark set, see our data on what Google Ads costs in 2026.
Frequently Asked Questions
What Core Web Vitals scores do electronics stores actually hit?
In a 2026 vertical benchmark, electronics storefronts posted a median mobile LCP of 3.9 seconds, a top-quartile LCP of 2.4 seconds, a median INP of 320 ms and a median CLS of 0.11. The INP figure is the worst of any ecommerce vertical measured, against Google's 200 ms threshold. Across ecommerce as a whole only 39–42% of sites pass all three metrics at once.
Does page speed actually move rankings for device keywords?
Only weakly on its own. An analysis of 64,864 ranking positions across 37,036 sites found page-one results pass Core Web Vitals 47.6% of the time versus 44.2% on page two — a real but small gap, with speed explaining under 1% of ranking variance. The commercial case is conversion: retail data shows a 0.1-second mobile improvement lifting conversion 8.4% and average order value 9.2%.
How much crawl budget do phone variant filters waste?
A lot. Faceted navigation left uncontrolled wastes 30–60% of crawl capacity on filter combinations nobody searches, and crawl-budget waste averages 30–40% on ecommerce sites with no crawl directives in place. Storage, colour, carrier and condition filters multiply fast: five facets on one category can produce tens of thousands of thin URLs from a few hundred real products.
Is product schema worth the implementation time for a device catalog?
It is the highest-leverage item on the list. An audit of 300+ product pages found only 29.1% carried the complete required Product schema, 61.3% of pages with any schema failed validation, and just 8.9% had FAQ schema. Pages with complete, error-free Product markup were 4.2x more likely to trigger rich results, and electronics products with full additionalProperty spec fields earned 2.8x more AI citations.
Why do electronics stores get cited by AI search more than other retailers?
Because specifications are already structured data. Electronics merchants receive AI agent citations 3.2x more often than home goods and 2.8x more than fashion, and 89% of top-performing electronics stores have complete Product schema coverage versus 62% of fashion stores. AI Overviews now appear on roughly 14% of shopping queries, up from 2.1% four months earlier.
Sources
1Digital Agency — Ecommerce Page Speed Benchmarks by Vertical 2026
PageSpeed Matters — Speed vs Google Rankings (64,864 positions)
Searchlab — Technical SEO Statistics 2026
Noibu — 2026 Ecommerce Site Health Benchmark
EcomHint — Shopify Speed Benchmark (1,533 stores)
StoreSEO — 300+ Product Pages Schema Audit
CrawlSense — Faceted Navigation Indexing at Scale
Authority Specialist — Technical SEO Statistics 2026
Digital Applied — Ecommerce Product-Page SEO 2026
Shopti — AI Citation Rates by Product Category
CUFinder — Consumer Electronics Marketing Benchmarks 2026