



Table of contents
Key Takeaways
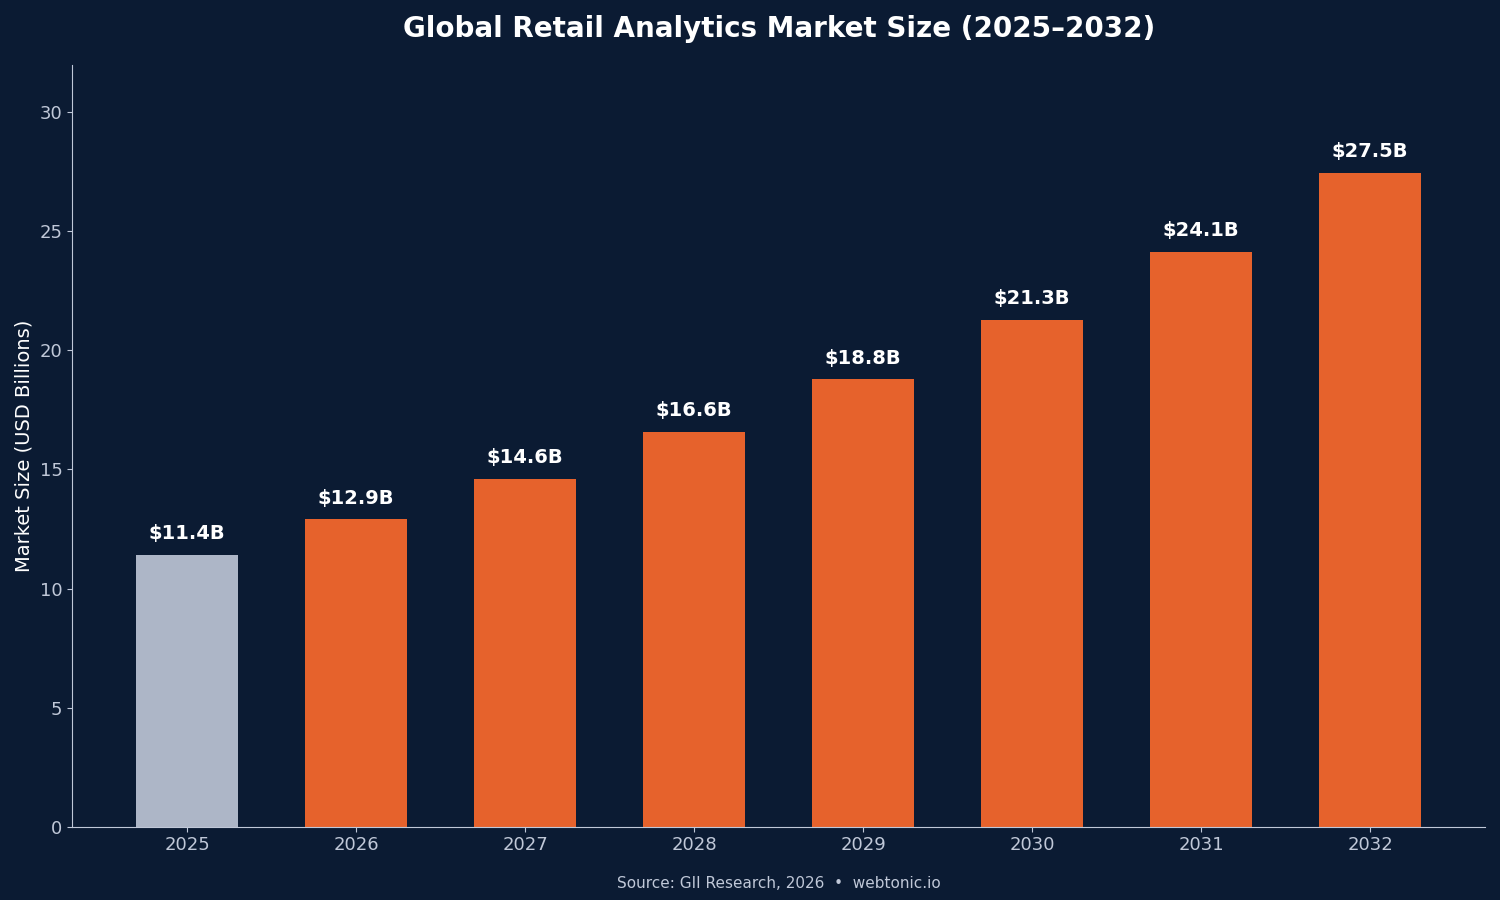
- The global retail analytics market will reach $12.90 billion in 2026, growing to $27.46 billion by 2032 at a 13.34% CAGR (GII Research, 2026).
- Retailers using geo-location and traffic-driven analytics tools see 104% higher profit growth compared to non-adopters, effectively doubling profit trajectory (IHL Group via Pygmalios).
- 97% of mid-market retailers with $250M–$1B revenue have stabilized their data infrastructure, while 68% have reached the monetization stage where analytics directly drives ROI (InnovationVista, 2026).
- Retail organizations using a mature customer data platform report $2.70 return for every $1 spent, driven by improved marketing efficiency and higher customer lifetime value (DCF Research, 2026).
- 86% of consumer and retail executives report that technology investment frequently improves business value, with most realizing 31–40% of total financial value from AI and intelligent technologies (KPMG, 2026).
- In a 600-store study, 60% of stores improved conversion rates with an average increase of 4.29 percentage points after implementing retail store analytics — a 33% improvement (ReBiz, 2026).
Phone and tech retail runs on data. From foot traffic sensors in carrier stores to cross-channel attribution models tracking online-to-offline conversions, analytics determines which retailers grow and which lose margin. These statistics cover the market sizing, adoption benchmarks, and ROI evidence that data intelligence teams need to justify and optimize their analytics investments in 2026.
Phone and Tech Retail Analytics at a Glance
| Metric | Value | Source |
|---|---|---|
| Global retail analytics market (2026) | $12.90B | GII Research, 2026 |
| Projected market size (2032) | $27.46B | GII Research, 2026 |
| Market CAGR (2026–2032) | 13.34% | GII Research, 2026 |
| Profit growth lift from traffic analytics | +104% | IHL Group / Pygmalios |
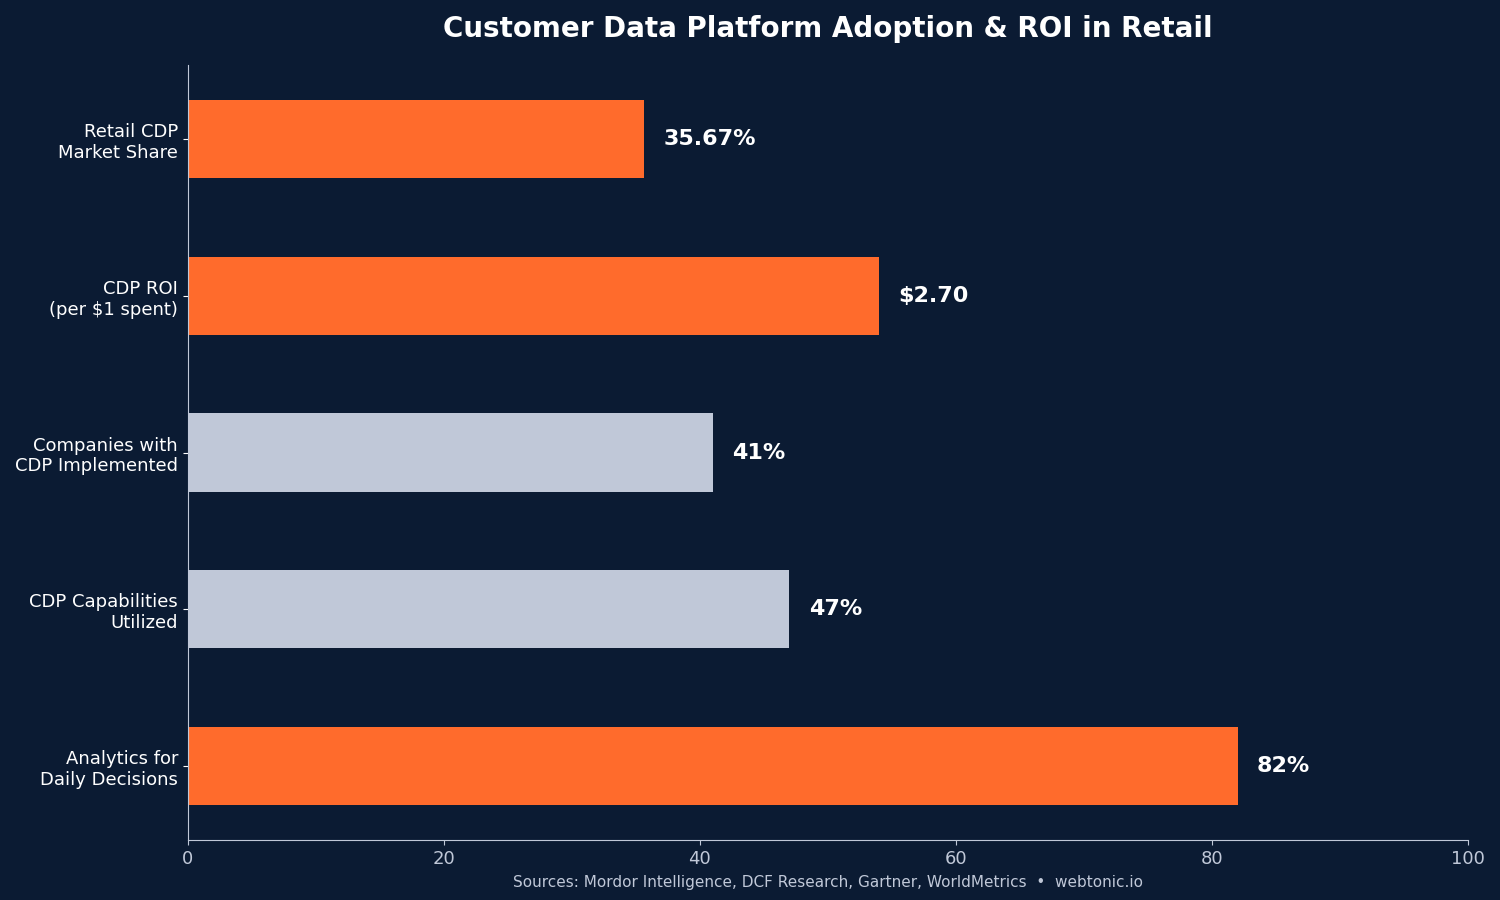
| Retailers using daily data analytics | 82% | WorldMetrics, 2026 |
| C&R tech investment improving value | 86% | KPMG, 2026 |
| CDP ROI for retail organizations | $2.70 per $1 | DCF Research, 2026 |
| CDP market size (2026) | $4.58B | Mordor Intelligence |
Retail Analytics Market Size and Growth Projections
The retail analytics sector is expanding rapidly as phone and tech retailers invest in tools that convert raw data into actionable intelligence. MarketsandMarkets projects the market at $11.31 billion in 2026, growing to $20.65 billion by 2031 at a 12.8% CAGR. GII Research places the 2026 valuation slightly higher at $12.90 billion with a trajectory reaching $27.46 billion by 2032.
Agentic AI is emerging as the next growth catalyst. Technavio forecasts $36.70 billion in market growth from 2025 to 2030 at a 30.3% CAGR, driven specifically by operational autonomy through AI agents that can execute inventory decisions, pricing adjustments, and promotional triggers without human intervention. For phone retailers managing thousands of SKUs across seasonal product cycles, this shift from descriptive dashboards to autonomous decision engines represents the largest capability jump since the adoption of cloud-based business intelligence.
Analytics Maturity Across Mid-Market Retail
InnovationVista's 2026 mid-market survey segments analytics maturity into three stages — stabilized, optimized, and monetized — and reveals where retailers stand at each revenue band.
| Revenue Band | Stabilized | Optimized | Monetized |
|---|---|---|---|
| $10M–$100M | 87% | 71% | 38% |
| $100M–$250M | 95% | 82% | 58% |
| $250M–$1B | 97% | 88% | 68% |
Retail's 54.7% aggregate monetization rate exceeds manufacturing (53.7%) and insurance (52%), driven by direct ROI visibility in stock-out reduction and sell-through velocity. For phone and tech retailers specifically, AI monetization leads all industries at 39.7% versus a 16.9% cross-industry baseline (InnovationVista, 2026). The gap between the smallest and largest retailers in monetization — 38% vs. 68% — highlights how analytics investment compounds with scale.
Foot Traffic and In-Store Analytics for Telecom Retail
Physical phone and tech retail stores generate enormous amounts of behavioral data that most retailers underutilize. IHL Group research shows retailers using geo-location and traffic-driven tools see 104% higher profit growth compared to non-adopters (Pygmalios, 2026). That gap is not marginal — it represents a doubling of profit trajectory.
In a 600-store study, approximately 60% of stores improved conversion rates after implementing analytics, with an average increase of 4.29 percentage points — a 33% improvement (ReBiz, 2026). Retailers that align staffing, training, and layout with observed behavior have seen conversion increase by 14% in telecom stores, where each lost sale carries significant revenue impact due to high transaction values.
81% of telecom retailers are adopting vendor-managed inventory models that rely on analytics-driven demand sensing to reduce overstock and enable faster fulfillment (Intelocate, 2026). This shift from traditional replenishment to data-informed supply chain decisions is critical when product cycles compress and new device launches create unpredictable demand spikes.
Technology Investment and AI Adoption in Consumer Retail
The KPMG 2026 Global Tech Report surveyed 2,450 executives across 26 countries and found consumer and retail businesses are among the top sectors in realizing measurable returns from technology investment.
| KPMG Finding | Statistic |
|---|---|
| C&R executives investing $50M+ in digital tech annually | 52% |
| Report technology investment improving business value | 86% |
| Financial value realized from AI and intelligent technologies | 31–40% |
| Data and analytics as investment priority | 49% expanding, 34% scaling |
| AI and automation deployment priority | 42% expanding, 41% scaling |
| Self-described fast followers (not early adopters) | 63% |
| Active deployment of AI use cases (growth from 29%) | Growing steadily |
| Cybersecurity optimization level (vs. 48% cross-sector avg) | 66% |
Technical debt is less of a barrier in retail than other industries: only 48% of C&R executives say fixing technical debt prevents new technology programs, significantly below the 63% cross-sector average. This positions phone and tech retailers to adopt next-generation analytics tools — including real-time customer journey mapping and predictive demand sensing — faster than peers in manufacturing or financial services.
Customer Data Platforms in Phone and Tech Retail
Customer data platforms have become essential infrastructure for phone and tech retailers managing cross-channel customer relationships. The CDP market is valued at $4.58 billion in 2026, projected to reach $13.14 billion by 2031 at a 23.47% CAGR (CDP.com / Mordor Intelligence). Retail and e-commerce represent 35.67% of total CDP market share by end-user industry — the largest single vertical.
Retail organizations utilizing a mature CDP report an average return of $2.70 for every $1 spent (DCF Research, 2026), primarily driven by improved marketing efficiency and higher customer lifetime value. Yet adoption remains uneven: 41% of companies have implemented a CDP, with another 36% considering it, and even adopters estimate using only 47% of total capabilities available (Gartner, 2024). For phone retailers juggling carrier partnerships, accessory cross-sells, and trade-in programs, the unified customer view a CDP provides can unlock significant incremental revenue per customer.
Cloud deployments now account for 88.43% of the CDP market (Mordor Intelligence, 2025), reflecting the industry's preference for scalable, maintenance-free infrastructure over on-premise installations. For phone and tech retailers managing seasonal demand spikes around product launches and holiday periods, cloud-native CDPs can elastically scale data processing without the fixed costs of on-premise hardware. The practical implication: retailers evaluating CDP vendors should prioritize cloud-native architectures with real-time identity resolution capabilities, as the 23.47% CAGR growth will be driven overwhelmingly by cloud-first solutions that integrate directly with advertising platforms, point-of-sale systems, and paid media channels.
Intense regulatory pressure, the retirement of third-party cookies, and elastic cloud economics are collectively accelerating enterprise investment in unified first-party data layers. Vendors that embed warehouse-native connectors and zero-copy pipelines are gaining market share because they eliminate data egress fees while sustaining real-time identity graphs. Retailers, banks, and healthcare providers that deployed customer data platforms before 2025 are now reporting double-digit gains in conversion rates, reduced churn, and increased lifetime value — narrowing the performance gap between data-rich enterprises and their less sophisticated competitors.
Analytics Best Practices for Phone and Tech Retailers
- Start with foot traffic attribution. Retailers using traffic-driven tools see 104% higher profit growth. Deploy entrance counters, Wi-Fi sensing, or video analytics to connect marketing spend to store visits before optimizing anything else.
- Prioritize data monetization over data collection. With 97% of large retailers already stabilized on data infrastructure, the competitive edge shifts to monetization. Focus on predictive replenishment, markdown optimization, and ad spend attribution rather than building more dashboards.
- Invest in a customer data platform. Retail earns $2.70 per $1 spent on CDP technology, and the 35.67% market share proves peers are already investing. Start with identity resolution across in-store, web, and app channels.
- Align staffing with analytics insights. Stores that align staffing with observed traffic patterns improve conversion by 14% in telecom retail. Schedule specialists during peak research hours, not just peak transaction hours.
- Measure AI ROI explicitly. Consumer retail already realizes 31–40% of financial value from AI (KPMG). Set specific ROI targets for each AI use case — demand forecasting, personalized pricing, or automated campaign optimization — and track against the 86% benchmark of value-positive technology investments.
Phone and Tech Retail Analytics vs. Other Industries
| Industry | Data Monetization Rate | AI Monetization Rate | Key Differentiator |
|---|---|---|---|
| Phone & Tech Retail | 54.7% | 39.7% | Direct ROI visibility, fast product cycles |
| Manufacturing | 53.7% | 27.3% | Supply chain optimization, IoT integration |
| Insurance | 52.0% | 22.8% | Claims automation, risk modeling |
| Healthcare | 44.2% | 18.4% | Patient outcomes, regulatory compliance |
| Financial Services | 58.3% | 35.1% | Fraud detection, trading algorithms |
Related reading
- Phone & Tech Retail Email Marketing Statistics
- Phone & Tech Retail Marketing Attribution Statistics: What 2026 Data Shows
- Phone & Tech Retail Marketing Dashboards: 48 Reporting Statistics for 2026
- Marketing Analytics services at Web Tonic
Frequently Asked Questions
How large is the retail analytics market in 2026?
The global retail analytics market is valued between $11.31 billion and $12.90 billion in 2026, depending on the research methodology. MarketsandMarkets projects growth to $20.65 billion by 2031, while GII Research forecasts $27.46 billion by 2032, reflecting strong demand for data-driven decision tools across the retail sector.
What ROI can phone retailers expect from analytics investments?
Retailers using mature customer data platforms report $2.70 return for every $1 spent (DCF Research). Foot traffic analytics tools deliver even larger returns, with adopters seeing 104% higher profit growth than non-adopters (IHL Group). The compound effect of better attribution, staffing optimization, and inventory management drives these returns.
What percentage of retailers have adopted data analytics?
82% of retailers use data analytics for daily decision-making (WorldMetrics, 2026), and 97% of retailers with $250M+ revenue have stabilized their data infrastructure (InnovationVista). The maturity gap now lies in monetization — converting data investments into measurable revenue improvements — where only 38–68% have reached the monetization stage depending on company size.
How does AI impact retail analytics in 2026?
Consumer retail businesses realize 31–40% of their total financial value from AI and intelligent technologies (KPMG, 2026). Retail's AI monetization rate of 39.7% leads all industries, more than double the 16.9% cross-industry baseline. The shift toward agentic AI — systems that autonomously execute pricing, inventory, and promotional decisions — is the next major capability jump for tech retailers.
Should phone retailers invest in a customer data platform?
Yes. Retail and e-commerce represent 35.67% of CDP market share — the largest single vertical — because unified customer profiles directly improve cross-sell efficiency, trade-in program targeting, and lifecycle marketing performance. The $2.70 per $1 ROI benchmark provides a clear business case, though retailers should note that even adopters utilize only 47% of CDP capabilities (Gartner), meaning significant upside remains from deeper implementation.
Sources
GII Research — Retail Analytics Market 2026–2032
MarketsandMarkets — Retail Analytics Market 2026–2031
InnovationVista — Retail Analytics Maturity Survey 2026
Pygmalios / IHL Group — Foot Traffic Analytics for Telecom Retail
ReBiz — Retail Store Analytics Performance Study
KPMG — 2026 Global Tech Report: Consumer & Retail
DCF Research — Customer Data Platform ROI 2026
CDP.com / Mordor Intelligence — CDP Industry Statistics
WorldMetrics — Retail Digital Transformation Statistics
Intelocate — 10 Wireless Store Ops Strategies for 2026


