Table of contents

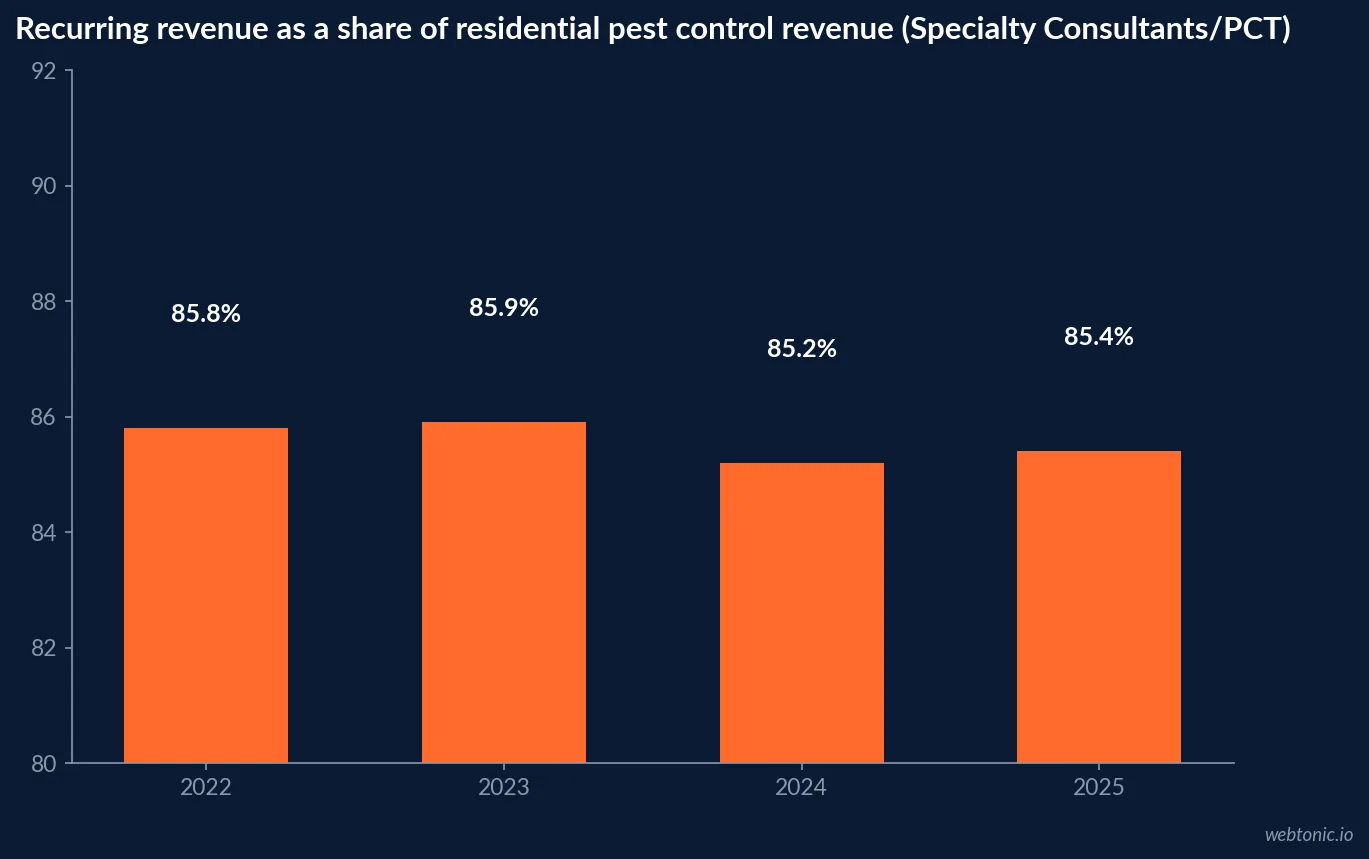
Recurring service plans already carry 85.4% of U.S. residential pest control revenue, according to the 26th annual Specialty Consultants industry analysis reported by Pest Control Technology. That single figure reframes the 2026 marketing budget question: it is not whether to fund retention, it is how much of the budget should defend an 85%-recurring base against a smaller but costlier pool of new leads.
Key Takeaways
- Recurring revenue is 85.4% of residential pest control revenue in 2025.
- The U.S. structural pest control industry generated USD 13.416 billion in 2025.
- That is a USD 762 million increase over 2024's USD 12.654 billion.
- Nearly 13.29 million residential customers bought a professional service in 2025.
- Commercial pest control revenue grew nearly 7.0% in 2025.
- 53% of operators expect 2026 conditions to improve - an 18-point jump year over year.
- Material costs jumped 12 points to become the top-cited 2026 business risk.
- Planned software investment more than doubled year over year.
- AI is now the No. 1 technology priority, ahead of marketing automation.
- 69% of PMPs project add-on service revenue will increase in 2026.
- 41% of PMPs already earn 11% to 25% of revenue from add-on services.
- Only 2% of PMPs project add-on revenue will decrease.
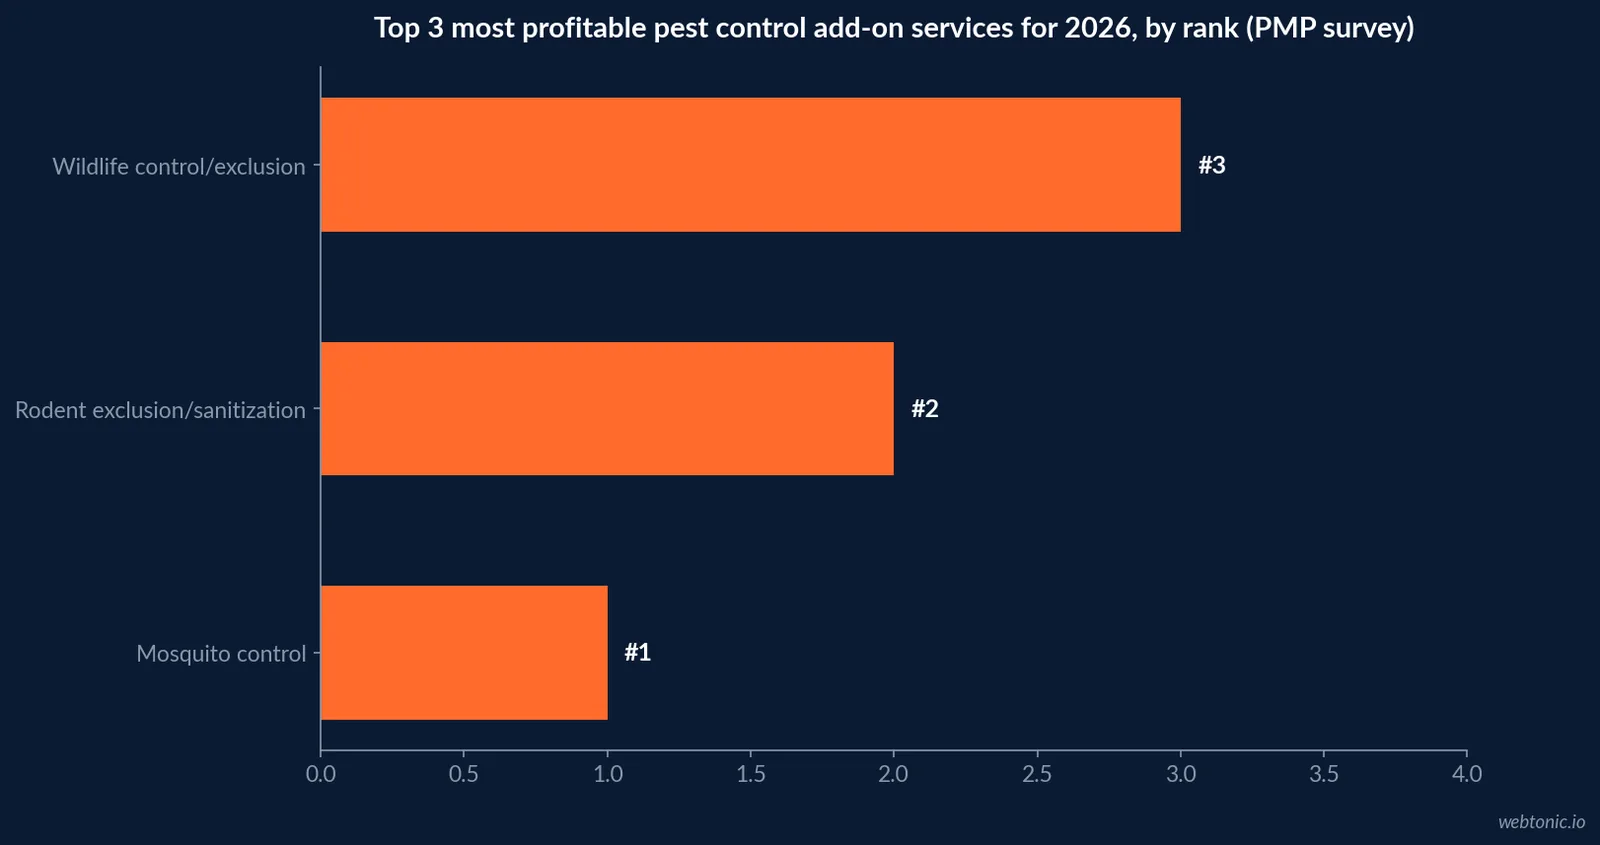
- Mosquito control is the No. 1 most profitable add-on service.
- Rodent exclusion and wildlife control rank second and third for add-on profit.
- 3 in 10 households used a pest control service in the past 12 months, per a 2021 study.
- Many recurring-plan customers still say they would switch providers for price or novelty.
- Reviews and referrals rank above price as trust signals in the purchase decision.
| Metric | 2025/2026 figure | Source |
|---|---|---|
| U.S. structural pest control revenue | USD 13.416 billion (2025) | Specialty Consultants / PCT |
| Recurring share of residential revenue | 85.4% (2025) | Specialty Consultants / PCT |
| Residential customers served | ~13.29 million (2025) | Specialty Consultants / PCT |
| Operators expecting 2026 improvement | 53% (+18 points YoY) | FieldRoutes 2026 State of the Pest Industry |
| PMPs projecting add-on revenue growth | 69% | PMP 2026 Revenue & Profit Projections |
| Households using pest control in past 12 mo. | ~3 in 10 | FieldRoutes Consumer Purchasing Report, 2021 |
The revenue base a retention budget is defending
The 26th edition of A Strategic Analysis of the U.S. Structural Pest Control Industry, a syndicated market report from Specialty Consultants covering 800 surveyed owners and managers, found the industry generated USD 13.416 billion in total service revenue in 2025, a USD 762 million increase over the USD 12.654 billion measured in 2024. Nearly 13.29 million residential customers received a professional pest control service, and recurring revenue accounted for 85.4% of residential service revenue - up slightly from 85.2% in 2024. The commercial segment grew nearly 7.0% in the same period.
An 85%-recurring revenue base means the marginal dollar of new-customer acquisition spend is competing against a much larger, already-won pool of accounts. Every point of churn against that base costs more than the equivalent point of new growth, which is the arithmetic argument for weighting 2026 budgets toward retention.
How operators feel about 2026 - and what it costs them
FieldRoutes' 2026 State of the Pest Industry report, based on a survey of more than 1,000 pest control operators, found 53% expect market conditions to improve in 2026, an 18-point jump from the prior year's survey. But material costs became the No. 1 cited business risk for the first time, up 12 points year over year, and planned investment in new software more than doubled as the fastest-growing spend category. AI moved to the No. 1 anticipated technology priority for the next one to three years, ahead of marketing automation and data analytics.
Rising material costs squeeze the margin on every new job, which is exactly the environment where a retained, recurring-plan customer - already priced, already routed - is worth defending over chasing a new lead at 2026 material prices.
| 2026 operator sentiment (FieldRoutes survey, n=1,000+) | Figure | Change vs. prior year |
|---|---|---|
| Expect market conditions to improve | 53% | +18 points |
| Cite material costs as top business risk | Now #1 | +12 points |
| Planned new-software investment | More than doubled | Fastest-growing category |
| Top anticipated technology, next 1-3 years | AI | Moved ahead of marketing automation |
Add-on services: the highest-return place to spend on existing customers
Pest Management Professional's 2026 Revenue & Profit Projections report, published on mypmp.net, part of its annual State of the Industry survey, found 69% of PMPs project their add-on service revenue will increase in 2026, while only 2% project a decrease. That builds on 2025, where 41% of PMPs reported add-on services at 11% to 25% of total company revenue. The top profit-generating add-ons were mosquito control, rodent exclusion and sanitization, and wildlife control and exclusion - all sold into a customer the company already services, which makes them a retention-marketing outcome as much as a sales one.
| Add-on service rank (2026 profitability) | Service | Sold into |
|---|---|---|
| 1 | Mosquito control | Existing recurring residential accounts |
| 2 | Rodent exclusion / sanitization | Existing recurring residential accounts |
| 3 | Wildlife control / exclusion | Existing recurring residential accounts |
| 4 | Termite monitoring / baiting | Existing recurring residential accounts |
| 5 | Bed bug treatments | New or existing accounts |
The loyalty gap a recurring-plan customer still represents
A recurring service agreement is not the same as a loyal customer. FieldRoutes' Consumer Pest Control Purchasing Report, an independent 2021 study of more than 2,000 pest control customers conducted by Lucid, found that roughly 3 in 10 households purchased pest control services in the prior 12 months, and while many with a recurring plan report being satisfied, a meaningful share said they would still switch providers for a better price or to try something new. The same study found customers prioritize a company's reputation and reasonable price above all else, and lean on online reviews and recommendations from family and friends to validate that reputation before booking.
That combination - satisfied but switchable, price-sensitive but reputation-driven - is the case for review-generation and referral programs as a budget line distinct from lead-generation media, since they defend the recurring base rather than compete for the same new-lead auction.
| Purchase-decision factor (2021 study, 2,000+ pest customers) | Customer behavior | Source |
|---|---|---|
| Past-12-month purchase rate | ~3 in 10 households | FieldRoutes / Lucid |
| Loyalty on recurring plans | Satisfied but open to switching on price/novelty | FieldRoutes / Lucid |
| Top trust signal before booking | Reputation + reasonable price | FieldRoutes / Lucid |
| Reputation validation method | Online reviews + friend/family referral | FieldRoutes / Lucid |
| Booking channel | Primarily phone, rising online interest | FieldRoutes / Lucid |
Where the NPMA's own tracking sits
The National Pest Management Association's industry fact sheet tracks structural pest management market size and scope alongside Specialty Products Consultants, and is published annually - the same underlying research feeding the recurring-revenue figures above. Firms building a 2026 plan should treat the 85.4% recurring-revenue share as the number to protect, and size the retention line item against the cost of replacing that share with new-customer acquisition at 2026's higher material costs.
A simple way to split the 2026 budget
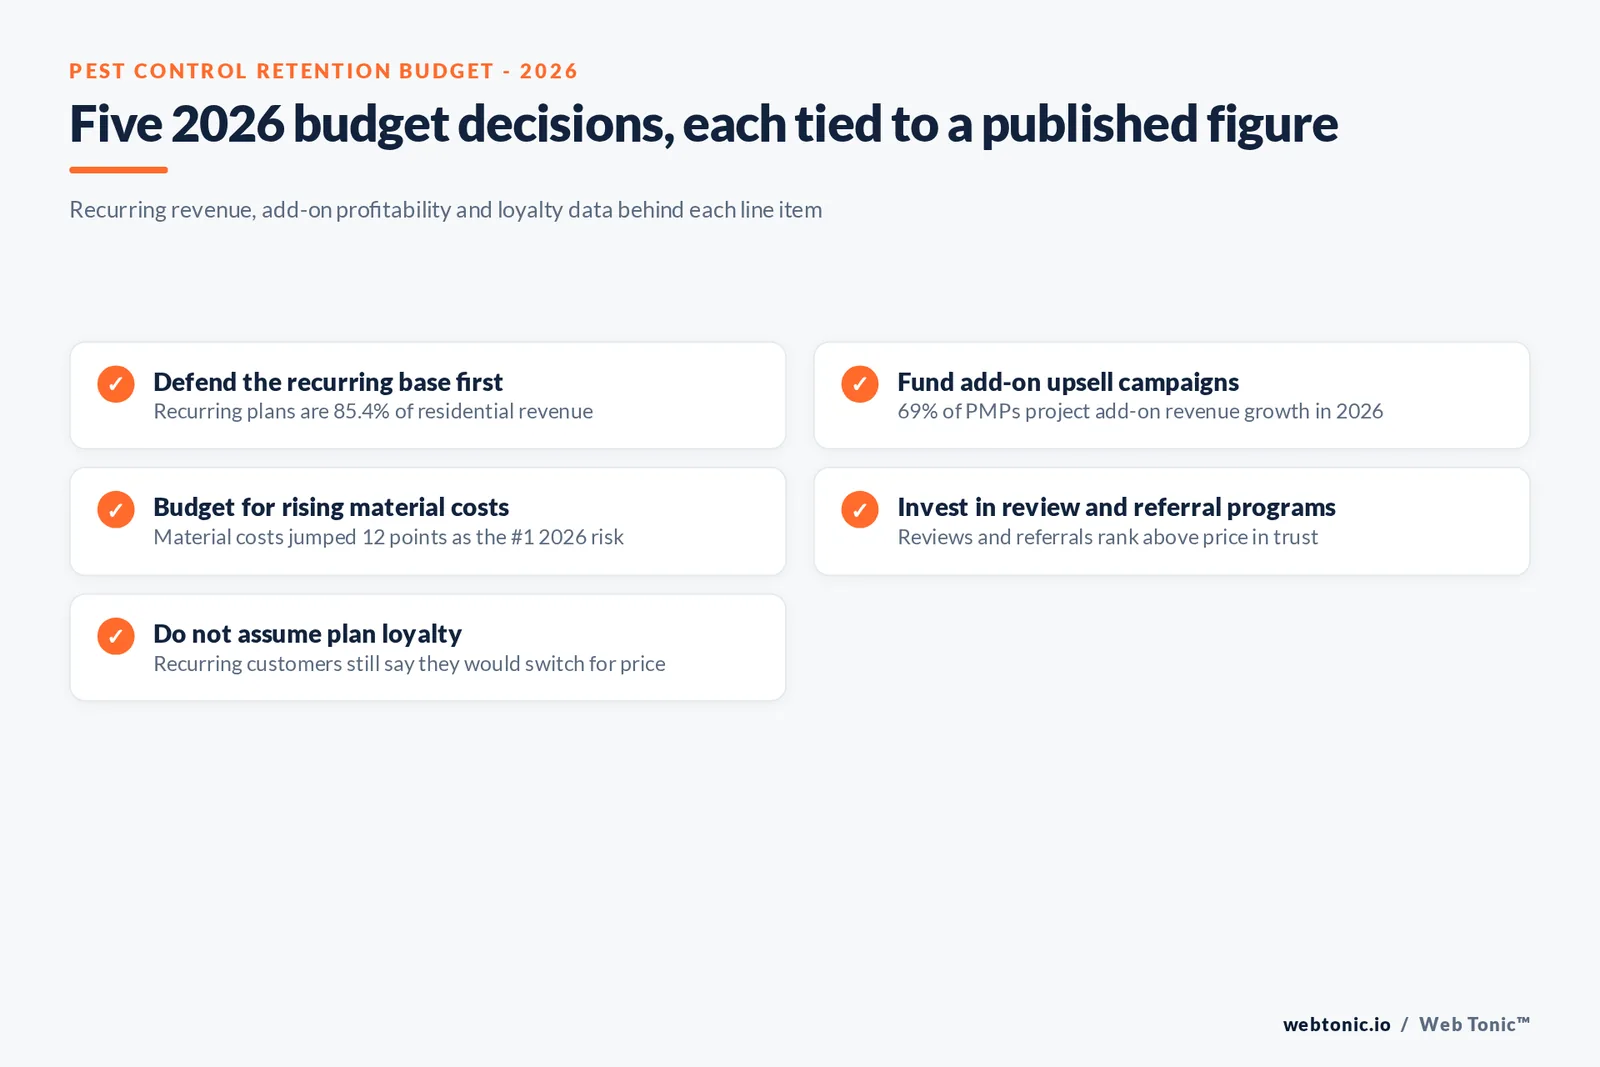
None of the sources above name a Web Tonic figure or price a specific media plan - they describe industry-wide revenue shares and survey sentiment. Use them as a sizing input, not a quote: if 85% of revenue is recurring and material costs are rising faster than lead volume, a retention-weighted split (reviews, referral programs, add-on upsell campaigns, service-agreement renewal reminders) is the defensible starting allocation for 2026, adjusted to your own churn data. Our growth marketing practice and data and analytics practice build that split from a company's own numbers rather than an industry average.
How pest control compares with other recurring-service trades
An 85%-recurring revenue base is high even among service businesses built on repeat visits. For context on how other trades measure the same lifecycle question in their own terms, see our companion pages on customer retention statistics and customer lifetime value statistics, which cover the churn and lifetime-value math this page applies specifically to pest control.
| Revenue mix component (2025) | Share | What it implies for 2026 budget |
|---|---|---|
| Recurring residential service plans | 85.4% of residential revenue | The core line item to protect |
| Commercial segment growth | ~7.0% YoY | A separate, faster-growing acquisition target |
| Add-on services (41% of PMPs) | 11%-25% of company revenue | Upsell budget, not new-lead budget |
| New-customer acquisition | Remaining ~14.6% of residential revenue | Smallest slice, highest 2026 cost pressure |
What the NPMA's broader research adds
The recurring-revenue figures above come from Specialty Consultants' syndicated market report, which partners with more than 60% state or local association members and over half NPMA members among its 800 surveyed operators - meaning the recurring-revenue baseline reflects the same population the NPMA's own fact sheet tracks. That overlap matters for a 2026 budget conversation: it means the 85.4% figure is not an outlier estimate from a single vendor's customer base, it is close to the structural norm across the surveyed industry, which makes it a safe number to plan a 2026 retention line item against rather than treat as a best case.
Every figure cited here names its issuer and survey size rather than an anonymous "industry average," which is deliberate: pest control marketing decisions built on a syndicated 800-operator market report and a 1,000-plus-operator FieldRoutes survey carry more weight than an assumption, and that traceability is what a 2026 retention budget should be built on.
Frequently Asked Questions
How much of pest control revenue already comes from recurring customers?
Most of it. Specialty Consultants' 26th annual Strategic Analysis of the U.S. Structural Pest Control Industry, reported by Pest Control Technology, found recurring revenue accounted for 85.4% of residential pest control service revenue in 2025, up slightly from 85.2% in 2024 and roughly stable since 2022. That is the baseline any retention budget is defending, not building from zero.
Should 2026 marketing budgets shift toward retention or new-customer acquisition?
The industry's own growth expectations argue for both, weighted differently by company size. FieldRoutes' 2026 State of the Pest Industry report - a survey of more than 1,000 operators - found 53% expect market conditions to improve in 2026, an 18-point jump from the prior year, while material costs became the top-cited business risk for the first time, jumping 12 points year over year. Rising costs make every retained account worth more than a new one acquired at 2026 prices.
What is the most profitable place to put retention-adjacent marketing dollars?
Add-on services sold into the existing customer base. Pest Management Professional's 2026 revenue projections report found 69% of PMPs project their add-on service revenue will increase in 2026, and 41% of PMPs already report add-on services at 11% to 25% of total company revenue. Mosquito control, rodent exclusion and wildlife control rank as the top three profit drivers - all upsells to an existing recurring account, not new-customer wins.
Are pest control customers actually loyal to one company?
Less than operators might assume. FieldRoutes' Consumer Pest Control Purchasing Report, a 2021 study of over 2,000 pest control customers, found that while most customers on a recurring plan report being satisfied, many are still willing to switch providers for a better price or to try a different company - evidence of a loyalty gap that a retention program, not just a service agreement, has to close.
What is pest control's realistic budget lever for retention in 2026?
Software and reputation, based on the data. FieldRoutes' 2026 survey found planned investment in new software more than doubled year over year, with retention and scheduling tools named as compounding advantages for larger operators, while the Consumer Pest Control Purchasing Report found online reviews and referrals from family and friends are the top trust signals customers use before switching providers - both are retention-adjacent line items, not acquisition media spend.
Sources
Pest Control Technology - U.S. structural pest control market grew 6% in 2025 (Specialty Consultants, 26th ed.)
FieldRoutes - 2026 Pest Control Industry Report
Pest Management Professional - 2026 Revenue & Profit Projections for Pest Control
FieldRoutes - Consumer Pest Control Purchasing Report, 2021
National Pest Management Association - Industry Fact Sheet