Table of contents
Painting carries the highest cost per click in home services at $13.74 and a $138.38 cost per lead, yet the average advertised lead closes at just 20%. A painting marketing dashboard that reports clicks and leads is reporting the two numbers that matter least.
Key Takeaways
- Painting has the highest cost per click of any home-services category at $13.74.
- Painting cost per lead averages $138.38 at a 10.80% click-to-lead rate.
- Advertised painting leads close at roughly 20% versus 50%+ for referrals.
- Average job value is $2,021 interior and $3,177 exterior.
- Residential job-level gross margin runs 45–55%, so cost of goods is the other half.
- Painting net margin lands at 15–20% — a 2-point reporting error is a tenth of the profit.
- At a 20% close rate, $138.38 per lead is about $692 of media per booked job.
- Best-in-class contractors keep missed calls under 7%; above 10% is lost revenue.
- Growth-stage home-services marketing spend runs 10–12% of revenue, mature shops 8–10%.
- Commercial painting targets: 38–46% gross margin per job and a 25–35% bid-to-award ratio.
- Estimator productivity benchmarks at $1.8M–$3.5M booked revenue per estimator per year.
- Commercial cycle time from walkthrough to signed purchase order is 14–45 days.
- The dashboard software market reaches about $7.88B in 2026, heading to $14.8B by 2030.
- 67–68% of organisations use dashboards and 78% of executives decide with them.
- Only 52% of teams fill the CRM lead-source field, and CSRs mislabel sources 30–50% of the time.
- Roughly 40% of home-services phone leads never get attributed to a source at all.
Painting Reporting Benchmarks at a Glance
These are the figures a painting dashboard should be built around. Everything else is decoration. The acquisition numbers come from home-services benchmark data for the painting category; the operational targets come from contractor KPI frameworks.
| Metric | 2026 painting benchmark | What it decides |
|---|---|---|
| Cost per click | $13.74 (highest in home services) | Whether search is affordable at your close rate |
| Click-to-lead rate | 10.80% | Landing page and call-handling quality |
| Cost per lead | $138.38 | Channel mix, not campaign settings |
| Ad-lead close rate | ~20% | Estimator process and follow-up speed |
| Referral close rate | 50%+ | Whether paid media is your growth ceiling |
| Average job value | $2,021 interior / $3,177 exterior | Ceiling on allowable cost per booked job |
| Job-level gross margin | 45–55% residential | Contribution per job, the real ROAS denominator |
| Net margin | 15–20% | How much a reporting error actually costs |
| Marketing as % of revenue | 10–12% growth stage, 8–10% mature | Whether the budget itself is the problem |
The Only Dashboard Chain That Matters: Click to Contribution
Chain the painting benchmarks together and the arithmetic makes the case for itself. A $13.74 click becomes a $138.38 lead at a 10.80% conversion rate. Twenty percent of those leads become jobs, which puts roughly $692 of media into every booked job. An interior repaint at $2,021 with a 45% job-level gross margin contributes about $909. The gap between $692 and $909 is the entire business — and it is invisible on a dashboard that stops at cost per lead.
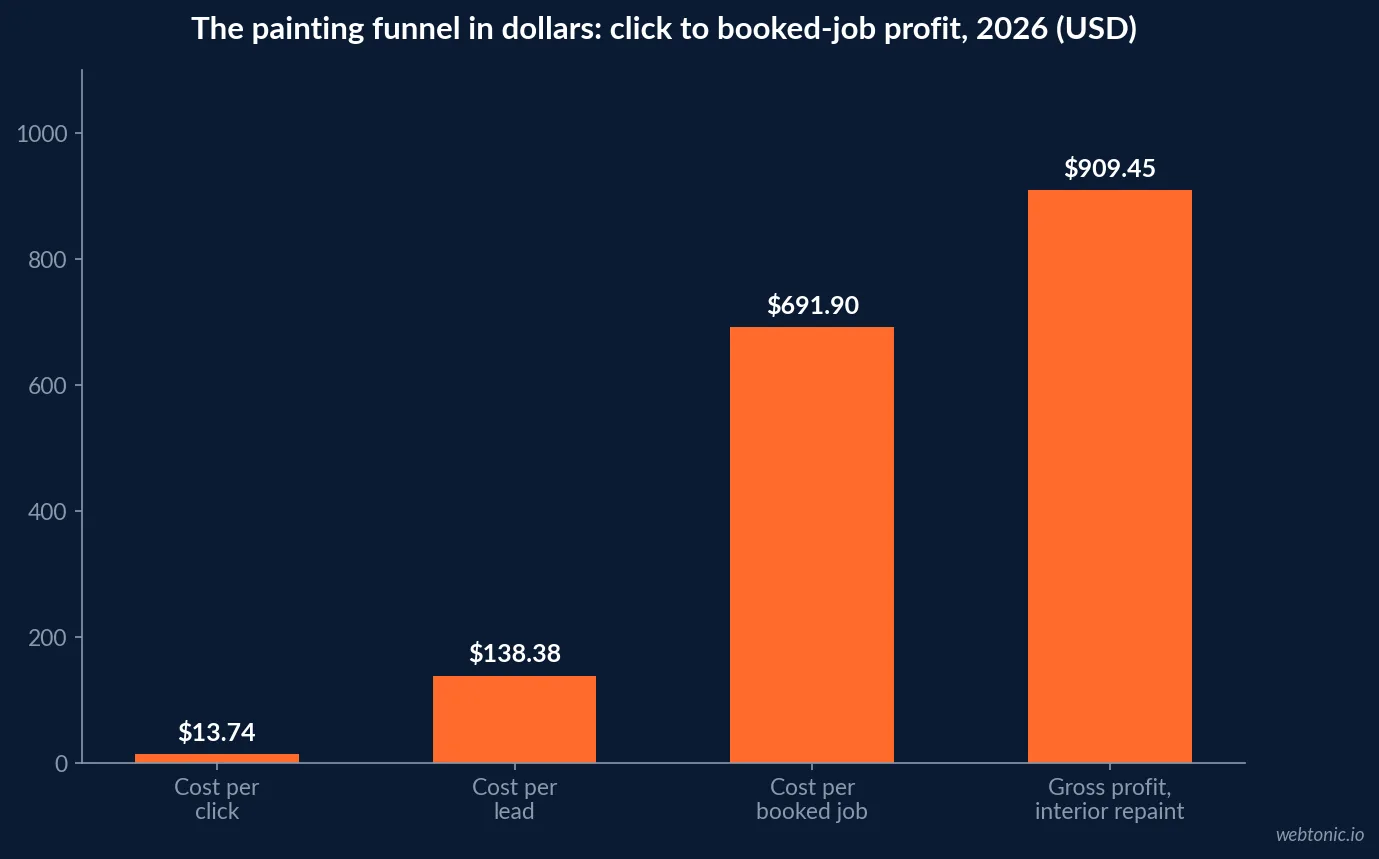
Two consequences follow. First, a 5-point swing in close rate moves cost per booked job more than any bid adjustment: at 25% the media cost per job falls to about $554, at 15% it rises to $923 and the job stops paying for itself. Second, exterior work at $3,177 can absorb a materially higher cost per lead than interior work, which is an argument for reporting acquisition cost by service line rather than by campaign.
Dashboard Adoption: Enterprise Standard, Contractor Exception
Reporting software is no longer a competitive edge in most industries. The dashboard software market sits at roughly $7.88 billion in 2026, up from about $6.88 billion in 2025 and forecast to pass $14.8 billion by 2030. More than 60% of deployments are cloud-based and Asia-Pacific is expanding at close to a 20% CAGR.
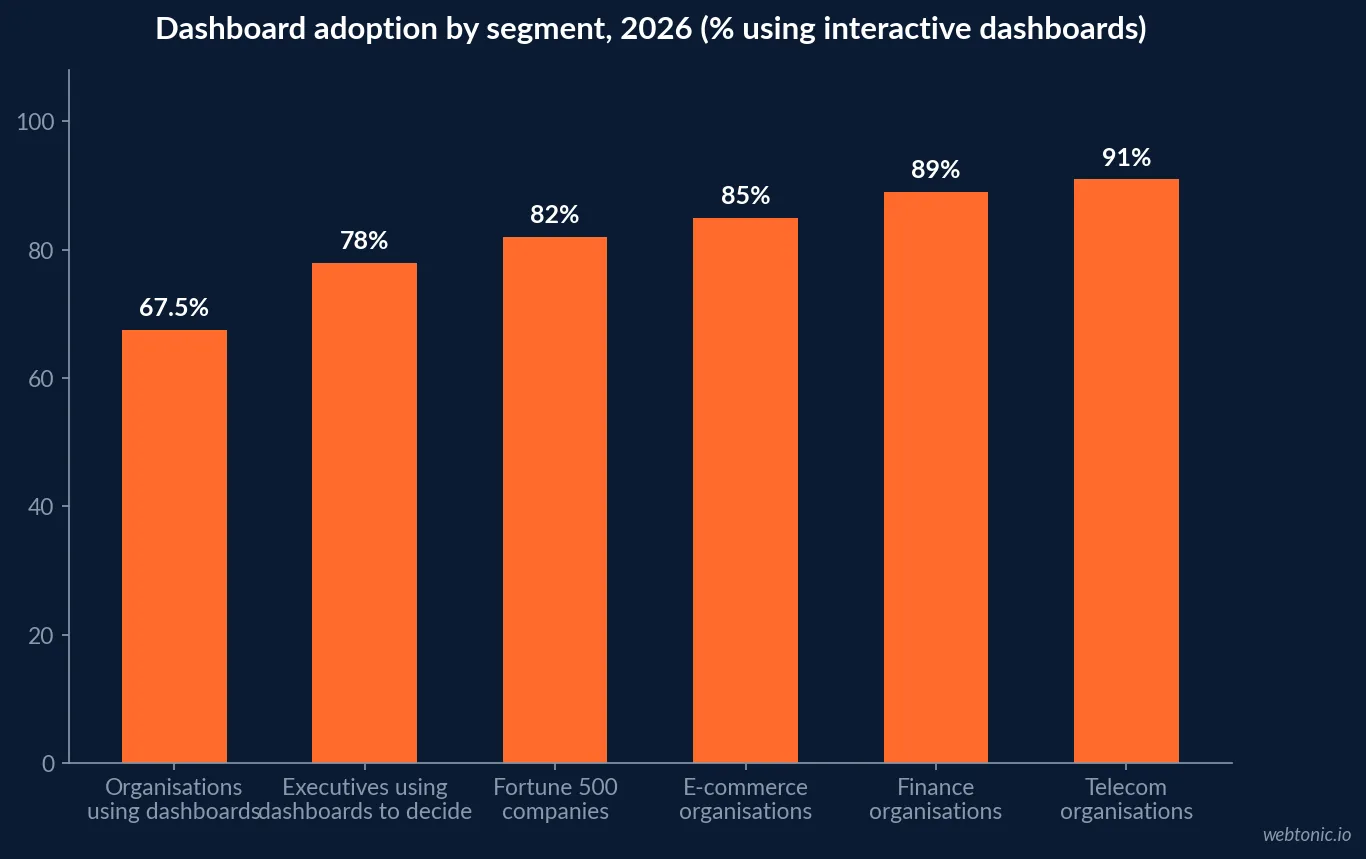
Adoption is lopsided by sector: 91% of telecom, 89% of finance and 85% of e-commerce organisations depend on dashboards, against 67–68% of organisations overall. Painting contractors sit at the bottom of that distribution, which means the reporting layer is one of the few places where a $4M shop can still buy an advantage that its competitors have not bought yet. The data usually already exists inside the CRM and the field-service platform; it simply has not been organised into a weekly view.
The Twelve Numbers a Painting Dashboard Should Show
Contractor KPI frameworks converge on a compact set. The version below is trimmed to what a painting shop between $1M and $15M can populate without new software, using targets published in home-services KPI dashboard guidance and commercial painting sales KPI benchmarks.
| # | Metric | Target / benchmark | Review cadence |
|---|---|---|---|
| 1 | Marketing spend as % of revenue | 10–12% growth, 8–10% mature | Monthly |
| 2 | Cost per lead by channel | $138.38 blended painting average | Weekly |
| 3 | Missed-call rate | Under 7% best-in-class, alarm above 10% | Weekly |
| 4 | Lead-to-estimate rate | Track trend; drops signal scheduling gaps | Weekly |
| 5 | Estimate close rate | ~20% advertised, 50%+ referral | Weekly |
| 6 | Average job value | $2,021 interior / $3,177 exterior | Monthly |
| 7 | Cost per booked job | ~$692 at benchmark CPL and close rate | Weekly |
| 8 | Job-level gross margin | 45–55% residential, 38–46% commercial | Per job |
| 9 | Labour as % of revenue | 32–38% commercial | Monthly |
| 10 | Materials as % of revenue | 18–24% commercial | Monthly |
| 11 | Callback / warranty rate | Under 2.5% | Monthly |
| 12 | Crew utilisation (billable hours) | 75–85% | Weekly |
Note what is absent: impressions, reach, follower growth and any metric that cannot be traced to a booked job. A painting dashboard is a job-cost dashboard with a marketing tab, not the reverse. If you want the channel-level view that feeds metric 2, our painting analytics statistics breakdown covers the measurement layer underneath it.
Residential and Commercial Need Two Different Dashboards
The most common reporting mistake in a mixed shop is one blended dashboard. Residential and commercial painting have different cycle times, different denominators and different failure modes, so a blended cost per lead is a number that describes neither.
| Dimension | Residential repaint | Commercial / MSA work |
|---|---|---|
| Typical contract value | $2,021 interior / $3,177 exterior | $45k–$180k project, $250k–$1.2M multi-property |
| Cycle time | Days to a few weeks | 14–45 days walkthrough to signed PO |
| Gross margin per job | 45–55% | 38–46% |
| Win-rate metric | Estimate close rate (~20% advertised) | Bid-to-award ratio (25–35%) |
| Revenue stability metric | Repeat and referral share | Recurring MSA mix, target 35–50% |
| Capacity metric | Crew utilisation 75–85% | Estimator productivity $1.8M–$3.5M per year |
| Premium lever | Colour consultation, warranty | Night / occupied-building premium of 15–25% |
| Primary risk on the dashboard | Missed calls and slow follow-up | Overbooked schedule and callback liability |
The commercial column is where reporting discipline pays best. Shops that hold a 25–35% bid-to-award ratio, keep callbacks under 2.5% and carry 35–50% recurring revenue tend to run at 12–15% net profit; ignoring any single one of those metrics typically leaks 2–4 points of profitability a year. On the lead-generation side, the commercial pipeline is also where a LinkedIn Ads programme is worth reporting separately, because a $150 lead against a $725k master services agreement is a completely different economic event to a $138 residential lead.
Your Dashboard Inherits Your Data Quality
Dashboards fail in the trades for an unglamorous reason: the inputs are wrong before the chart is drawn. Only 52% of teams reliably fill the lead-source field in their CRM, customer service representatives mislabel the source of a call 30–50% of the time, and roughly 40% of home-services phone leads are never attributed to any source. Since 60–80% of home-services leads arrive by phone, a beautiful dashboard built on form-fill data is describing a minority of the business.
Three fixes precede any visualisation work. First, dynamic number insertion with call tracking so the source is captured by software rather than memory. Second, a required lead-source field with a short closed list — free text guarantees drift. Third, a weekly five-minute reconciliation between booked jobs and recorded sources. Our painting marketing attribution statistics guide covers the wiring in detail; the dashboard is the last step of that project, not the first.
Weekly Reporting Beats Better Reporting
Cadence outperforms sophistication in a 15–20% net-margin business. Operators who review numbers weekly catch margin erosion in the second week of a month rather than three weeks after it happened, notice a technician-level or estimator-level conversion drop before it costs a five-figure sum, and reallocate a spiking campaign budget before the month closes. The same review at month-end produces a post-mortem.
Practically, that means one page, twelve numbers, one colour rule (green on target, orange within 10%, red beyond), and a named owner per line. Executives at scale already work this way — 78% use dashboards to make decisions — and there is nothing about a painting business that makes the habit less valuable, only less common.
Best Practices for a Painting Marketing Dashboard
- Report cost per booked job next to cost per lead — at a 20% close rate the two differ by 5x.
- Split residential and commercial into separate views; a blended cost per lead describes neither.
- Put missed-call rate on the marketing page, not the operations page: above 10% it is a media-waste metric.
- Use job-level gross margin (45–55% residential) as the ROAS denominator instead of revenue.
- Segment by service line — exterior work at $3,177 supports a higher acquisition cost than interior at $2,021.
- Capture lead source with call tracking, not staff recall; CSR labels are wrong 30–50% of the time.
- Cap the dashboard at twelve metrics with one owner each; unowned metrics stop being updated.
- Review weekly, reforecast monthly and only rebuild the dashboard quarterly.
- Track marketing as a percentage of revenue against the 10–12% growth-stage band before blaming channels.
- Add a callback / warranty line — rework destroys margin faster than any cost-per-click movement.
Where Reporting Goes Next for Contractors
Two shifts are worth planning for. Dashboard platforms are absorbing natural-language querying and automated anomaly detection, which lowers the skill floor for a shop without an analyst — the useful version for a painting company is an alert when cost per lead moves beyond a threshold, not a chatbot. And attribution is drifting further out of reach as AI-assisted research grows, which makes first-party inputs (call tracking, required source fields, post-sale "how did you find us" capture) the durable part of the stack. If you want help wiring that layer, our data intelligence team builds it for home-services operators, and the growth marketing team runs the channels it measures.
Frequently Asked Questions
What should a painting company's marketing dashboard actually measure?
Four layers: spend and cost per lead by channel, call handling (missed-call rate, answer rate, booked-estimate rate), estimate performance (close rate, average job value) and job-level gross margin. A painting dashboard that stops at cost per lead hides the two numbers that decide profit — the 20% ad-lead close rate and the 45–55% job-level gross margin that turns a $2,021 interior repaint into roughly $909 of contribution.
What is a good cost per lead for a painting contractor in 2026?
Benchmark data puts painting cost per lead at about $138.38 with a $13.74 cost per click and a 10.80% click-to-lead rate — the most expensive click in home services. At a 20% close rate on advertised leads, that is roughly $692 of media per booked job, so the dashboard should always show cost per booked job beside cost per lead.
How much should a painting company spend on marketing?
Home-services operators scaling toward $15M typically run marketing at 10–12% of revenue, and mature shops above $15M generate the same growth at 8–10% as referral and repeat business compound. Spending above 12% without proportional revenue growth usually points at call handling or channel mix rather than the ad platforms.
How often should painting owners review their marketing dashboard?
Weekly. The operators who catch margin erosion in week two rather than at month-end are the ones who intervene before a cost-per-lead spike burns thousands in wasted spend. Monthly reporting is a record; weekly reporting is a control.
Are marketing dashboards actually widely used?
Yes at enterprise scale and no in the trades. Roughly 67–68% of organisations use digital dashboards, 78% of executives use them for decisions and 82% of Fortune 500 companies rely on interactive dashboards, while the typical painting shop still reviews revenue and a bank balance. That gap is the opportunity.
Sources
BaaDigi — Painting marketing benchmarks 2026
9cv9 — Dashboard software statistics 2026
Profitability Partners — Home services KPI dashboard guide
PulseRevOps — Commercial painting sales KPIs
Beancount — Painting contractor job costing and KPI guide
PipelineOn — Contractor analytics dashboards
RivetOps — Why CRM reports do not match reality
PipelineOn — Contractor marketing attribution statistics
Gitnux — Dashboard usage statistics