Table of contents
Orthodontic practices reported the highest per-member patient volume in the history of the AAO's census survey in 2024, and the association can trace 24% of new patients back to one tracked referral channel. That is the clean part of the analytics story. The messier part is that a growing share of the tracking practices lean on to prove it - website pixels, ad platform conversion tags, patient-portal analytics - sits inside a 2022 HHS bulletin on health data that most marketing teams have never read end to end.
Key Takeaways
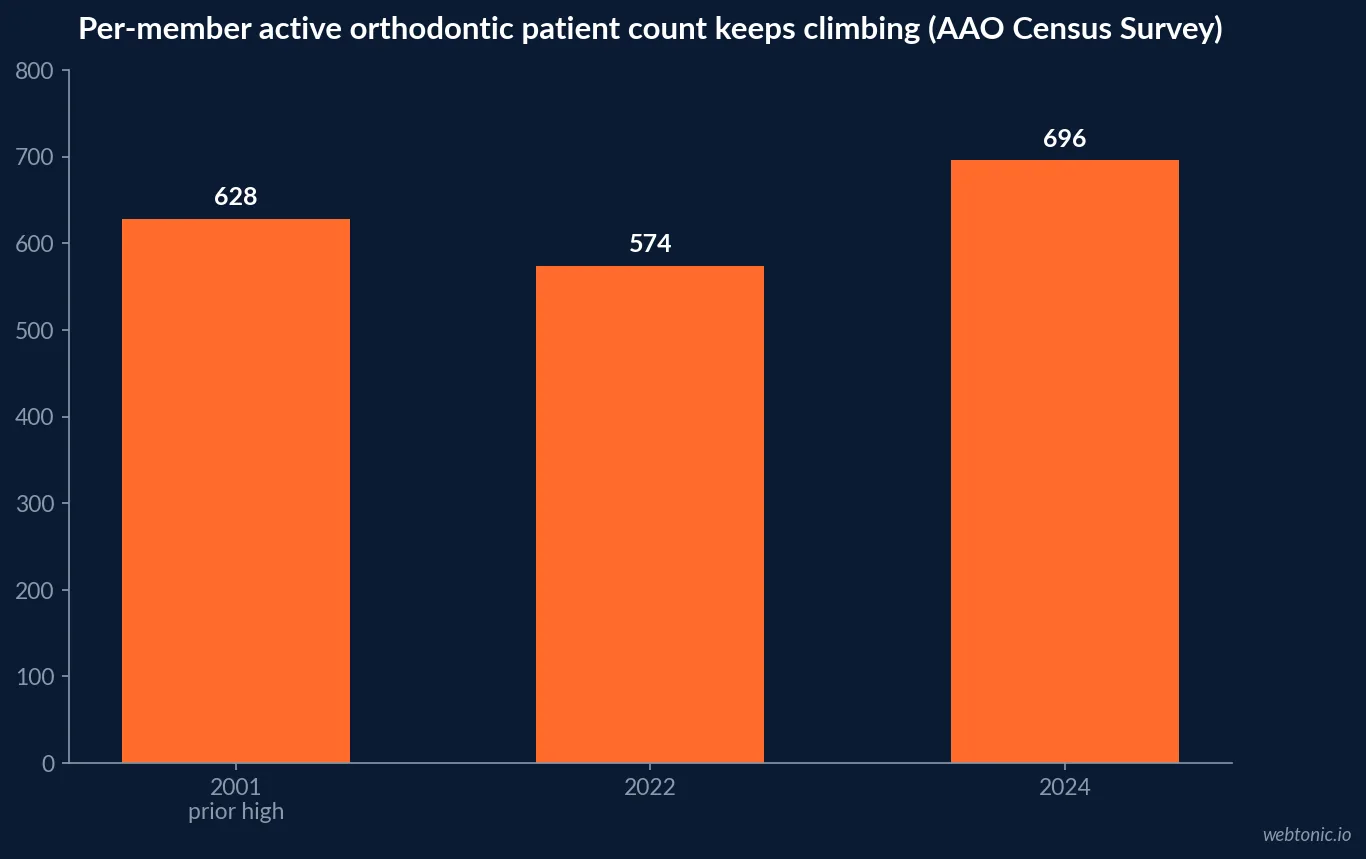
- 696 patients in active treatment per AAO member in 2024, up from 574 in 2022.
- That is the highest per-member count since the survey began in 1987, over 10% above the prior record of 628 set in 2001.
- An estimated 6.66 million patients were in active treatment across AAO members in the US and Canada in 2024.
- Adult patients reached approximately 1.91 million, up from 1.64 million in 2022.
- 24% of respondents cited the AAO's own Find an Orthodontist tool as a referral source in 2024, up from 20% in 2022 and 17% in 2018.
- That tool is estimated to have driven 44,000 exams and 28,000 treatment starts for member practices in one year.
- The 2025 survey drew 635 usable responses from a 9,554-member database, a 6.6% participation rate.
- Orthodontist-owned practices sit at 68% of respondents, down from 80% in 2018.
- Orthodontics posted the lowest healthcare search click-through rate of 16 specialties tracked, at 4.35%, down 28% year over year.
- Orthodontics also carried the highest average cost per click of those 16 specialties, at USD 8.76.
- Average cost per lead for orthodontics paid search sits at USD 71.52.
- Orthodontics paid-search conversion rate runs 14.21%, well above the healthcare average of 8.09%.
- Align Technology reported 691,785 Clear Aligner cases shipped in Q2 2026, up 7.4% year over year, with growth across adult, teen and growing patient segments.
- A cross-industry Physicians & Surgeons Facebook lead-ad benchmark reports a USD 47.47 cost per lead - lower than orthodontics' own search CPL, but not specialty-specific.
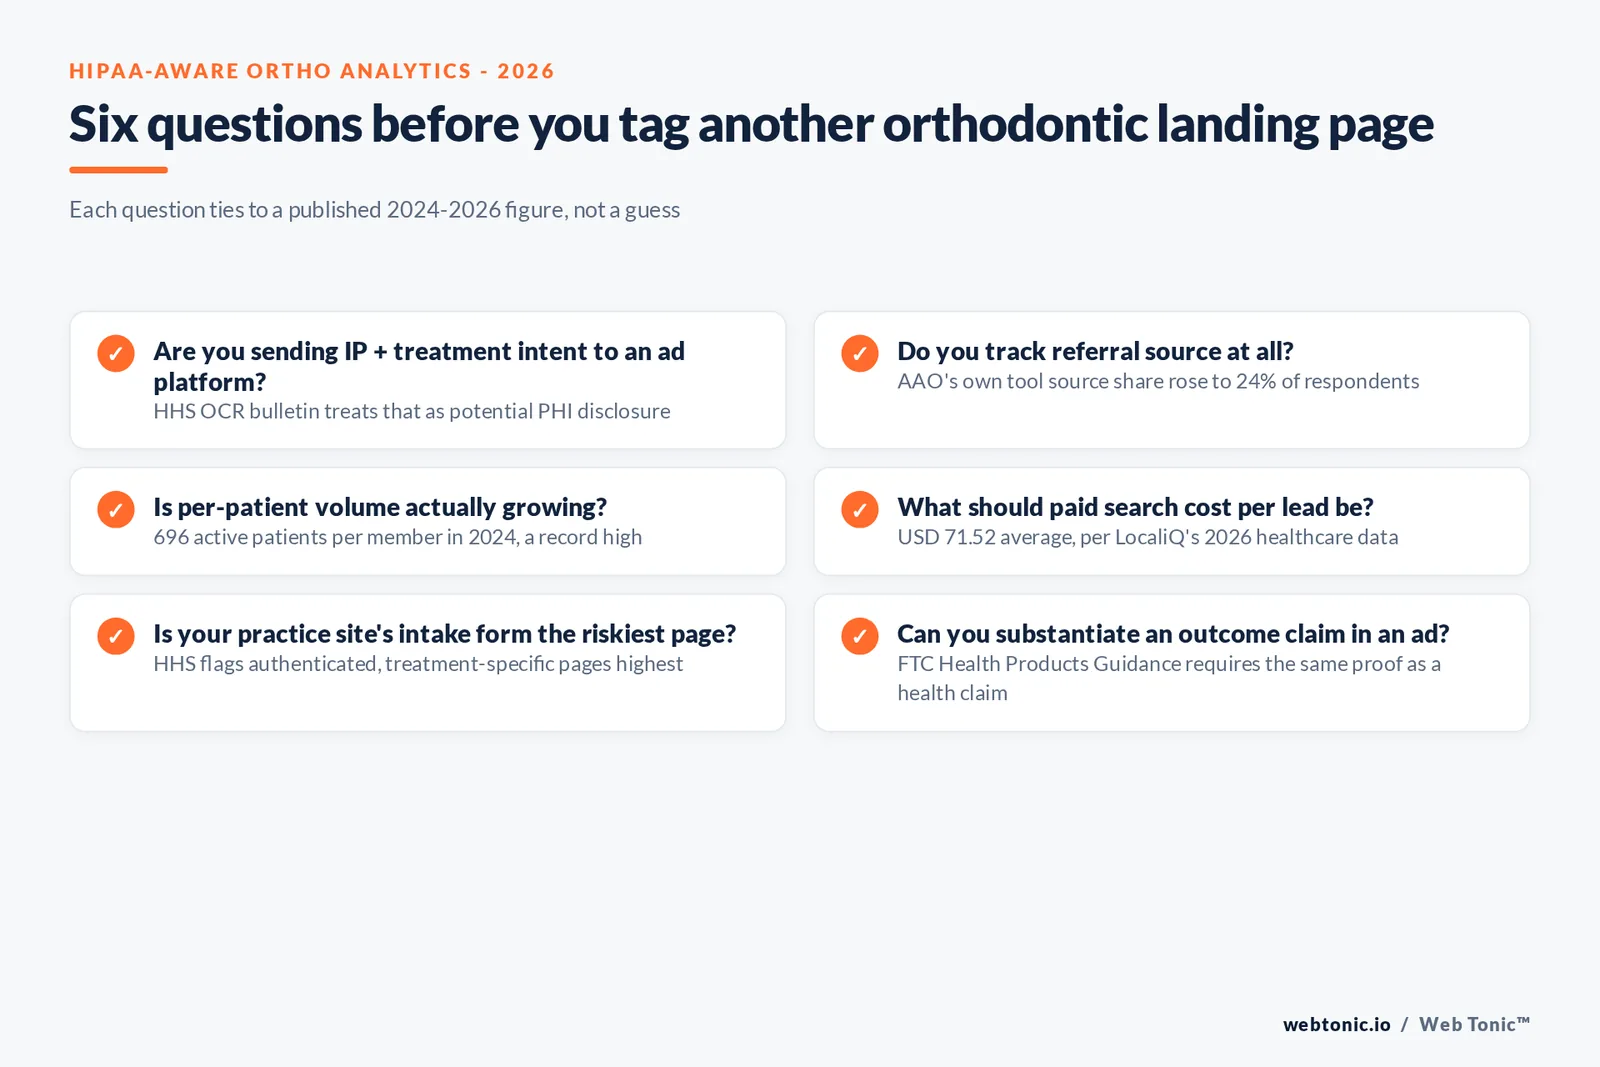
- The 2022 HHS bulletin on tracking technologies treats an IP address tied to a health-related page view as potential protected health information once shared with a vendor.
What the census survey actually measured
Before trusting any per-patient figure, it helps to know how it was collected. The 2025 AAO Economics of Orthodontics and Patient Census Survey is a biennial member survey that has run since 1987. The 2025 edition, covering 2024 practice data, drew 314 fully completed and 321 partial responses for a combined 635 usable surveys - 570 in the United States and 45 in Canada, a 6.6% participation rate against the AAO's 9,554-member active database. The AAO states that all differences reported are statistically significant at a 95% confidence level.
That is a self-reported member survey, not a claims database, and a mid-single-digit response rate is thin for firm-level precision. It is still the only orthodontics-specific practice census that exists, which is why every number below traces back to it or names the narrower dataset it came from.
| Practice metric (2024 data) | Figure | Prior comparison | Source |
|---|---|---|---|
| Active patients per member | 696 | 574 in 2022; 628 in 2001 (prior record) | AAO Census Survey |
| Estimated total active patients, US + Canada | 6.66 million | n/a | AAO Census Survey |
| Estimated adult active patients | 1.91 million | 1.64 million in 2022 | AAO Census Survey |
| Survey participation rate | 6.6% | 635 of 9,554 members | AAO Census Survey |
| Orthodontist-owned practices | 68% | 80% in 2018; 69% in 2022 | AAO Census Survey |
The one referral channel the AAO can actually attribute
Most practice marketing spend is attributed on faith. The AAO's own consumer-facing Find an Orthodontist tool is the exception, because the association can tie its own traffic to member-reported outcomes. 24% of respondents who reported a referral source in 2024 named that tool, up from 20% in 2022 and 17% in 2018 - a rising, trackable share against a backdrop where dentist referral, historically the top channel, has been declining (see the ad-creative companion analysis for that trend). Based on 2024 starts and the reported percentage located through the tool, the AAO estimates 44,000 patients were examined and 28,000 started treatment after finding their orthodontist that way.
The AAO's own Consumer Awareness Program reports that its FY26 paid and organic tactics drove over 17 million visits to the AAO consumer website - the traffic base that referral share is drawn from. A practice-level analytics stack should be built to isolate the same kind of number for its own referral pathways, not just accept "word of mouth" as an unmeasured catch-all.
| Referral-tool metric | 2024 | 2022 | 2018 |
|---|---|---|---|
| Share citing AAO's Find an Orthodontist tool | 24% | 20% | 17% |
| Estimated exams sourced from the tool | 44,000 | n/a published | n/a published |
| Estimated starts sourced from the tool | 28,000 | n/a published | n/a published |
| Orthodontist-owned practice share | 68% | 69% | 80% |
What a paid-channel dashboard should actually expect
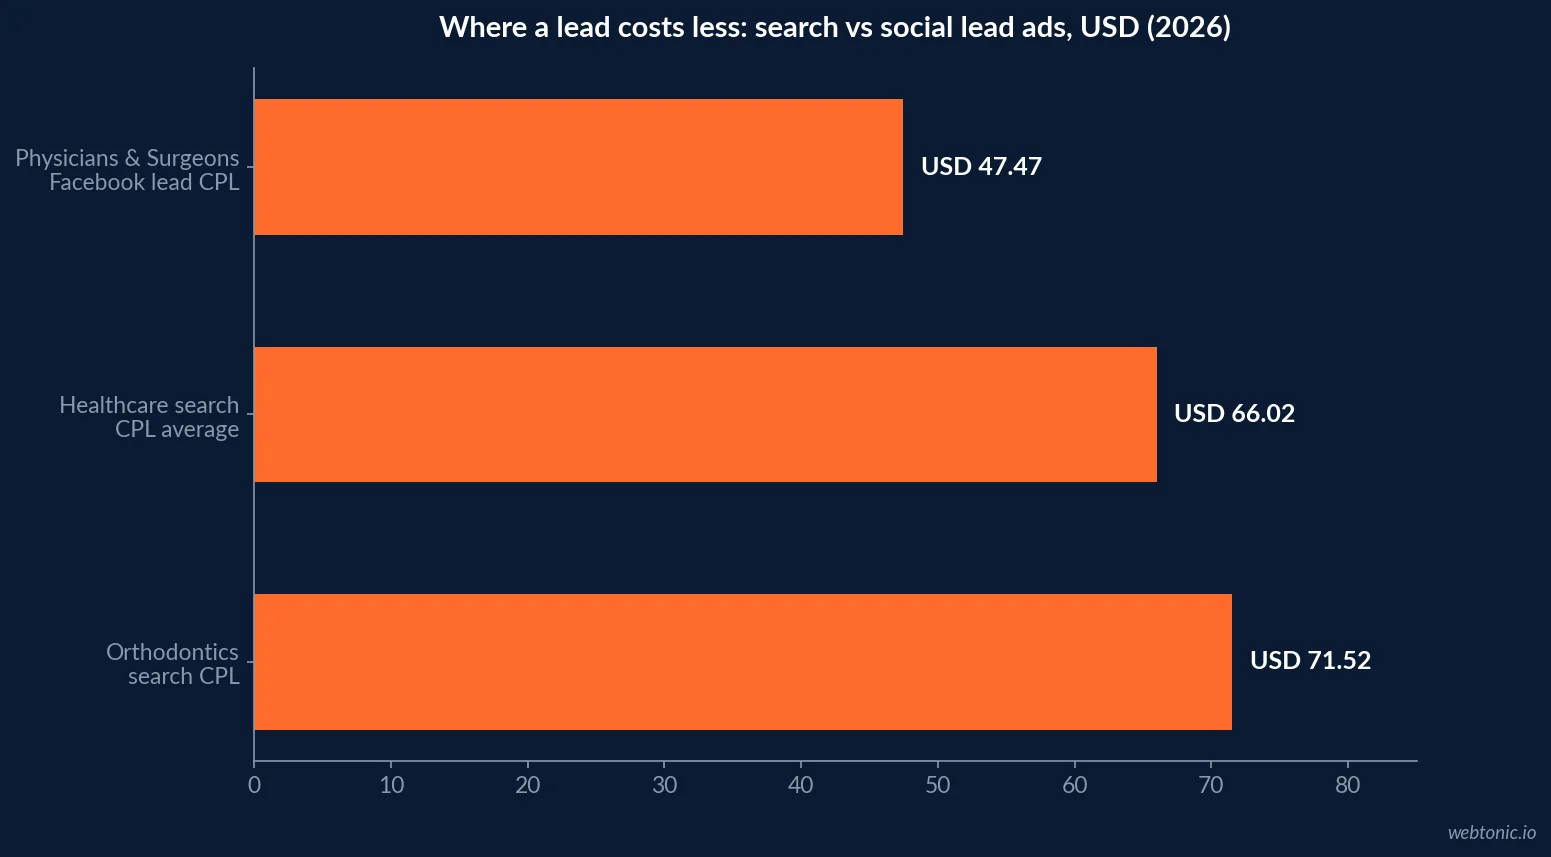
Once referral and organic sources are separated out, paid channels are where most practices build their first real dashboard. LocaliQ's 2026 healthcare search benchmarks, built from 3,542 US campaigns running October 2024 through September 2025 with at least 43 active campaigns per subcategory, put orthodontics at the extremes of the healthcare set: the lowest click-through rate of 16 specialties (4.35%, down 28% year over year) and the highest cost per click (USD 8.76), against a healthcare-wide average CTR of 6.07% and CPC of USD 5.64. Its cost per lead of USD 71.52 sits above the healthcare average of USD 66.02, but its conversion rate of 14.21% beats the healthcare average of 8.09% - a channel that is expensive to click on but converts well once clicked.
WordStream's 2025 Facebook Ads benchmarks, based on 726 lead-objective campaigns running April 2024 to June 2025, report a broader Physicians & Surgeons category - not orthodontics alone - at a 3.02% CTR, USD 2.23 CPC, 4.51% CVR and USD 47.47 CPL. A dashboard that blends these two sources without labeling which is orthodontics-specific and which is a category proxy will systematically understate paid search's true cost per lead.
| Channel / metric | CTR | CPC | CVR | CPL | Scope |
|---|---|---|---|---|---|
| Orthodontics, paid search (LocaliQ) | 4.35% | USD 8.76 | 14.21% | USD 71.52 | Orthodontics-specific |
| Healthcare average, paid search (LocaliQ) | 6.07% | USD 5.64 | 8.09% | USD 66.02 | 16-specialty blend |
| Physicians & Surgeons, Facebook leads (WordStream) | 3.02% | USD 2.23 | 4.51% | USD 47.47 | Cross-specialty proxy |
| Align Technology Clear Aligner cases, Q2 2026 | n/a | n/a | n/a | 691,785 shipped, +7.4% YoY | Company data, category signal |
What the HIPAA pixel guidance actually restricts
The compliance layer most orthodontic marketing stacks skip is the one that governs the tags doing the tracking. The HHS Office for Civil Rights bulletin on online tracking technologies (first issued December 2022, revised March 2024) states plainly that a HIPAA covered entity's use of tracking technologies is not permitted if it results in an impermissible disclosure of protected health information to a vendor - and that PHI can include identifiers such as an IP address or device ID when combined with the fact that a person visited a page revealing they sought or are considering treatment. The bulletin does not ban analytics outright; it requires a HIPAA-compliant authorization or a business-associate agreement before that data leaves the practice's control.
The FTC's Health Products Compliance Guidance works alongside that rule from the advertising-claims side: it does not regulate pixels, but it does require that any outcome claim a practice's marketing makes - conversion rates, patient satisfaction, results speed - be substantiated the same way a health product claim would be. Between the two, "the ad platform's default conversion tag" is rarely a defensible answer to "how do you track patient acquisition."
| Page type | Tracking risk level | Why | HHS/FTC basis |
|---|---|---|---|
| Marketing homepage, no health intake | Lower | Page view alone rarely reveals a specific condition or intent | HHS OCR bulletin |
| Service pages naming a treatment | Medium | Page content ties a visitor to interest in a specific procedure | HHS OCR bulletin |
| Appointment-request / intake forms | Higher | Combines identifiers with clear treatment-seeking behavior | HHS OCR bulletin |
| Patient portal / scheduling login | Highest | Authenticated PHI context; third-party pixels here are highest-risk | HHS OCR bulletin |
| Outcome or results claims in ads | Compliance, not tracking | Must be substantiated the way a health claim would be | FTC Health Products Guidance |
The channels HIPAA guidance doesn't touch: organic and reputation
The HHS bulletin governs vendor pixels; it says nothing about the two data sets every practice should already be watching without a compliance question attached - organic search position and review reputation. Advanced Web Ranking's Q4 2025 Google CTR study, tracking millions of SERPs monthly since 2015, puts average organic click-through at roughly 39.8% for position 1 and 18.7% for position 2 - a free, first-party analytics signal any practice can pull from Search Console without touching a third-party pixel at all. On the reputation side, BrightLocal's 2025 Local Consumer Review Survey found that consumer trust in online reviews "as much as a personal recommendation" has fallen to 42%, down from 79% in 2020 - a trend worth tracking in its own dashboard tile, since a declining trust baseline changes how much weight a star rating alone should carry in a practice's reporting.
| Non-PHI analytics signal | 2025-26 figure | Why it belongs in the dashboard | Source |
|---|---|---|---|
| Organic CTR, position 1 | ~39.8% | First-party Search Console data, no vendor pixel involved | Advanced Web Ranking |
| Organic CTR, position 2 | ~18.7% | Shows the cost of losing even one ranking spot | Advanced Web Ranking |
| Consumer trust in reviews vs. personal recommendation | 42% (was 79% in 2020) | Context for how much weight a star rating should carry | BrightLocal 2025 |
What Google Ads itself expects from a healthcare conversion setup
Google's own Healthcare and Medicines advertising policy requires certification for prescription drug services, pharmaceutical manufacturers and several other named categories - not for a general orthodontic practice - but every healthcare advertiser is still bound by Google's standard destination-quality and misleading-claims rules regardless of certification status. That matters for analytics because any conversion label reported back to Google Ads ("consultation booked," "case started") is itself a claim about what happened on the site. The FTC's Endorsement Guides (16 CFR Part 255) apply the same substantiation logic to any outcome claim surfaced in reporting or creative built from that data - if a dashboard reports a case-acceptance rate publicly, it needs to be as defensible as a patient testimonial would.
| Compliance layer | What it governs | Practical analytics implication |
|---|---|---|
| Google Ads Healthcare & Medicines policy | Certification for named drug/pharma categories | General ortho advertisers are exempt from certification but not from claims review |
| FTC Endorsement Guides, 16 CFR 255 | Substantiation of outcome and result claims | Any reported conversion or case-acceptance stat used publicly needs the same rigor |
| HHS OCR tracking-technology bulletin | PHI disclosure via pixels and vendor tags | Intake and portal pages need HIPAA-compliant tagging, not default platform pixels |
Building the dashboard practices actually need
Three data sets, three different denominators. The AAO census survey answers "is our category growing" at the market level. The Find an Orthodontist attribution numbers answer "does a single tracked referral channel move volume" at the association level. LocaliQ's and WordStream's benchmarks answer "what should our paid channels cost" at the campaign level - and neither of those was built for orthodontics specifically once you cross into paid social. A practice dashboard that keeps those three sources in separate columns, rather than blending them into one blended CPL, is the only version that survives a second look.
Our data and analytics practice builds that kind of dashboard against a practice's own CRM and ad-platform exports, checked against the published benchmarks above rather than assumptions. See our broader look at cost per lead by industry and conversion rate benchmarks for how orthodontics compares to other lead-driven categories, or talk to us about auditing your own tracking setup against the HHS guidance above.
Frequently Asked Questions
What share of new orthodontic patients can be traced to a single tracked channel?
The clearest published number is the AAO's own: 24% of members who reported a referral source in 2024 named the AAO's Find an Orthodontist consumer tool, up from 20% in 2022 and 17% in 2018. Applied to reported starts, the AAO estimates that tool alone produced about 44,000 exams and 28,000 treatment starts for member practices in a single year. That is one channel, tracked centrally by the association, not a practice-level dashboard - which is exactly the gap most practices still have.
Is per-patient volume actually growing or is this a social-media impression?
It is growing, and the survey behind it is large enough to trust: the 2025 AAO Economics of Orthodontics and Patient Census Survey drew 635 usable responses (570 US, 45 Canada) from a 9,554-member database, a 6.6% participation rate, with results reported at 95% confidence. On that base, active per-member patient counts rose from 574 in 2022 to 696 in 2024 - the highest figure recorded since the survey began in 1987, more than 10% above the previous record of 628 set in 2001.
Can I put a Meta or Google ad pixel on my orthodontic practice website?
You can, but the 2022 HHS Office for Civil Rights bulletin on online tracking technologies (updated March 2024) says that if a tracking pixel discloses protected health information - which includes an IP address or device ID tied to a page that reveals someone is seeking or considering orthodontic treatment - to a third party like a platform's ad network without a HIPAA-compliant authorization, that is an impermissible disclosure of PHI, not a marketing convenience. Appointment-request and patient-portal pages are the highest-risk placements; a logged-out marketing homepage carries less exposure, but the bulletin does not draw that line for you - your practice's HIPAA counsel does.
What does a realistic paid-search cost per lead look like for orthodontics right now?
LocaliQ's 2026 healthcare benchmarks, built from over 3,500 US campaigns running October 2024 to September 2025, put orthodontics at an average cost per click of $8.76 (the highest of 16 healthcare subcategories), a 4.35% click-through rate (the lowest of the 16), a 14.21% conversion rate and a $71.52 cost per lead. Orthodontics and dermatology also posted the two largest year-over-year CTR declines in that report, both down 28%, which LocaliQ attributes partly to elective-treatment categories being more exposed to economic uncertainty.
Should a practice apply cross-industry paid-social benchmarks to its own numbers?
Only as a directional check, and only after labeling the source. WordStream's 2025 Facebook Ads benchmarks report a Physicians & Surgeons lead-objective CTR of 3.02%, a cost per click of $2.23, a 4.51% conversion rate and a $47.47 cost per lead - but that category spans every physician and surgical specialty running Facebook lead ads, not orthodontics specifically. No published 2026 study isolates orthodontics-only Meta lead performance, so treat that figure as a ceiling for what a broad medical-adjacent category can do, not a target for a single-specialty practice.
Sources
American Association of Orthodontists - 2025 Economics of Orthodontics Survey
American Association of Orthodontists - Consumer Awareness Program
HHS Office for Civil Rights - Use of Online Tracking Technologies bulletin
Federal Trade Commission - Health Products Compliance Guidance
Electronic Code of Federal Regulations - FTC Endorsement Guides, 16 CFR Part 255
Google Ads Advertising Policies Help - Healthcare and Medicines
LocaliQ - Healthcare Search Ads Benchmarks
WordStream - Facebook Ads Benchmarks 2025
Advanced Web Ranking - Google CTR Study, Q4 2025
BrightLocal - Local Consumer Review Survey 2025
Align Technology - Q2 2026 Earnings Call Transcript (The Motley Fool)