Table of contents
Only 44% of marketing organisations have an automated ROI dashboard, 23% trust channel-level ROI, and service businesses still burn 8–12 hours a month rebuilding spreadsheets. In mold removal the deeper problem is what the dashboard omits: margin.
Key Takeaways
- 44% of organisations have automated marketing ROI dashboards; only 23% can measure channel-level ROI with high confidence.
- 57% of marketing leaders report rising pressure to prove ROI to the executive team.
- Enterprise dashboard adoption reached about 67%, up from 52%, and roughly 55% of marketing teams rely on real-time dashboards.
- Around 72% of dashboard setups now schedule report delivery automatically.
- Service businesses lose 8–12 hours a month pulling data from 4–6 separate systems.
- Self-service BI saves roughly 3.2 hours per analyst per week and 64% of users report faster decisions.
- 79% of agencies now save five or more hours weekly with AI, with reporting and performance summaries the top use case at 42%.
- Only 13% of marketers fully trust AI insights; 33% validate with human review and 35% lean on human judgment.
- In a planted-error test of AI analytics summaries, just 5% of participants caught all three real errors.
- Restoration gross margin benchmarks at 50–65% blended, with 70%+ in the top quartile.
- EBITDA margin runs 10–20%, and 25%+ in the top quartile.
- Revenue per technician benchmarks at $200K–$300K, rising above $350K in the top quartile.
- Days sales outstanding runs 45–60 days; under 45 is top-quartile performance.
- Customer acquisition cost benchmarks at $500–$1,000 per job, under $500 top quartile.
- Mold remediation averages an $18,000 ticket at 40–50% gross margin against water mitigation at $12,500 and 70–80%.
- Reconstruction runs 8–12% gross margin on a $45,000 average ticket — the mix trap on every revenue-only dashboard.
- 19% of restoration firms report gross margins under 20%, up from 12% a year earlier, while 22% clear 50%+.
- Cost per truck roll runs $350–$500, making dispatch efficiency a marketing metric.
- Contractors reporting no AI implementation fell from 50% to about 30% in a year, with 24% partially integrated.
- 74% of residential contractors see AI as key to efficiency, yet only 12% have embedded it in operations.
The Reporting Layer Nobody Builds
Mold removal firms are not short of numbers. Estimating software holds job values, the phone system holds call volumes, the ad platforms hold spend, and accounting holds receivables. What is missing is a single surface where those four agree. Service businesses are reported to spend 8–12 hours a month pulling data from four to six systems and rebuilding the same spreadsheet — a task whose output is stale the day it is finished.
The wider benchmark data shows the gap is not unique to the trades, just wider there. About 44% of organisations have automated marketing ROI dashboards, only 23% can measure ROI at individual channel level with high confidence, and 57% of marketing leaders face increasing pressure to prove return. Meanwhile enterprise dashboard adoption has climbed to roughly 67% from 52%, with 72% of setups scheduling delivery automatically. The tooling has arrived; the discipline has not.
| Reporting maturity | What it looks like | Typical firm size | Weekly cost |
|---|---|---|---|
| Manual | Monthly spreadsheet, hand-typed | 1–3 trucks | 2–3 hours |
| Semi-automated | Platform exports pasted into one sheet | 3–8 trucks | 1–2 hours |
| Connected | Live dashboard from CRM + calls + ads | 8–20 trucks | Under 30 minutes |
| Margin-aware | Connected plus job-level gross margin | $5M+ revenue | Under 30 minutes |
| Predictive | Connected plus seasonality and pacing models | Multi-market platforms | Continuous |
Margin Is The Missing Column
Here is the specific failure mode in restoration dashboards. Revenue and job count are easy to display, so they get displayed; margin is stored somewhere else, so it does not. The problem is that service-line mix, not volume, drives restoration profitability. Two months with identical revenue can differ by tens of thousands in gross profit depending on how much reconstruction sat inside them.
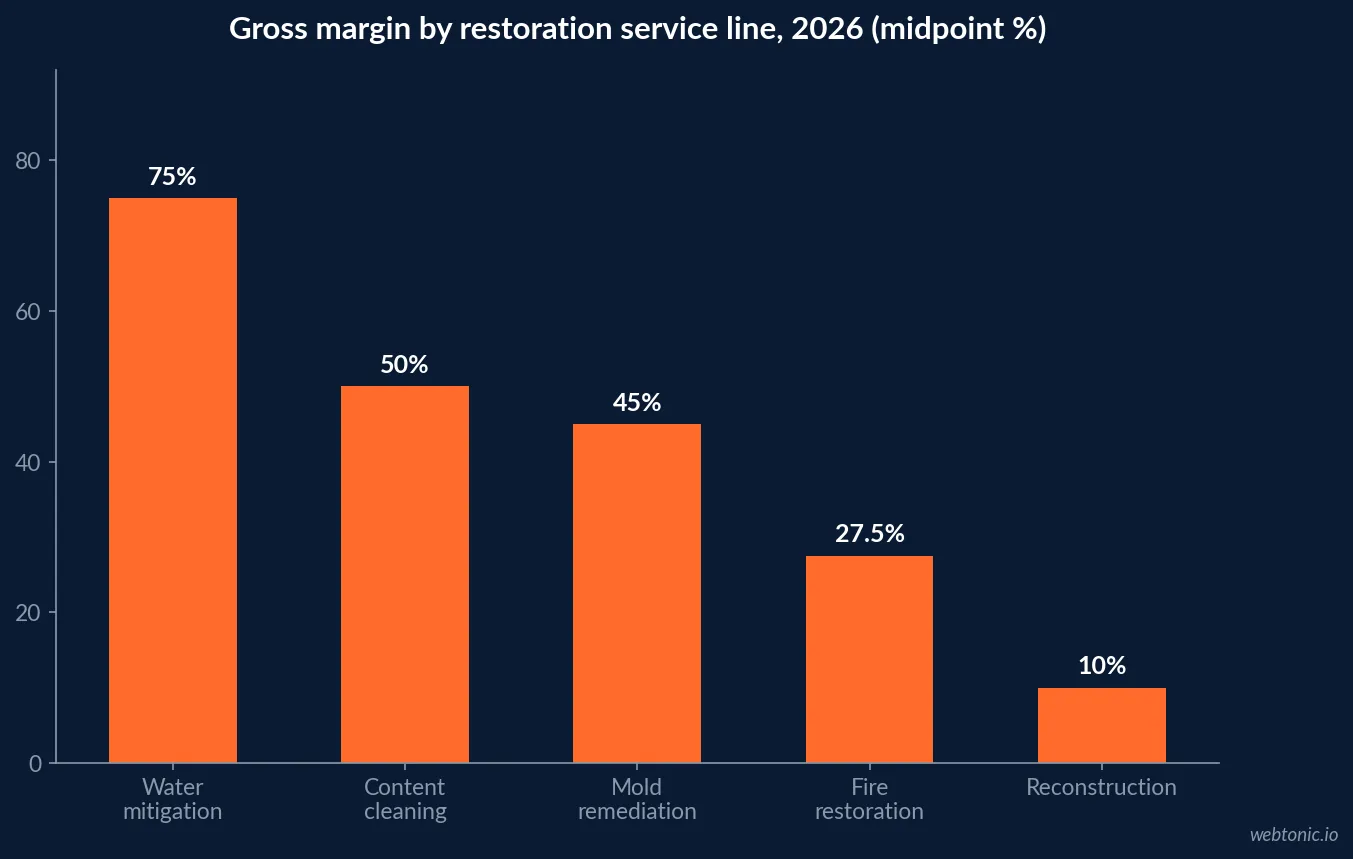
Mold remediation sits in the middle: heavier labour content than water mitigation, real protective costs for containment and disposal, more documentation, and more carrier disputes. That is why it benchmarks around 40–50% gross margin while water mitigation clears 70–80%. It also carries a larger ticket, which is exactly what makes a revenue-only dashboard misleading.
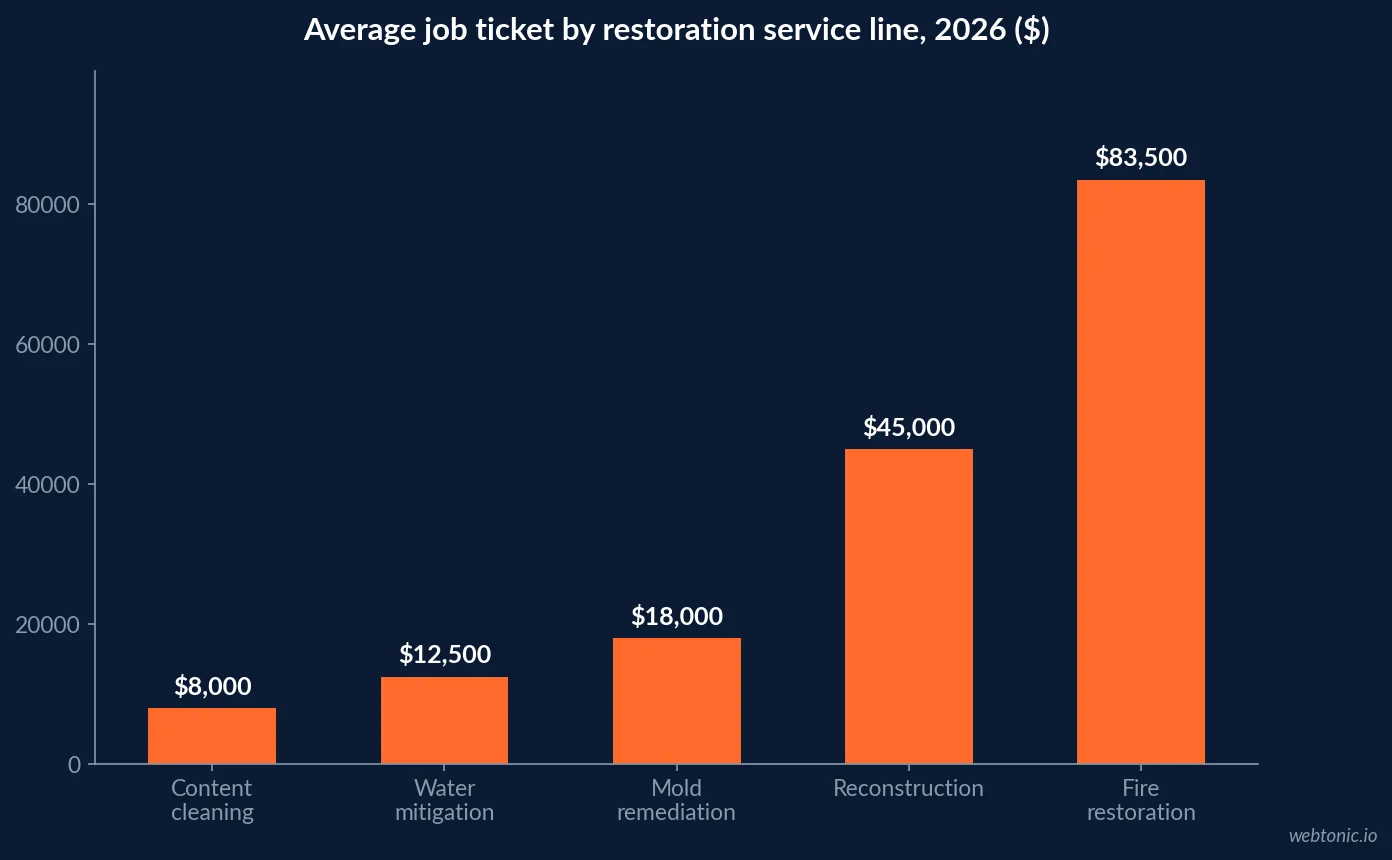
| Service line | Average ticket | Gross margin | Gross profit per job |
|---|---|---|---|
| Water mitigation | $12,500 | 70–80% | ~$9,400 |
| Mold remediation | $18,000 | 40–50% | ~$8,100 |
| Fire restoration | $83,500 | 25–30% | ~$23,000 |
| Reconstruction | $45,000 | 8–12% | ~$4,500 |
| Content cleaning | $8,000 | ~50% | ~$4,000 |
Read the last column and the strategic point lands: a mold job and a water job produce almost identical gross profit despite a 44% difference in ticket size, and a reconstruction job worth two and a half mold jobs produces roughly half the gross profit. Any dashboard that ranks channels by revenue booked will steer marketing spend toward the wrong service line. Since 19% of restoration firms now report gross margins under 20%, up from 12%, that mis-steer is no longer academic.
The Nine Metrics Worth A Screen
Dashboard sprawl is the second failure mode. Marketing metrics and operational metrics get mashed onto one screen until nobody reads it. The nine below cover the decisions a mold removal owner actually makes, with the benchmark each should be graded against.
| Metric | Benchmark | Top quartile | Decision it drives |
|---|---|---|---|
| Gross margin (blended) | 50–65% | 70%+ | Service-line mix and pricing |
| EBITDA margin | 10–20% | 25%+ | Overhead and crew loading |
| Revenue per technician | $200K–$300K | $350K+ | Hiring versus utilisation |
| Days sales outstanding | 45–60 days | Under 45 days | Payer mix and collections effort |
| Customer acquisition cost | $500–$1,000 | Under $500 | Channel budget allocation |
| Cost per truck roll | $350–$500 | Under $350 | Dispatch and estimate qualification |
| Lead-to-booked-job rate | 10–15% purchased leads | Referral work far higher | Sales process and channel choice |
| Cycle time (loss to invoice) | Track by job type | Compressed and consistent | Cash conversion |
| Annual turnover | ~25% industry | Under 10% | Capacity and quality risk |
Two notes on grading. First, these are acquisition-grade benchmarks — the same numbers a buyer would use to price the business, which makes them the right ones for an owner to watch. Second, turnover deserves a marketing seat: with the industry near 25% annual turnover and the 2026 survey showing 52% of firms under 10%, crew stability is what allows a brand promise about process quality to survive contact with a job site. Our mold removal branding statistics cover that promise side.
Where AI Fits, And Where It Lies
The fastest-moving number in restoration reporting is AI adoption. Contractors reporting no AI implementation fell from 50% to about 30% in a single year, with just over 37% in early exploration and 24% partially integrated; 28% now describe the cost as manageable while only 9% still call it a significant barrier. The wider trades survey puts it more bluntly: 74% of residential contractors see AI as key to efficiency, but only 12% have embedded it in operations.
Reporting is where the gap closes first. 79% of agencies now save five or more hours a week with AI, with reporting and performance summaries the single largest use case at 42%, agentic workflow automation at 38%, and 58% reporting they have increased human oversight to protect quality. That last figure is the important one, because trust in the output has not kept pace.
Only 13% of marketers fully trust AI insights without human checks — 33% validate with human review and 35% still rely mainly on human judgment. And the verification instinct is weaker than the stated caution: in a study where three real errors were planted in AI analytics summaries, just 5% of participants caught all three. For a mold firm, that means AI is safe for drafting the narrative and flagging anomalies, and unsafe as the last step before a spend decision.
| Reporting task | Safe to automate | Human check required |
|---|---|---|
| Weekly channel spend and lead counts | Yes | Spot-check monthly |
| Anomaly flags on pacing or CPL | Yes | Confirm before acting |
| Narrative summary of the month | Yes | Verify every figure quoted |
| Gross margin by job | Partly | Reconcile against accounting |
| Budget reallocation recommendation | No | Owner decision on job-level data |
A Reporting Cadence That Fits A Restoration Week
Frequency should match the decision, not the tool. Emergency work generates daily noise; margin and mix only become legible over weeks. Self-service BI is credited with roughly 3.2 hours saved per analyst per week and 64% of users reporting faster decisions — the gain comes from removing assembly time, not from looking more often.
| Cadence | Audience | What is reviewed | Time budget |
|---|---|---|---|
| Daily | Dispatch and CSR lead | Calls answered, response time, jobs booked | 5 minutes |
| Weekly | Owner and marketing | Cost per job by channel, pacing, pipeline | 20 minutes |
| Monthly | Owner and finance | Gross margin by service line, DSO, AR aging | 60 minutes |
| Quarterly | Leadership | Mix shift, CAC trend, revenue per technician | Half day |
| Annual | Leadership | Benchmark position against top-quartile KPIs | Planning cycle |
The daily view exists for one reason: response time. Average web-lead response in the trades runs well beyond the five-minute threshold where conversion rates are several times higher, and that is a dashboard-fixable behaviour rather than a budget problem. Everything else can wait for the weekly.
Building The Scoreboard: Ten Steps
- Pick nine metrics and delete the rest — dashboard sprawl is why nobody reads the screen.
- Add a service-line dimension to every revenue figure, so mold, water and reconstruction never blend.
- Put gross margin on the first screen; 19% of firms are now under 20%.
- Join call data to booked jobs before adding any visualisation layer.
- Automate delivery — 72% of dashboard setups already schedule it; reclaim the 8–12 hours a month.
- Grade against top-quartile benchmarks: 70%+ gross margin, 25%+ EBITDA, $350K+ per technician.
- Split DSO by payer so carrier lag never looks like a sales problem.
- Use AI for the narrative, not the numbers — only 5% of readers catch planted errors.
- Match cadence to decision: daily response time, weekly cost per job, monthly margin.
- Review the dashboard itself quarterly and remove any metric that has not changed a decision.
A restoration dashboard earns its keep when it answers one question in under a minute: which service line, in which market, from which channel, made money last month. If you want that built on your own systems rather than bought as a template, our data intelligence team does exactly this work — or just get in touch. The channel context lives in our mold removal digital marketing statistics.
Frequently Asked Questions
What KPIs belong on a mold removal company dashboard?
Nine metrics cover almost every decision: cost per acquired job by channel, lead-to-booked-job rate by source, average job value by service line, gross margin by service line, cycle time from first notice of loss to final invoice, days sales outstanding by payer, revenue per technician, equipment utilisation, and response time by lead source. Benchmarks to grade them against: gross margin 50–65% blended (70%+ top quartile), EBITDA 10–20% (25%+ top quartile), revenue per technician $200K–$300K ($350K+ top quartile), DSO 45–60 days (under 45 top quartile) and CAC $500–$1,000 (under $500 top quartile).
How many restoration companies actually run a real dashboard?
Fewer than the software marketing suggests. Across marketing organisations generally, about 44% have automated marketing ROI dashboards and only 23% say they can measure ROI at individual channel level with high confidence. Enterprise dashboard adoption reached roughly 67% in the most recent multi-year read, up from 52%, and around 55% of marketing teams rely on real-time dashboards. In the trades the base rate is lower still — most reporting is a monthly spreadsheet assembled by hand.
How much time does manual reporting cost a mold removal business?
Service businesses are reported to spend 8–12 hours a month pulling data from four to six systems and rebuilding spreadsheets, and self-service BI is credited with saving roughly 3.2 hours per analyst per week. On the agency side of the same problem, 79% now save five or more hours a week using AI, with reporting and performance summaries the single largest use case at 42%. For an owner, ten hours a month is roughly a week of selling time a quarter.
Should a mold remediation firm trust AI-generated dashboard summaries?
Verify them. Only about 13% of marketers fully trust AI insights without human checks, 33% validate them with human review and 35% still lean mainly on human judgment. In a controlled test where deliberate errors were planted in an AI analytics summary, only 5% of participants caught all three. Use AI summaries to draft the narrative and flag anomalies, then check every number that will drive a budget decision against the source system.
What is the single most common mistake in restoration dashboards?
Reporting revenue without margin. Job mix decides profitability in this trade: water mitigation runs roughly 70–80% gross margin on a $12,500 average ticket, mold remediation 40–50% on around $18,000, and reconstruction as low as 8–12% on $45,000. A month that looks strong on revenue can be weaker on gross profit than the month before it. Since 19% of restoration firms now report gross margins under 20% — up from 12% a year earlier — margin has to sit on the first screen, not in a quarterly review.
Sources
The Deal Sheet — Restoration Industry KPIs and Unit Economics 2026
Cleanfax — The 2026 Restoration Benchmarking Survey Report
Digital Applied — Marketing Analytics Statistics 2026
Gitnux — Dashboard Statistics 2026
AnovaGrowth — Automated Reporting for Service Businesses
TechnologyChecker — AI in Marketing Statistics 2026
Databox — Using AI You Don’t Trust (2026 research)
AgencyAnalytics — 2026 Marketing Agency Benchmarks Report
WifiTalents — Business Intelligence Statistics 2026
Tygart Media — Restoration Gross Margin by Service Line Mix
ServiceTitan — 2026 Residential State of the Trades Report