



Table of contents
Multi-touch attribution adoption reached 47% in 2026 while 38% of pipeline stays invisible to any click-based model — and in aesthetics the pixel itself is restricted by health-privacy rules. The result: a sector with a $68 median blended acquisition cost and $2,339 median lifetime value where a meaningful minority of practices cannot compute their own CAC.
Key Takeaways
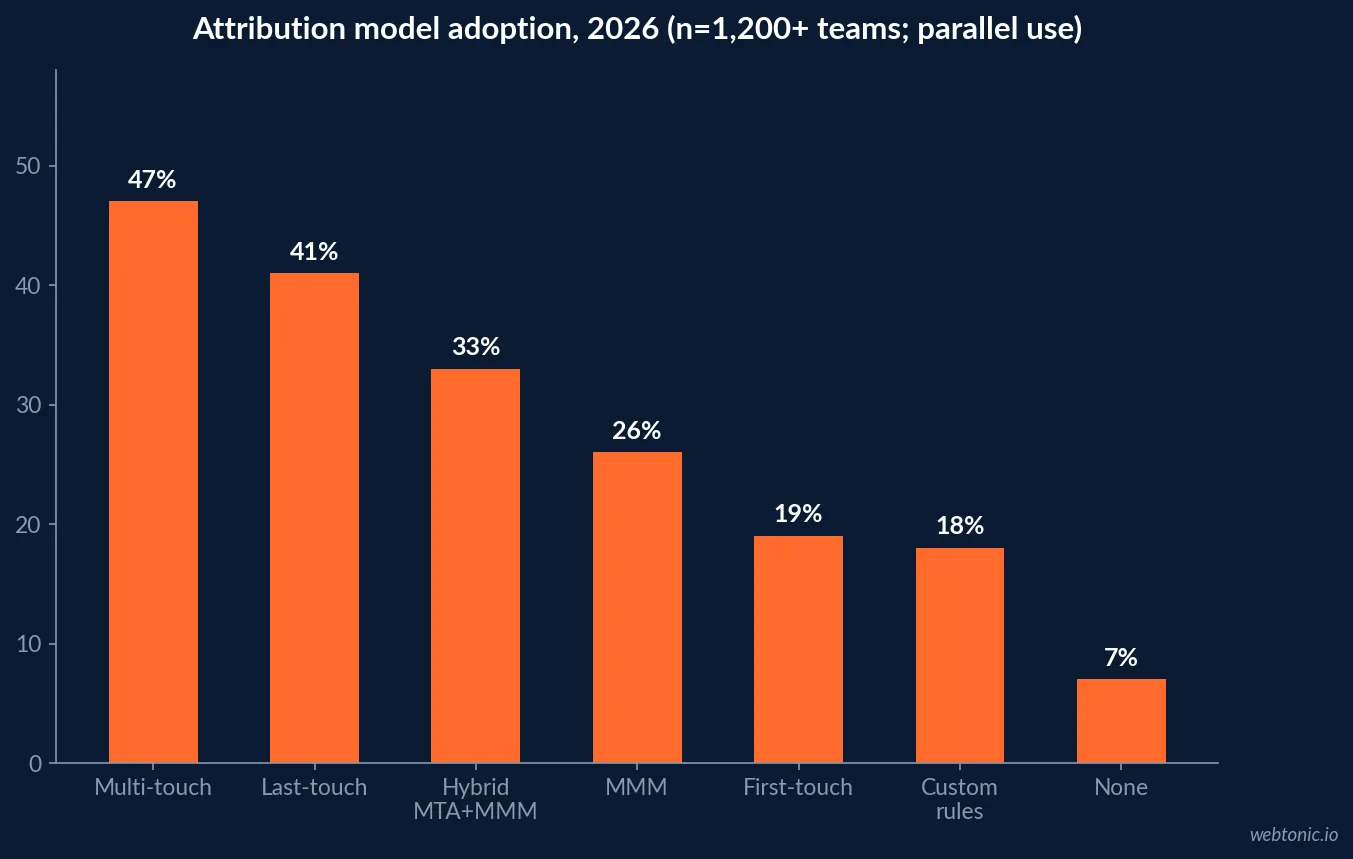
- Attribution model adoption across 1,200+ teams: multi-touch 47%, last-touch 41%, hybrid MTA+MMM 33%, MMM 26%, first-touch 19%, custom 18%, none 7%.
- MMM adoption tripled from 9% (2023) to 26%, with 43% of adopters citing signal loss as the trigger.
- The dark-funnel gap averages 38% of pipeline — word-of-mouth 17%, dark social 12%, podcasts 6%, communities 5%.
- AI attribution lifts holdout fidelity: Markov +22 pts, deep learning +18, position-decay +11, hybrid MMM+MTA +27.
- Attribution-capable teams spend 23% more on martech but report 1.6x larger marketing-sourced pipeline.
- Aesthetics unit economics: median blended CAC $68, median LTV $2,339, LTV:CAC 34, CAC spanning $4 to $717.
- A minority of the aesthetics cohort cannot compute CAC at all — no connected spend source.
- Revenue concentration: the median brand earns 39.7% of revenue from its top 10% of clients (up to 66%).
- Discount leakage: 13.2% of gross revenue at the median, interquartile range 6.9%–21.2%.
- Retention medians: 45.8% of new cohorts return within 3 months, 69.0% rebook within 90 days, 43.9% are single-visit, 2.3 completed visits per active client.
- Typical lead-to-booking conversion is near 20% with response times of 8–24 hours; the fastest cohort converts at roughly double.
- Response inside 5 minutes is associated with a 78% higher consult booking rate; most practices reply in 24–48 hours, by which point ~60% have booked elsewhere.
- Operations: cancellation rate 14% (down from 16%), no-shows 4%, and 37% of patients who book a second appointment cancel it.
- Median revenue per location is $1.86M with a median ticket of $216 and only 13% online booking share (32% at the 90th percentile).
- Missed calls run 20–40 per month per location, at $150–$350 of revenue at risk each; answered calls book at 30–50%.
- Platform totals double-count: summing each platform’s reported conversions typically exceeds actual sales.
- 44–48% of agencies report the same four attribution problems — this is an industry-wide measurement gap, not a local one.
The Attribution Operating Model Changed
A 2026 survey of 1,200+ marketing teams shows the single-model era is over: multi-touch attribution at 47%, last-touch at 41%, hybrid MTA+MMM at 33% and marketing mix modelling at 26% — percentages that sum past 100 because most teams now run two models in parallel. MMM tripled from 9% in 2023, with 43% of adopters citing signal loss and 38% citing the arrival of open-source MMM tooling that collapsed entry costs.
Only 7% report no formal attribution at all — running purely on platform-native metrics. For aesthetics, that 7% is almost certainly understated, because the sector skews toward owner-operated practices with a booking system, a phone and two ad accounts that disagree.
| Attribution approach | 2026 adoption | What it answers well |
|---|---|---|
| Multi-touch (linear, time-decay, position-based) | 47% | Which campaign influenced this patient |
| Last-touch (CRM / ad platform default) | 41% | Nothing reliable above the last click |
| Hybrid MTA + MMM | 33% | Tactical and strategic together |
| Marketing mix modelling | 26% (from 9% in 2023) | Marginal return per channel, brand effects |
| First-touch | 19% | Source of record for a new patient |
| Custom rules-based | 18% | Practice-specific stage weighting |
| No formal attribution | 7% | Platform dashboards only |
The 38% You Will Never Tag — And Aesthetics Is Worse
The dark-funnel gap — pipeline arriving with no attributable touchpoint — averages 38%, decomposing into word-of-mouth and referrals 17%, dark social 12%, podcasts 6%, communities and forums 5% and private group chatter 4%. Aesthetics is structurally at the high end of that distribution: recommendations travel through friend groups, private messages and screenshots of results, none of which carry a UTM.
The mature response is not to chase the gap to zero. It is to size measurement capacity against the addressable share and let aggregate modelling carry the rest. A 150-brand study makes the corollary explicit: because each platform claims credit under its own view-through and click windows, summing platform-reported conversions routinely exceeds actual sales. A practice reading Meta plus Google plus the booking system as three additive truths will over-report bookings and under-price its real CAC.
HIPAA Broke the Pixel: What Med Spas Can Still Track
Health-privacy enforcement changed the measurement stack, not just the consent banner. Advertising pixels installed on clinical pages can transmit protected health information — a visitor moving from a specific treatment page to a contact form creates exactly that risk. HIPAA-safe analytics guidance for 2026 is clear about what remains measurable: generic conversion events (“Contact Us”, “Request Info”) without form contents, aggregate-level call tracking (total and qualified calls) through vendors configured to avoid PHI exposure, and appointment intent as a counted event.
The compliant architecture moves the join server-side: pull spend and campaign metadata from ad platforms, call and lead data from approved systems, and appointment outcomes from the scheduling system or CRM, joining on hashed or system-safe identifiers only where compliance approves. The reporting layer, not the pixel, becomes the source of truth — which is exactly what a data intelligence layer is for, and why our med spa analytics benchmarks sit alongside this data.
| Signal | Compliant to track? | How it should be handled |
|---|---|---|
| Generic conversion events | Yes | Event counts without form contents |
| Treatment-specific page conversions | Restricted | Avoid sending condition-level detail to ad platforms |
| Call volume and source | Yes, in aggregate | Campaign-level DNI; no clinical recording into martech |
| Appointment booked / shown / treated | Yes, via approved systems | CRM or scheduling system, joined server-side |
| Revenue per patient | Yes | Practice management system, aggregated for reporting |
| Platform pixel on clinical pages | High risk | Server-side routing through a BAA-covered layer |
The Aesthetics Numbers Attribution Has to Reconcile
CorralData’s H1 2026 benchmark of 100+ aesthetic brands across 54 dimensions is the closest thing the sector has to an attribution ground truth, because it reads connected spend and revenue systems rather than survey recall. Median blended CAC is $68 against a median lifetime value of $2,339 — an LTV:CAC of 34 — with the distribution running from $4 to $717: injectable chains with referral flywheels acquire below $35 while consult-led surgical or body-contouring brands pay $400–$700 and earn it back on ticket size.
The most telling finding is the absence: a minority of the cohort cannot compute CAC at all because no spend source is connected. Two more numbers define the risk that attribution should surface. The median brand earns 39.7% of revenue from its top 10% of clients — up to 66% at the extreme — and the median practice gives up 13.2% of gross revenue to discounts (interquartile range 6.9% to 21.2%). Concentrated revenue plus deep discounting is the most fragile profile in the dataset.
| Attribution-relevant metric | P25 | Median | P75 |
|---|---|---|---|
| New-cohort return within 3 months | 36% | 45.8% | 62% |
| Repeat rate within 90 days | 45.5% | 54.1% | 59.2% |
| Rebooking within 90 days of a visit | 58.1% | 69.0% | 73.3% |
| Prior-year clients returning | 37.7% | 46.4% | 53.5% |
| Single-visit share of clients | 38.9% | 43.9% | 51.4% |
| Completed visits per active client | 2.0 | 2.3 | 2.8 |
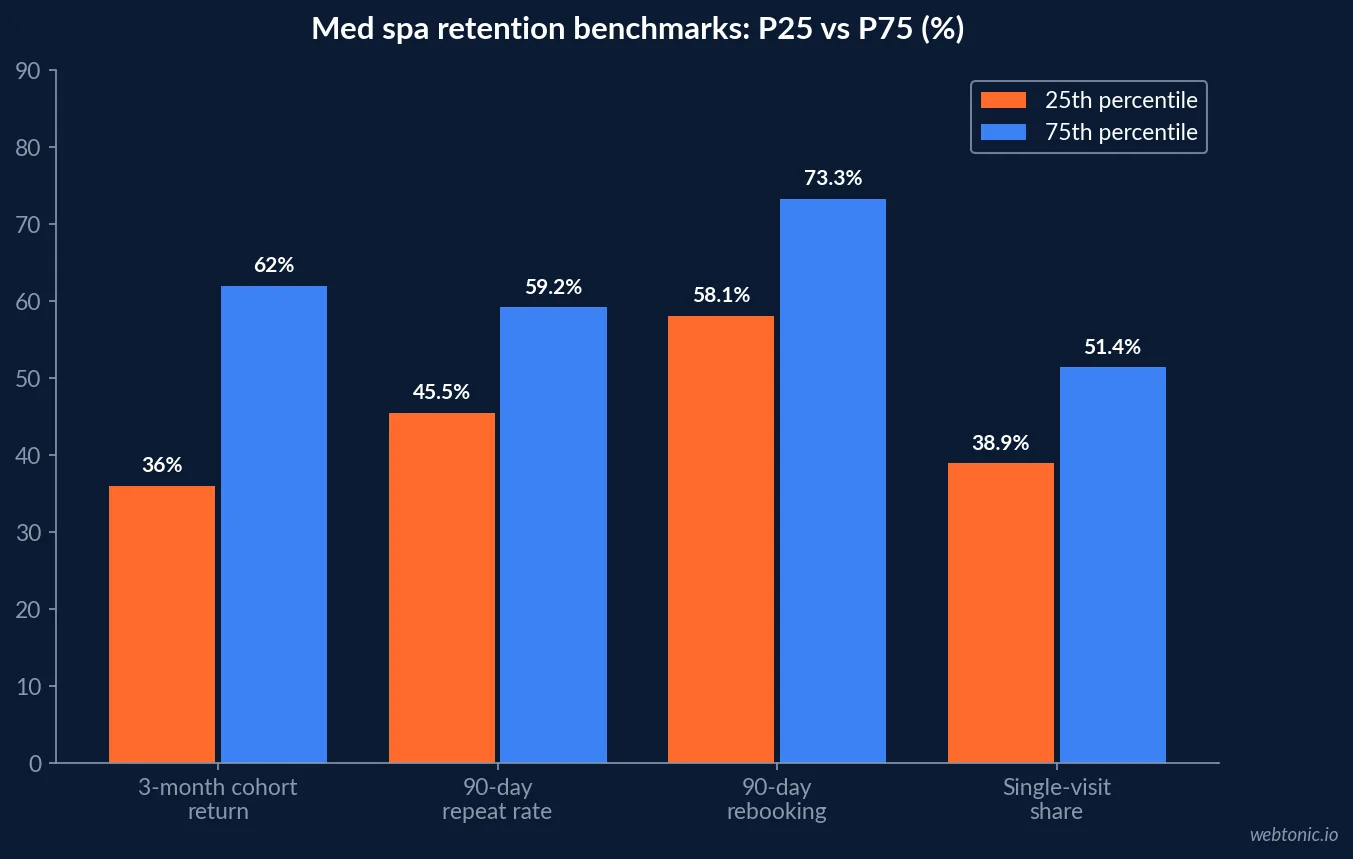
Those retention percentiles are why last-click attribution misprices aesthetics so badly. A channel judged on first visit alone is being measured on roughly 2.3 visits of realised value at the median — and the spread between a 36% and a 62% three-month cohort return is most of the difference between the cohort’s growth leaders and its laggards. Definitions matter too: ask five operators to define “rebooking rate” and you will get five formulas, which is the quiet reason cross-practice benchmarking so often fails.
Speed-to-Lead: The Variable That Contaminates Every Model
Attribution assumes the funnel behaves consistently between click and booking. In aesthetics it does not. The benchmark cohort reports typical lead-to-booking conversion near 20% with response times of 8–24 hours, while the fastest brands convert at roughly double that rate. Lead-response research puts a 78% higher consult booking rate when the reply lands inside five minutes, and notes most practices respond in 24–48 hours — by which point roughly 60% of enquiries have already booked elsewhere.
Add the phone. Single-location practices miss 20–40 calls a month, each carrying $150–$350 of revenue at risk, and answered calls convert to bookings at 30–50%. If those variables are not captured as fields, channel-level CAC differences are mostly measuring which leads happened to arrive during staffed hours. Cost-per-lead benchmarks by treatment show the compounding effect clearly: a lead-to-booked rate of 28% versus 45% turns a $96 cost per booked consultation into $33, and a $205 cost per acquired patient into $46.
Operational Leaks Attribution Should Expose
Zenoti’s 2026 benchmarks put the medspa cancellation rate at 14% — down from 16% — with no-shows at 4%, but the headline hides the real problem: 37% of patients who book a second appointment cancel before it happens. Once a patient completes that second visit, the retention curve changes shape entirely.
The same benchmark set puts median revenue per location at $1.86M ($4.25M at the 90th percentile), median average ticket at $216 ($484 at the 90th), median online booking share at just 13% (32% at the 90th) and median staff utilisation at 38% (80% at the 90th). An attribution model that stops at the lead is silent on all four — and all four move revenue more than a channel reallocation does.
Building a Med Spa Attribution Stack That Holds Up
- Run two models, not one. A first-touch source field for channel decisions plus blended CAC-versus-revenue for budget decisions — mirroring the 33% already running hybrid stacks.
- Never sum platform conversions. Platform totals double-count; reconcile to booked appointments in one system of record.
- Move the join server-side. Spend and campaign metadata from platforms, leads and calls from approved systems, outcomes from scheduling — joined on compliance-approved identifiers.
- Instrument speed-to-lead as a metric, not a habit. The gap between a 5-minute and a 24-hour reply is larger than the gap between most channels.
- Track to treated revenue, not to lead. With 2.3 median visits per active client and 43.9% single-visit share, per-lead economics understate good channels and flatter bad ones.
- Report discount rate beside CAC. A 13.2% median discount leak dwarfs most media savings.
- Build one dashboard, not five tabs — see our med spa digital marketing benchmarks and local SEO data for the surrounding channel context.
Med Spa Attribution vs Other Industries
Aesthetics is not behind on attribution because operators are unsophisticated. It is behind because the sector combines three hard conditions at once: restricted tracking on clinical intent, a referral-heavy dark funnel, and revenue realised across multiple later visits. Agency benchmark data shows 44–48% of agencies naming the same four attribution problems, so the gap is industry-wide — aesthetics just has the sharpest version of it.
| Condition | Med spa / aesthetics | Typical B2B or eCommerce |
|---|---|---|
| Pixel-level tracking of intent | Restricted by health-privacy rules | Generally permitted |
| Dark-funnel share | High — referral and private-message driven | 38% average; 28% enterprise |
| Revenue realisation | Across ~2.3 visits per active client | Usually a single transaction or contract |
| Offline conversion weight | Heavy — 20–40 missed calls per month per location | Lower for digital-first models |
| Model maturity | Many practices still last-touch or no formal model | 47% multi-touch, 26% MMM |
| Biggest measurable leak | 13.2% discount rate; 37% second-visit cancellation | Channel mis-allocation |
Frequently Asked Questions
What attribution model should a med spa use in 2026?
Two, in parallel. Across 1,200+ surveyed B2B teams, multi-touch sits at 47% adoption and last-touch at 41%, with 33% now running an explicit hybrid of multi-touch and marketing mix modelling — MTA for tactical channel decisions, MMM for budget allocation. For a single-location med spa the practical version is simpler: a first-touch source stamped on every patient record for channel decisions, plus a blended CAC-versus-revenue view for budget decisions. Attribution-capable teams spend 23% more on martech but report 1.6x larger marketing-sourced pipeline.
Why can't a med spa just use the Meta and Google dashboards?
Three reasons. First, platforms double-count: adding up each platform's reported conversions typically exceeds actual total bookings. Second, health-related pixel data can transmit protected health information, which is why platforms restrict tracking on clinical pages and LinkedIn blocks its Insight Tag on healthcare domains. Third, roughly 38% of pipeline arrives through untracked word-of-mouth and dark-social routes — in aesthetics, referrals and private group recommendations are a top acquisition source. Ad platforms measure clicks; the practice needs booked, shown and treated.
What are the med spa attribution benchmarks worth measuring?
The 2026 aesthetics cohort data gives clear anchors: median blended CAC $68, median patient lifetime value $2,339, LTV:CAC of 34, CAC spanning $4 to $717, 39.7% of revenue from the top 10% of clients, and 13.2% of gross revenue lost to discounts. Operationally: lead-to-booking near 20%, typical response time 8–24 hours, cancellation rate 14% with 4% no-shows, median online booking share 13%, and 2.3 completed visits per active client.
How do you attribute phone calls and walk-ins?
With dynamic number insertion tied to campaign, plus a disposition field. Single-location practices miss 20–40 calls a month, each carrying $150–$350 of revenue at risk, and answered calls convert to bookings at 30–50%. Aggregate-level call tracking — total calls, qualified calls, source — is generally compatible with HIPAA-safe analytics as long as clinical conversation content is not recorded into marketing systems. The campaign-to-call join is what makes offline conversion import to the ad platforms possible.
Does faster lead response really change attribution outcomes?
It changes the outcome being attributed. Typical aesthetics response time is 8–24 hours and typical lead-to-booking conversion is around 20%; the fastest cohort converts at roughly double that rate. Response inside five minutes is associated with a 78% higher consult booking rate, and most practices reply in 24–48 hours — by which point around 60% of enquiries have booked elsewhere. If speed-to-lead is not instrumented, channel attribution measures your front desk, not your media.
Sources
Digital Applied — Marketing Attribution Statistics 2026 (140 data points, n=1,200+)
CorralData — H1 2026 Aesthetics Industry Benchmark (100+ brands, 54 dimensions)
Grow With BA — The Attribution Crisis: 150-Brand Study 2026
Oyova — HIPAA-Safe Analytics in 2026: What Healthcare Can Track
Improvado — Healthcare GA4 HIPAA Conversion Tracking
Zenoti — Medspa Cancellation Rate: 2026 Benchmarks
Zenoti — 2026 Beauty & Wellness Benchmark Report: Medspa Edition
US Tech Automations — Automating Medspa Consult Conversion 2026
ScaleHaven — Average Med Spa Cost Per Lead by Treatment 2026
AgencyAnalytics — Marketing Attribution Benchmarks 2026


