



Table of contents

Key Takeaways
- The US med spa industry reached $21.4 billion in 2026, growing at a 14.2% CAGR since 2020, making analytics critical for tracking ROI on escalating marketing investments (ScaleHaven).
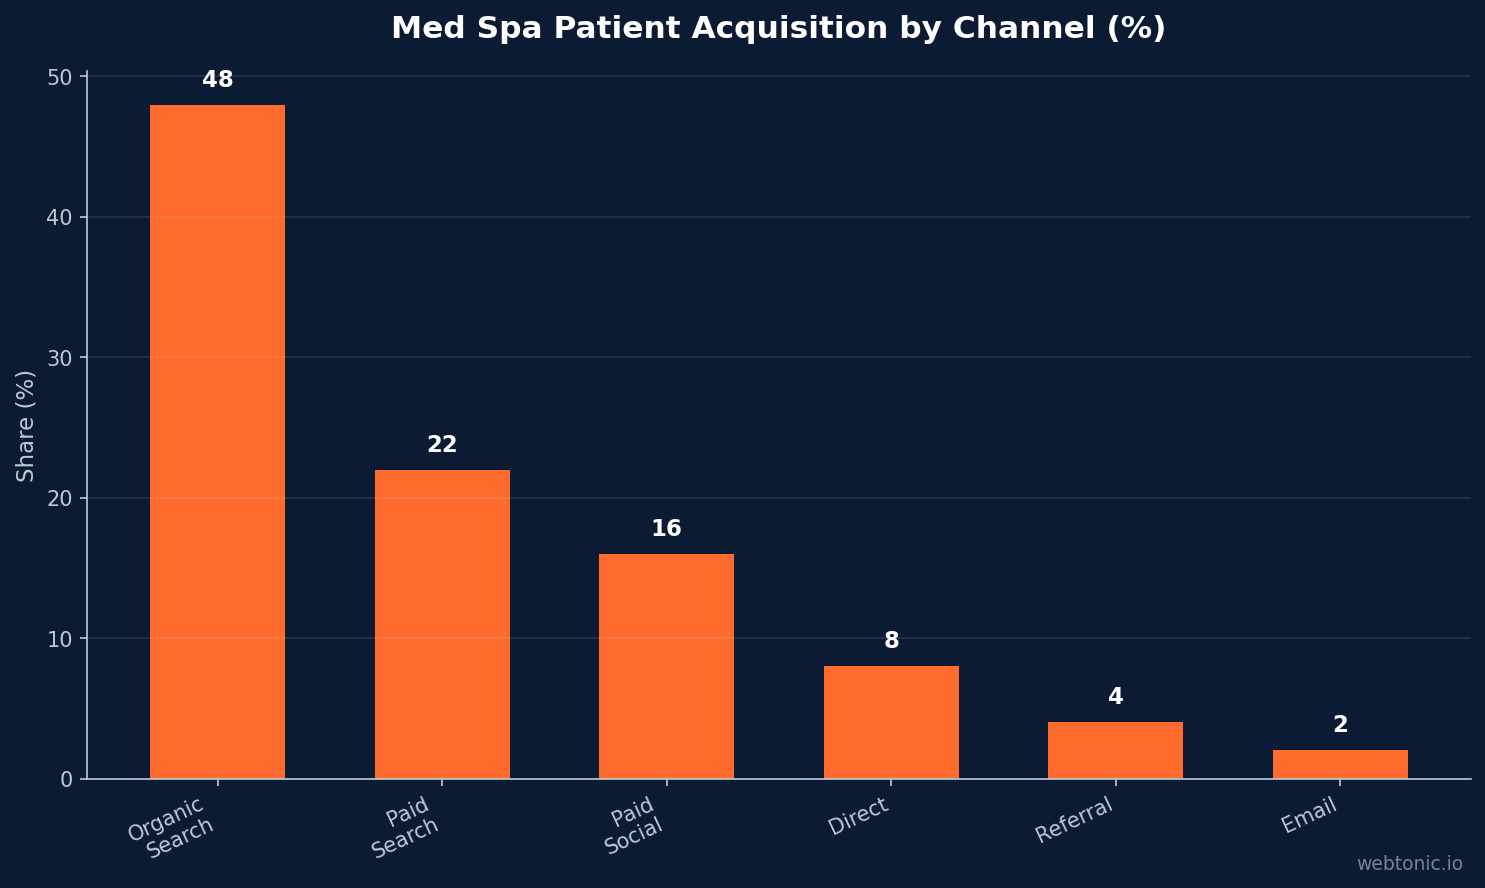
- Organic search drives 48% of new med spa consultations, yet only 38% of practices at the median track provider utilization rates, leaving significant revenue potential unmeasured (Zenoti).
- Top-performing med spas generate $4.25 million per location compared to $1.86 million at the median, a gap that data-driven KPI tracking helps bridge (Zenoti Benchmark).
- Average patient lifetime value ranges from $1,800 to $5,200, and practices using membership analytics see 35-45% higher LTV (ScaleHaven).
- Med spas using AI-powered analytics tools achieved 5% sales growth versus 1% for non-users, a 4-percentage-point advantage that represents the largest AI gap in beauty and wellness (Zenoti).
| Metric | Median | 75th Percentile | 90th Percentile |
|---|---|---|---|
| Revenue per Location | $1,860,000 | $2,340,000 | $4,250,000 |
| Avg Ticket Size | $216 | $346 | $484 |
| Online Booking Rate | 13% | 18% | 32% |
| Staff Utilization | 38% | 56% | 80% |
| Patient LTV (12-Mo) | $1,800 | $3,500 | $5,200 |
Med Spa Market Size and the Analytics Imperative
The US med spa market is valued at $21.4 billion in 2026, with the broader global aesthetic medicine market reaching $124.7 billion (ScaleHaven). At a 14.2% compound annual growth rate since 2020, the industry is expanding faster than most healthcare verticals. That velocity puts enormous pressure on practice owners to make informed decisions about where every marketing dollar goes.
There are now over 9,500 med spas operating in the United States, a 64% increase since 2018 (ScaleHaven). With competition accelerating, the clinics that outperform are those that measure acquisition, retention, and revenue at a granular level rather than relying on gut instinct. This is where analytics and data intelligence separate top-quartile practices from the median.
Revenue and Performance Benchmarks
According to the 2026 Zenoti Beauty and Wellness Benchmark Report, med spa revenue varies dramatically by performance tier. Top-performing practices at the 90th percentile generate $4.25 million per location, while the median sits at $1.86 million — a 2.3x gap that data-driven operations help close (Zenoti).
Average ticket size follows a similar pattern: $484 at the 90th percentile versus $216 at the median. Total revenue growth across the sector is 8%, driven primarily by new locations rather than same-store gains (2% same-location growth). Injectables still dominate the revenue mix, accounting for 45-55% of total revenue at the average practice (ScaleHaven). Body contouring treatments generate $1,800 to $4,500 per treatment cycle, making them high-value procedures that deserve dedicated conversion tracking.
Patient Acquisition Analytics
Organic search accounts for the largest share of new med spa consultations, generating approximately 48% of new patient inquiries in established markets. Paid search contributes 22%, followed by paid social at 16% (Authority Specialist). These ratios shift significantly based on practice maturity: newer clinics lean more heavily on paid channels, while established practices with strong local SEO see organic share climb above 55%.
Acquisition cost varies widely by channel. Med spa cost per lead ranges from $18 to $42 on Meta Ads and $45 to $60 via Google Ads, with fully loaded patient acquisition cost reaching $162 to $648 after accounting for intake drop-off, no-shows, and onboarding (Foundry CRO). Tracking these metrics channel-by-channel is non-negotiable — practices that measure cost per booked appointment rather than cost per lead allocate budgets 30-40% more efficiently (Queen City Growth Lab).
| Channel | Avg CPL | Avg CVR | Fully Loaded CAC |
|---|---|---|---|
| Organic SEO | $40-$90 | 14.6% | $155-$350 |
| Google Ads | $45-$60 | 5.9% | $200-$500 |
| Meta Ads | $18-$42 | 1.6% | $180-$450 |
| Email Marketing | $8-$15 | 2.4% | $80-$200 |
| Referral | $0-$25 | 22% | $50-$150 |
Retention and Lifetime Value Metrics
Patient retention analytics reveal one of the largest profit levers in the med spa business model. The average med spa patient visits 3.2 times per year, with a lifetime value of $1,800 to $5,200 over 12 months (ScaleHaven). Practices that implement membership programs and actively track rebooking rates see 35-45% higher patient LTV.
The Zenoti benchmark data reveals a critical rebooking insight: among patients rebooked once, 37% of those appointments were cancelled. However, patients rebooked two or more times cancel at just 4% (Zenoti). This means practices tracking rebooking depth can predict churn with remarkable accuracy. Ward Advisory benchmarks the target rebooking rate at 59-60%, with top performers exceeding 70% (Ward Advisory).
Membership sales grew 13% year over year across the Zenoti medspa network, signaling that recurring-revenue models are gaining traction as practices seek more predictable cash flow and higher retention (Zenoti).
Operational KPIs for Med Spas
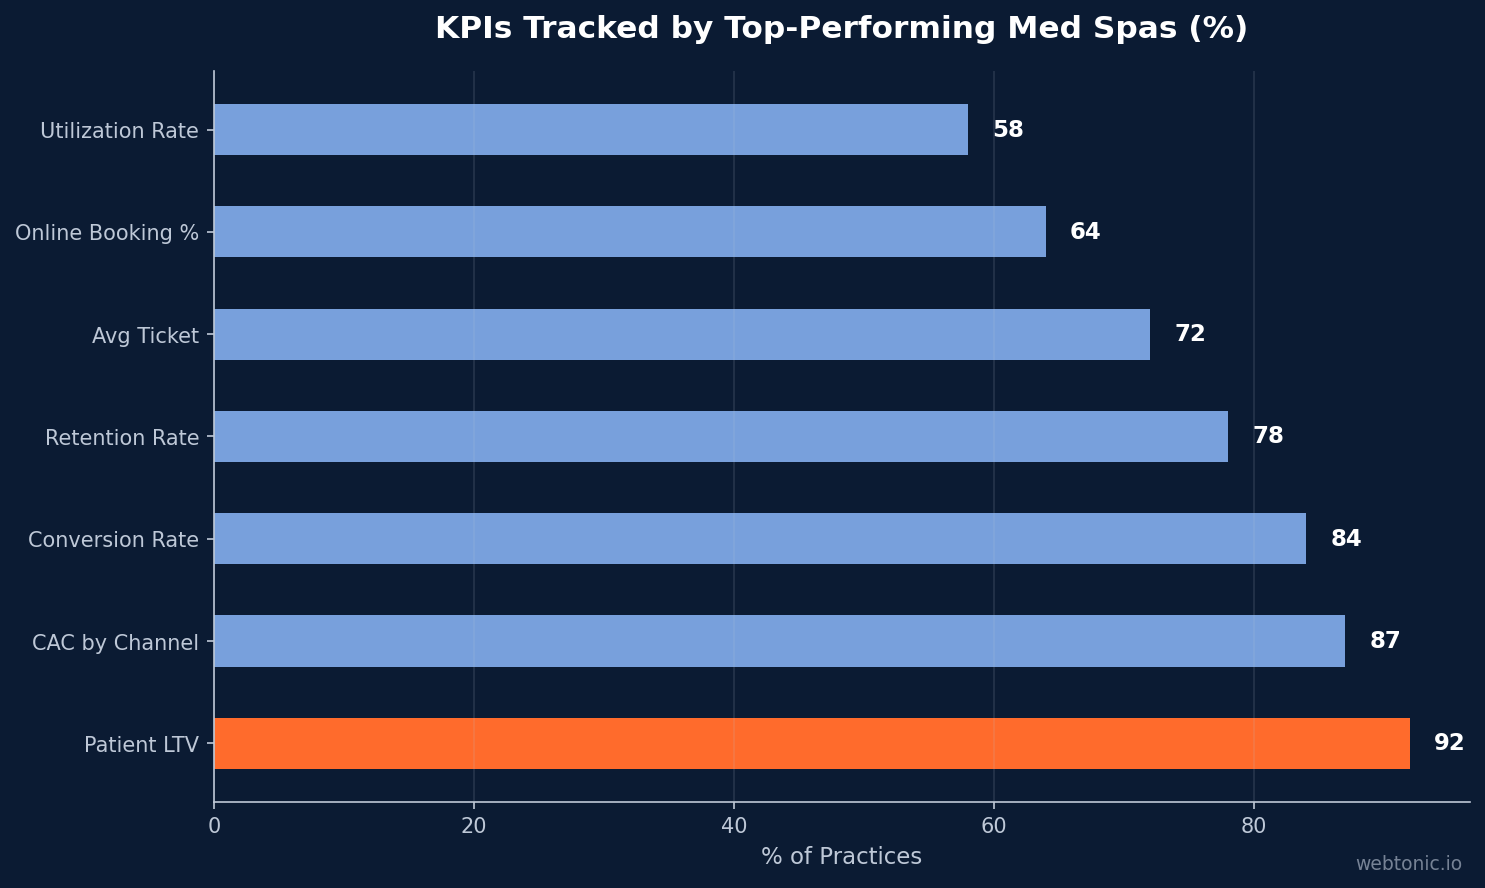
The operational metrics gap between average and top-performing med spas is substantial. Staff utilization stands at 80% for 90th-percentile practices versus 38% at the median — a 42-point gap, the widest of any beauty and wellness vertical (Zenoti). Documentation and charting consume significant provider time, and AI charting tools help reclaim that capacity for patient care and billable activity.
Key operational benchmarks include a target average revenue per visit of $672.50, a provider utilization rate of 70-85%, and a labor cost benchmark of 50% of revenue (Digital Med Spa). Practices hitting these targets while maintaining a 35% EBITDA margin represent the gold standard of operational efficiency.
| KPI Category | Metric | Benchmark |
|---|---|---|
| Revenue | Revenue per Provider Hour | $350-$600 |
| Revenue | Avg Revenue per Visit | $672.50 |
| Retention | Rebooking Rate | 59-70%+ |
| Acquisition | LTV:CAC Ratio | 3:1 to 5:1 |
| Operations | Provider Utilization | 70-85% |
| Operations | Labor as % Revenue | 50% or less |
| Marketing | Marketing Spend as % Revenue | 8-14% |
Technology and AI in Med Spa Analytics
AI adoption is accelerating across the aesthetics industry, and the analytics advantage is measurable. Med spas using AI-powered concierge tools achieved 5% sales growth versus 1% for non-users — a 4-percentage-point advantage that represents the largest AI-driven performance gap in beauty and wellness (Zenoti).
GA4 has become the standard analytics platform for med spa tracking, with enhanced measurement automatically capturing scroll depth, outbound clicks, site searches, video engagement, and file downloads (Prospelle). Beyond basic traffic analytics, the most effective med spa dashboards integrate practice management software data to connect marketing touchpoints directly to booked and completed procedures. This full-funnel attribution is what separates vanity metrics from actionable data intelligence.
AI-driven referral traffic is also emerging as a measurable signal: visits from AI platforms convert at up to 16.8% compared to 0.15% for organic search, though AI referrals still represent only 1.08% of total web traffic (Growth-Onomics).
Marketing ROI Measurement
Most med spas measure marketing success incorrectly. A 5:1 ROAS looks impressive until you factor in service delivery costs, retention rates, and lifetime value (CFO Pro Analytics). The CFO-grade approach uses a five-level model: direct revenue ROI, contribution margin ROI, patient lifetime value ROI, channel attribution ROI, and blended portfolio ROI.
Key marketing cost benchmarks for med spas include 8-14% of revenue allocated to marketing, with the average med spa spending $10,000 to $50,000 per month on advertising (ScaleHaven). Practices that respond to leads within 5 minutes are 21 times more likely to convert than those responding after 30 minutes, making speed-to-lead a critical metric to track alongside traditional cost-per-acquisition data (ScaleHaven).
Patient Behavior and Digital Engagement Data
72% of aesthetic patients research treatments online before booking, and 68% say before-and-after photos are the most influential content in their decision-making process (ScaleHaven). From an analytics perspective, this means practices must track gallery page engagement, before-and-after photo views, and the conversion path from visual content to consultation request.
Women represent 85-88% of med spa patients, with the 35-54 age group accounting for 42% of visits. However, the 25-34 segment is growing fastest at 28% since 2022 (ScaleHaven). Tracking demographic shifts in your analytics helps align paid social targeting with your actual patient mix rather than assumptions. Online booking remains low at 13% median for med spas — the lowest of any beauty and wellness vertical — largely because the consultation-driven nature of the business favors phone and in-person conversions (Zenoti).
| Digital Behavior Metric | Statistic | Source |
|---|---|---|
| Research Before Booking | 72% research online | ScaleHaven / RealSelf |
| B&A Photo Influence | 68% say most influential | ScaleHaven |
| Avg Visits per Year | 3.2 per patient | AmSpa |
| New Guest Visits (YoY) | Declined 11% | Zenoti |
| Membership Sales (YoY) | Grew 13% | Zenoti |
| 5-Min Lead Response | 21x more likely to convert | ScaleHaven |
Building a Med Spa Analytics Dashboard
The most effective med spa analytics dashboards consolidate data from four core systems: website analytics (GA4), advertising platforms (Google Ads and Meta Ads), practice management software, and CRM data. This unified view enables practice owners to see the complete patient journey from first click to completed treatment and follow-up appointment.
Ward Advisory recommends organizing your dashboard around seven diagnostic categories: production, retention, acquisition efficiency, monetization, labor efficiency, margin control, and liquidity risk (Ward Advisory). Each category answers one specific question about where the practice is leaking profit or misreading its own financial health.
Monthly dashboard reviews matter more than quarterly or annual reporting because med spa economics move fast. A provider departure, a membership promotion overflow, or a seasonal dip in injectable demand can shift metrics within weeks. Practices running monthly business reviews (MBRs) with structured KPI frameworks catch these shifts 60-90 days earlier than those relying on quarterly financials, translating directly into faster course corrections and preserved revenue (Digital Med Spa).
The most dangerous KPI combination to watch for is rising revenue alongside declining rebooking rate and increasing labor costs. This pattern signals unsustainable growth driven by new-patient acquisition without retention — a common trap for expanding med spas that optimize for top-of-funnel advertising while neglecting rebooking workflows and patient lifecycle management.
Frequently Asked Questions
What are the most important analytics KPIs for a med spa?
The seven most critical KPIs are revenue per provider hour, rebooking rate, patient acquisition cost by channel, average ticket size, labor cost as a percentage of revenue, COGS percentage, and deferred revenue coverage ratio. Tracking these monthly reveals operational weaknesses before they become cash flow problems (Ward Advisory).
How much should a med spa spend on analytics and tracking tools?
Most practices allocate 2-5% of their total marketing budget to analytics infrastructure, which includes GA4 setup, call tracking, CRM integration, and practice management software. With the average med spa spending $10,000 to $50,000 monthly on marketing, this translates to $200 to $2,500 per month for analytics tooling. The ROI is significant: practices with full-funnel attribution report 30-40% more efficient budget allocation.
What is the average patient lifetime value for a med spa?
Average patient lifetime value ranges from $1,800 to $5,200 over 12 months. The variation depends on treatment mix, retention efforts, and membership program penetration. Practices using membership analytics report 35-45% higher LTV compared to non-membership practices (ScaleHaven).
How do top med spas track marketing ROI?
Top-performing practices use a multi-level attribution model that goes beyond simple ROAS. They track patient lifetime value ROI (margin from lifetime spend minus acquisition cost), channel attribution ROI (multi-touch models rather than last-click), and contribution margin ROI (factoring in service delivery costs). The best approach connects marketing platform data directly to practice management software revenue.
What analytics tools do med spas use most?
The most common analytics stack includes GA4 for website analytics, a practice management system like Zenoti, Aesthetic Record, or Boulevard for operational data, call tracking software for phone conversion attribution, and a CRM for lead pipeline management. AI-powered platforms are gaining adoption, with 5% sales growth advantage documented for AI concierge users (Zenoti).
Sources
https://scalehaven.io/blog/med-spa-industry-statistics/
https://scalehaven.io/blog/aesthetic-industry-statistics-2026/
https://zenoti.com/thecheckin/the-2026-beauty-and-wellness-benchmark-report-medspa-edition
https://www.wardadvisory.co/blog/med-spa-kpis-to-track
https://www.digitalmedspa.net/post/key-performance-indicators-for-med-spa-growth-the-2026-precision-guide
https://cfoproanalytics.com/cfo-wiki/healthcare/marketing-spend-roi-for-medspas-and-clinics-a-cfo-framework-for-turning-ad-spend-into-predictable-profit/
https://authorityspecialist.com/industry/health/medical-spa/seo-statistics
https://foundrycro.com/blog/healthcare-marketing-benchmarks-by-specialty/
https://prospelle.com/med-spa-marketing-roi-tracking/
https://growth-onomics.com/2026-study-referral-traffic-insights-benchmarks/


