



Table of contents

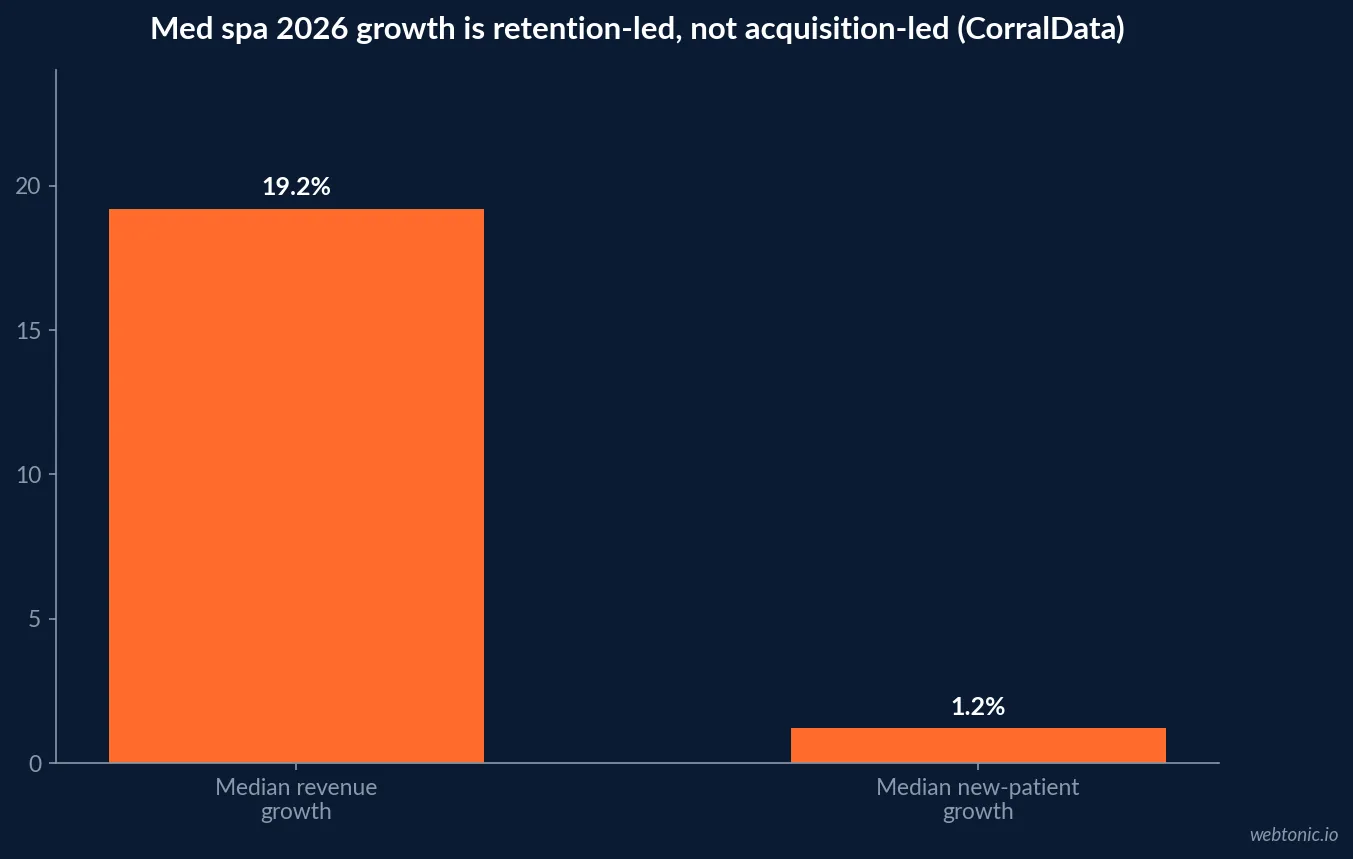
Med spa growth in 2026 is not coming from new patients walking in the door. CorralData's operational analysis of over 100 aesthetics and medspa brands found median revenue up 19.2% year over year while median new-patient growth was just 1.2% — the difference is existing patients returning more often, spending more per visit, and joining a membership.
Key Takeaways
- Median revenue grew 19.2% year over year across the CorralData cohort.
- Median new-patient growth was just 1.2% over the same period.
- Members retained 35 percentage points better than non-members, with no exceptions.
- Members spent 2.5 times more than non-members on average.
- One chain saw 94.8% member retention against 59.6% for non-members.
- A single-site brand saw members spend $1,957 against $600 for non-members.
- That single-site brand retained members at 73% over the same half.
- 37% of first rebook appointments were cancelled, per Zenoti's 2026 report.
- Cancellation fell to just 4% after two or more completed rebooks.
- Medspa membership sales grew 13% year over year in 2025.
- New guest visits declined 11% across the medspa vertical in 2025.
- Existing guest visits fell only 2% over the same period.
- Top-tier ticket size rose to $484, up from $454 the prior year.
- Median revenue per location reached $1,860,000 at the median benchmark tier.
- Staff utilization sits at just 38% at the median, an 80% vs 38% percentile gap.
- Practices under 13-minute lead response landed in the top half of growth rankings.
- AmSpa prices the industry at over $17 billion, growing more than $1 billion a year.
- Recommended marketing spend sits at 5% of revenue, roughly $5,800 a month for the average practice.
Why the lifecycle, not the funnel top, is where 2026 growth lives
CorralData's analysis, published via the American Med Spa Association, pulled directly from the practice management, CRM and billing systems of more than 100 aesthetics and medspa brands — roughly 500 locations and $500M in combined first-half revenue — across 54 operational metrics. It found median revenue growth of 19.2%, about three times the broader industry average of roughly 6%, while median new-patient growth was 1.2%. A practice with flat new-patient counts is not necessarily stalling; the better question is whether return visits, ticket size and membership penetration are climbing.
| Growth signal (2026, CorralData cohort) | Figure | What it means for the lifecycle |
|---|---|---|
| Median revenue growth, year over year | 19.2% | Roughly 3x the broader industry average |
| Median new-patient growth | 1.2% | New faces are not the growth source |
| Broader industry revenue growth average | ~6% | The benchmark the cohort is beating |
| Combined cohort scale | $500M H1 revenue, ~500 locations | A large, transaction-level sample |
| Metrics tracked per practice | 54 | Repeat rate, ticket size, membership, lead speed and more |
What membership does to retention and spend
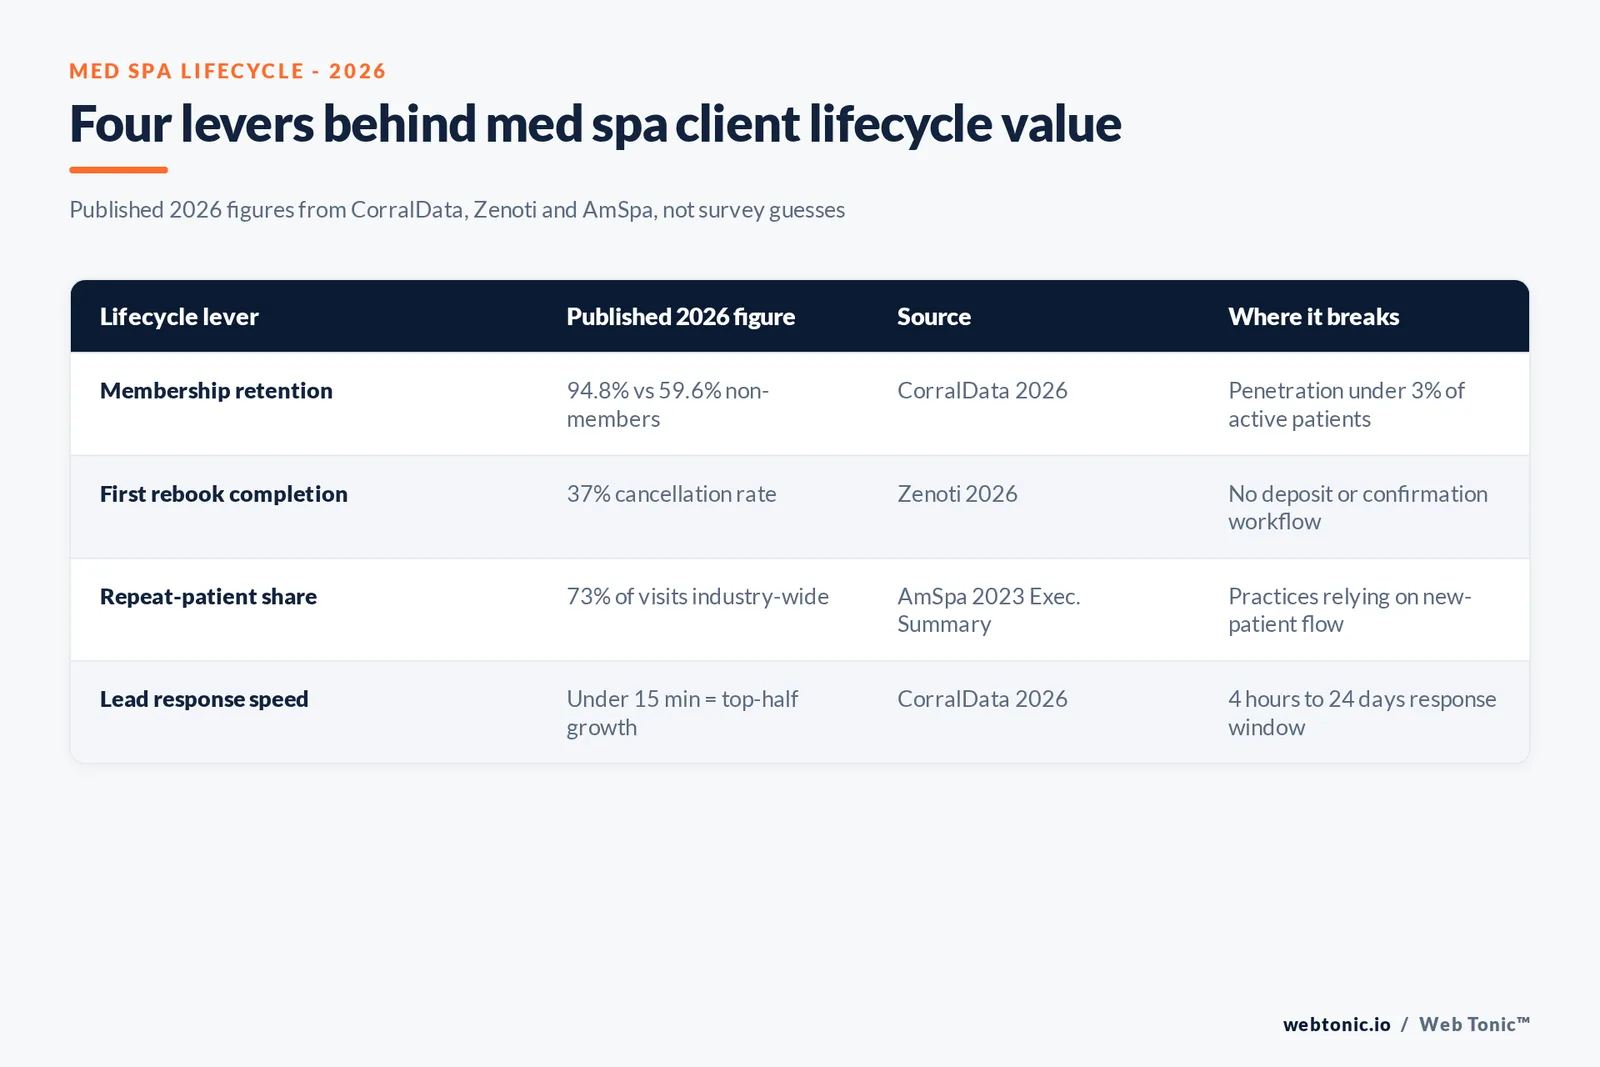
Membership is described as the single strongest lever in the CorralData dataset. Members spent 2.5 times more than non-members and retained 35 percentage points better, with no exceptions among the practices running a program. At one multi-location chain in the cohort, members retained at 94.8% versus 59.6% for non-members. At a single-site brand, members spent $1,957 in the first half of the year versus just $600 for non-members, while retaining at 73%. Practices with membership penetration under 3% of active patients are, by this data, sitting on the most quantifiable growth opportunity available to them.
| Program | Retention | Half-year spend per patient | Source |
|---|---|---|---|
| Multi-location chain, members | 94.8% | Not disclosed | CorralData, 2026 |
| Multi-location chain, non-members | 59.6% | Not disclosed | CorralData, 2026 |
| Single-site brand, members | 73% | $1,957 | CorralData, 2026 |
| Single-site brand, non-members | Lower (not disclosed) | $600 | CorralData, 2026 |
| Membership sales growth, medspa vertical | +13% YoY | — | Zenoti 2026 Benchmark Report |
The rebooking funnel: where cancellations actually happen
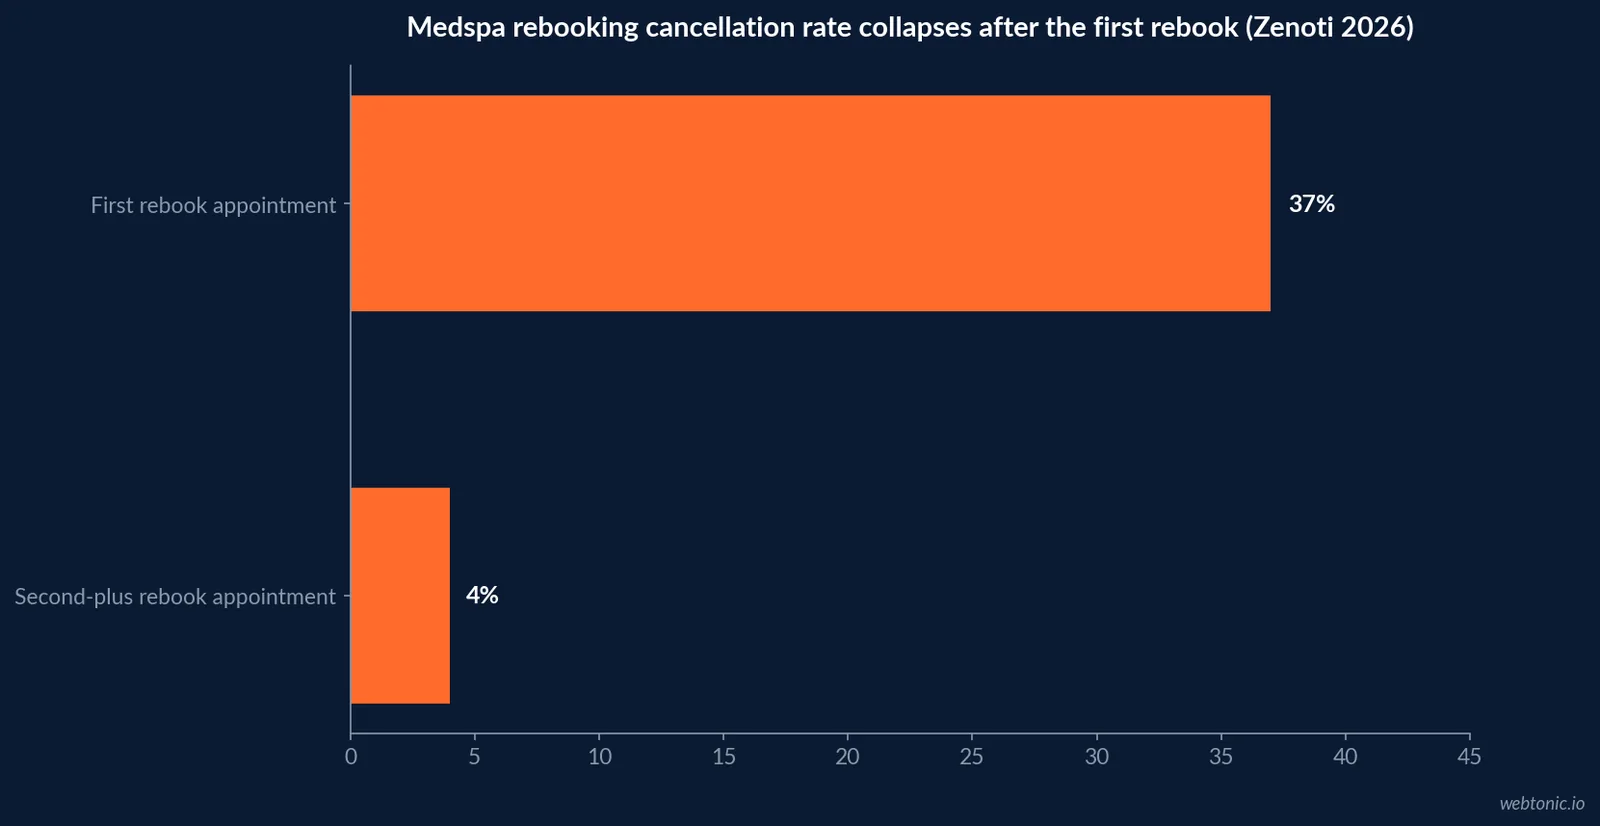
Zenoti's 2026 Beauty and Wellness Benchmark Report (medspa edition) found that among medspa locations where guests were rebooked once, 37% of those appointments were cancelled. Guests who rebooked two or more times saw that cancellation rate fall to just 4%. The lifecycle risk is concentrated at the first rebook, not the fifth — which is also where a deposit or confirmation workflow does the most work.
| Rebooking stage | Cancellation rate | Lifecycle implication |
|---|---|---|
| First rebook appointment | 37% | Highest-risk point in the whole relationship |
| Second-plus rebook appointment | 4% | Risk collapses once a habit forms |
| New guest visits, medspa vertical, 2025 | -11% YoY | Acquisition is softening industry-wide |
| Existing guest visits, medspa vertical, 2025 | -2% YoY | Retention erodes far more slowly than acquisition |
| Medspa center growth, 2025 | 18% | New locations, not same-location demand, drive expansion |
Ticket size and utilization: the other side of lifecycle value
Zenoti's benchmarks put the 90th-percentile top-tier ticket at $484 in 2025, up from $454 in 2024 and trending back toward the $500 level seen in 2023. Median revenue per location across the dataset sits at $1,860,000, with a 90th-percentile tier at $4,250,000. Staff utilization — the share of provider time actually billed — sits at a median of just 38% against 80% at the 90th percentile, the widest gap of any vertical Zenoti tracks. A lifecycle program that fills that utilization gap is compounding on top of retention, not instead of it.
| Benchmark (2025-26, Zenoti) | 90th percentile | 75th percentile | Median |
|---|---|---|---|
| Revenue per location | $4,250,000 | $2,340,000 | $1,860,000 |
| Average ticket size | $484 | $346 | $216 |
| Online booking rate | 32% | 18% | 13% |
| Staff utilization | 80% | 56% | 38% |
The repeat-patient baseline behind the growth numbers
AmSpa's own 2023 Medical Spa State of the Industry executive summary puts repeat patients at 73% of aesthetic patient visits industry-wide, with average spend per patient per visit at $527 and average monthly spend per patient at $245. That 73% baseline is the floor the CorralData cohort above is already beating through membership; a practice below it is not yet capturing the lifecycle value the rest of the industry treats as standard. Injectables remain the category most responsible for that repeat cadence: the American Society of Plastic Surgeons' 2024 Procedural Statistics Report counted 9,883,711 neuromodulator injection procedures nationally, the single largest minimally invasive category and one that depends on patients returning on a maintenance schedule rather than a one-time visit.
| Industry baseline (AmSpa 2023 Executive Summary) | Figure |
|---|---|
| Average share of visits from repeat patients | 73% |
| Average spend per patient per visit | $527 |
| Average monthly spend per patient | $245 |
| Total medical spas, 2023 | 10,488 |
| Industry employment | 100,000+ people |
Lead response speed sets the ceiling on lifetime value
A patient cannot be retained if they never book a first visit. CorralData found a small group of practices answering new leads in under 13 minutes; the rest took anywhere from four hours to 24 days. Every practice that responded within 15 minutes and booked over 30% of appointments online landed in the top half of the growth rankings, regardless of location count or service mix. That threshold effectively gates every retention tactic that follows it.
| Lead response band | Growth outcome (CorralData cohort) |
|---|---|
| Under 13 minutes | Small leading group of practices |
| Under 15 minutes + 30%+ online booking | Top half of growth rankings, regardless of size |
| 4 hours to 24 days | The rest of the cohort |
What the industry spends against this lifecycle
AmSpa's Medical Spa State of the Industry Report prices the U.S. medical aesthetics industry at over $17 billion, growing by more than $1 billion a year. Against that base, Growth99's 2026 State of Aesthetic & Elective Wellness Marketing Report (via AmSpa) found 52% of practices investing less than $2,500 a month in marketing, despite a recommended 5% of revenue — about $5,800 monthly for the average $1.39M practice — and only 25% of practices meeting or exceeding a $5,000 monthly threshold. It also reports 73% of revenue for a typical practice already coming from repeat patients, which is exactly the population a lifecycle program is built to protect. Growth99's own 2026 Benchmark Report states the underlying sample: 81 aesthetic and elective wellness practice owners, managers and marketing coordinators, surveyed in Q4 2025.
| Industry economics (2026) | Figure | Source |
|---|---|---|
| U.S. medical aesthetics industry size | $17B+, growing $1B+/yr | AmSpa Industry Report |
| Practices investing under $2,500/mo in marketing | 52% | Growth99 2026 (via AmSpa) |
| Recommended marketing spend | 5% of revenue (~$5,800/mo avg.) | Growth99 2026 (via AmSpa) |
| Practices meeting the $5,000/mo threshold | 25% | Growth99 2026 (via AmSpa) |
| Share of revenue from repeat patients, typical practice | 73% | Growth99 2026 (via AmSpa) |
Building the lifecycle case, not the acquisition case
Taken together, the 2026 data argues for measuring a med spa on repeat-visit rate, membership penetration, second-rebook completion and lead response time before a single acquisition metric. None of the practices in the CorralData cohort grew primarily by adding new patients; every one of them grew by keeping the patients they already had longer, or by converting more of them into members. Our growth marketing practice builds retention and membership campaigns around exactly these checkpoints, and our data and analytics team can wire practice-management data into a dashboard that tracks them without a $995 industry report. See how the same lifecycle logic plays out across other verticals in our customer retention statistics roundup and our customer lifetime value data.
A practical lifecycle checklist for 2026
- Track new-patient growth and existing-patient revenue growth as two separate lines, not one blended figure.
- Put a deposit or confirmation workflow specifically on the first rebook, where 37% of appointments cancel.
- Set a membership penetration target above the 3% floor flagged as underused in the 2026 data.
- Benchmark lead response time against the 15-minute mark and the 30% online-booking rate.
- Review staff utilization alongside retention — a 38% median leaves real revenue on unfilled chairs.
Frequently Asked Questions
What is a normal client retention rate for a med spa?
There is no single published industry-wide retention percentage, but CorralData's 2026 analysis of practice-management, CRM and billing data from over 100 aesthetics and medspa brands (roughly 500 locations, $500M in combined first-half revenue) found membership programs retaining patients at 94.8% at one multi-location chain and 73% at a single-site brand, against 59.6% and non-member levels respectively. Treat those as ranges tied to a specific program design, not a universal norm.
Does adding new patients or keeping existing ones drive more growth?
The 2026 CorralData figures say existing patients. Median revenue across the cohort grew 19.2% year over year, roughly three times the broader industry average of about 6%, while median new-patient growth was just 1.2%. The gap sits in wallet share: existing patients returning more often, spending more per visit and joining memberships.
How much of a rebooking funnel is lost after the first visit?
Zenoti's 2026 Beauty and Wellness Benchmark Report (medspa edition) found that among medspa locations where guests were rebooked once, 37% of those appointments were cancelled. Guests who rebooked two or more times saw that cancellation rate fall to just 4%, which is why the second and third rebook, not the first, is where a lifecycle program should concentrate deposits and confirmation workflows.
What does membership actually do to average spend?
In the CorralData cohort, members spent 2.5 times more than non-members on average. At one single-site brand studied, members spent $1,957 in the first half of the year against $600 for non-members, while retaining at 73% versus a lower non-member baseline. Practices with membership penetration under 3% of active patients were flagged as sitting on the most quantifiable growth opportunity in the dataset.
Does speed of response affect patient lifecycle value?
Indirectly, yes, by determining whether a lead becomes a patient who can later be retained at all. CorralData found a small group of practices answering new leads in under 13 minutes, while the rest took anywhere from four hours to 24 days. Every practice that responded within 15 minutes and booked over 30% of appointments online landed in the top half of the growth rankings, regardless of location count or service mix.
Sources
American Med Spa Association / CorralData - Research from 100+ medspa brands, 2026
Zenoti - 2026 Beauty and Wellness Benchmark Report, medspa edition
American Med Spa Association - Medical Spa State of the Industry Report
American Med Spa Association / Growth99 - 2026 State of Aesthetic & Elective Wellness Marketing Report
Growth99 - 2026 State of Aesthetic & Elective Wellness Marketing Benchmark Report
AmSpa - 2023 Medical Spa State of the Industry, Executive Summary
American Society of Plastic Surgeons - 2024 Procedural Statistics Report


