



Table of contents

No published study prices marketing operations or RevOps consulting as a product. What exists is consulting-wide rate data, salary data and budget benchmarks. Here is the 2026 cost model those sources support, with every figure labelled for what it actually measures.
Key Takeaways
- No published benchmark prices marketing operations consulting as a product.
- Monthly retainers for fractional marketing leadership run USD 5,000-25,000.
- Loaded hourly rates run USD 200-500 on retainer and USD 300-700 on projects.
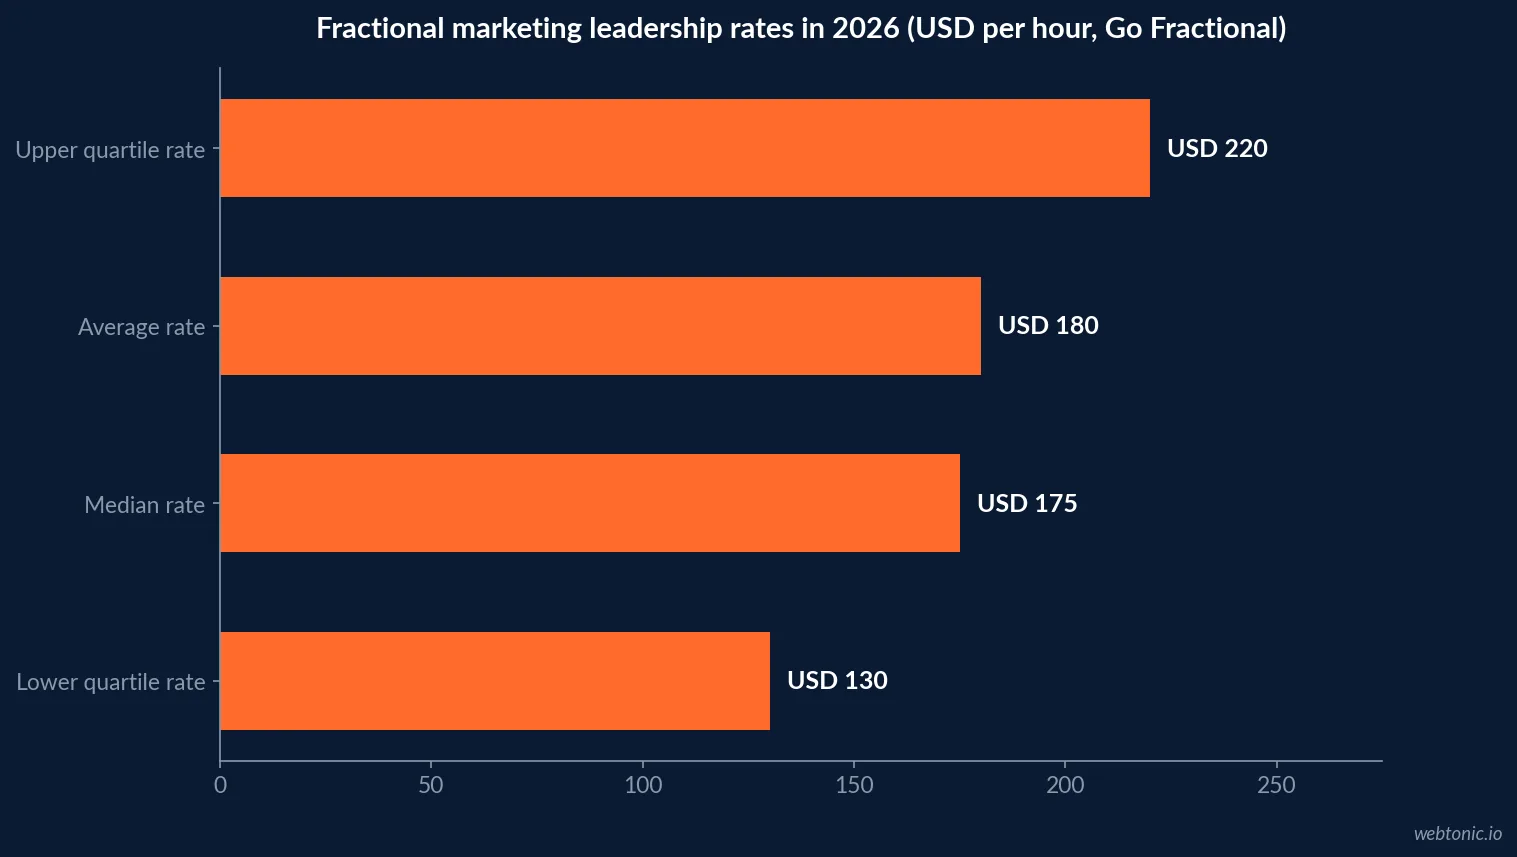
- Go Fractional reports an average rate of USD 180 an hour, median USD 175.
- The interquartile range is USD 130-220 an hour.
- Buying a project on a retainer can cost 4-5x: USD 180,000 against USD 40,000.
- Consultants price 30% by project, 29% hourly, 16% retainer, 15% value, 10% daily.
- 38% of consultants earn USD 10,000 or more a month.
- A US marketing leader costs USD 293,575 in total cash compensation.
- Senior mis-hires reach 213% of salary; the floor is 30% of first-year earnings.
- Retained search adds 25-35% of first-year compensation.
- Martech is 19.4% of marketing budget, down from 26.6% in 2021.
- Marketing budgets sit at 9.0% of revenue with spend growth of 1.7%.
- 33.6% of digital marketing activity is already delivered externally.
- Global management consulting is worth USD 1,111.35 billion in 2026.
Start with what is not measured
Marketing operations and RevOps consulting has no rate card in any published survey. Analysts size global management consulting services at USD 1,063.77 billion in 2025, USD 1,111.35 billion in 2026 and USD 1,407.09 billion by 2030, but nobody isolates this discipline inside that total.
That matters for a buyer, because every "average cost of RevOps consulting" figure circulating online is derived from something broader. The defensible approach is to state the base each number comes from and to price the scope, not the label.
The published rate bases
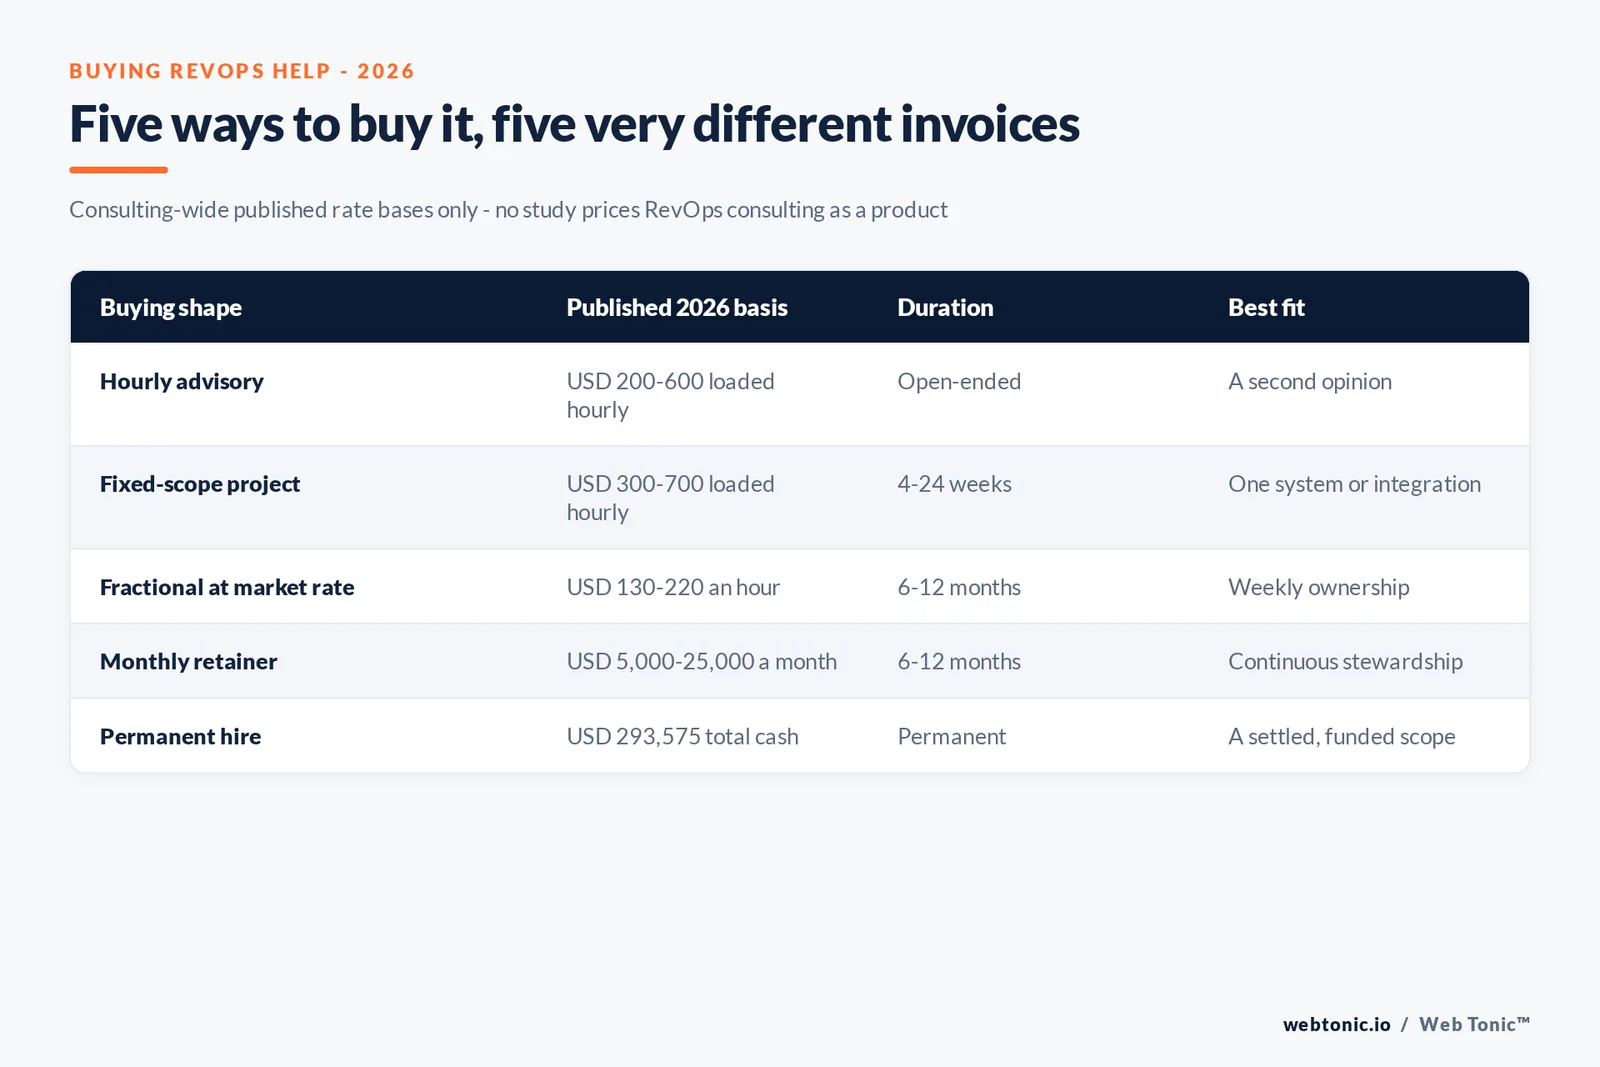
Fractional Pulse reports loaded hourly rates of USD 200-500 on retainer, USD 300-700 on projects and USD 200-600 hourly, with monthly retainers of USD 5,000-25,000, engagements of 6-12 months plus a 30-day notice period, and projects running 4-24 weeks. Go Fractional reports an average of USD 180 an hour, a median of USD 175, an interquartile range of USD 130-220 and roughly nine hours a week, about 468 hours a year.
Both datasets describe senior marketing leadership rather than operations specialists, so treat them as the ceiling of the market rather than the middle of it. They are still the closest published anchors.
| Buying shape | Published 2026 basis | Typical duration | Best fit |
|---|---|---|---|
| Hourly advisory | USD 200-600 loaded hourly | Open-ended | A second opinion on an existing plan |
| Fixed-scope project | USD 300-700 loaded hourly | 4-24 weeks | One system or one integration |
| Fractional at market rate | USD 130-220 an hour | 6-12 months | Weekly ownership of the function |
| Monthly retainer | USD 5,000-25,000 a month | 6-12 months | Continuous stewardship |
| Permanent hire | USD 293,575 total cash | Permanent | A settled, funded scope |

How the market actually prices
Consulting Success surveyed roughly 1,000 consultants and found project-based pricing at 30%, hourly at 29%, monthly retainers at 16%, value-based at 15% and daily rates at 10%. It also reports that 79% want to raise their fees, that 38% earn USD 10,000 or more a month, and that 51% of value-based pricers land projects worth USD 10,000 or more against 39% of the rest.
Read that as a warning about quoted averages. When nearly a third of the market prices by the hour and another third by the project, an "average fee" mixes two units that are not comparable. Ask for the unit first.
| Pricing model | Share of consultants | What it suits in RevOps |
|---|---|---|
| Project-based | 30% | Migrations, integrations, attribution builds |
| Hourly | 29% | Advisory, audits, escalation cover |
| Monthly retainer | 16% | Definitions, reporting, ongoing hygiene |
| Value-based | 15% | Work tied to a payback or pipeline target |
| Daily rate | 10% | Workshops and short diagnostics |
The four-to-five-times mistake
The most expensive error is buying the wrong shape. Fractional Pulse models a finite project delivered on an open-ended retainer at four to five times the cost of the same work bought as a project: USD 180,000 against USD 40,000 in its worked example. Retainers make sense when the work never ends; a CRM migration ends.
The reverse failure is quieter. Buying continuous stewardship as a string of disconnected projects means paying for the same discovery every quarter, which is how operations budgets grow without the reporting getting better.
| Scope | Right shape | Wrong shape | Cost of getting it wrong |
|---|---|---|---|
| CRM or platform migration | Fixed project | Rolling retainer | Up to 4-5x, USD 180k vs USD 40k |
| Attribution rebuild | Fixed project | Hourly advisory | Scope creep with no completion date |
| Definition governance | Retainer | Repeat projects | Re-paying discovery each quarter |
| Automation maintenance | Retainer | Ad-hoc hourly | Escalations priced at peak rates |
| One-off diagnostic | Day rate | Retainer | Months of fee before the first finding |
Against the cost of hiring
Built In puts US marketing leadership at USD 225,908 base, USD 67,667 additional and USD 293,575 total cash. Talentfoot cites a US Department of Labor floor of at least 30% of first-year earnings for a bad hire, senior mis-hires reaching 213% of salary, and retained search at 25-35% of first-year compensation.
Those numbers do not argue against hiring. They argue for hiring once the scope has stopped moving, and for renting the capability while it is still being defined - the same logic we apply when scoping a measurement and data programme.
Which budget it comes out of
Gartner's 2026 CMO Spend Survey, reported by Chief Marketer, puts martech at 19.4% of marketing budget - a five-year low against 26.6% in 2021 - with 62% planning to invest more, 56% moving to consumption-based pricing, 41% adding usage controls and 24% overhauling systems.
Meanwhile The CMO Survey 2026 reports marketing budgets at 9.0% of company revenue and 9.6% of total firm budgets, with spend growth of 1.7% and headcount growth down 50% year on year. Flat money and fewer people is precisely the condition in which operations work gets funded by reallocation.
| Budget line | 2026 figure | Implication for an operations fee |
|---|---|---|
| Martech share of budget | 19.4% | Fee competes with licences, not with media |
| Planning to invest more in tech | 62% | Appetite exists; the case must be written |
| Consumption-based pricing | 56% | Variable tool cost needs monthly review |
| Marketing budget as % of revenue | 9.0% | Total envelope is fixed |
| Marketing spend growth | 1.7% | Funding comes from reallocation |
| Headcount growth | Down 50% YoY | Renting beats requisition in the short run |
The external-delivery baseline
The CMO Survey puts 33.6% of digital marketing activity in external hands, up from 31.6% in 2022 and projected at 34.3% within two years, split across agencies 15.5%, consultancies 12.7% and other partners 10.4%. Capability emphasis runs 59.5% build, 38.5% partner and 1.9% buy.
For pricing, the useful read is that partnering is normal rather than exceptional, so a fee should be compared against the internal alternative rather than treated as an unusual expense.
What a defensible quote contains
Three things: the unit, the scope boundary and the outcome. The unit resolves the 30%-versus-29% ambiguity above. The boundary states which systems are in and which are not, which is what stops a 4-24 week project drifting into a twelve-month retainer. The outcome names the number the work is meant to move.
We publish the same structure for paid channels in our Google Ads pricing guide, because the failure mode is identical: a headline price with no unit attached is not a price.
What moves a quote up or down
Four variables explain most of the spread between two quotes for apparently identical work: the number of systems in scope, whether historical data has to be migrated or only forward-instrumented, whether definitions already exist, and who does the internal legwork. Each one changes the hours, and hours are what the USD 200-600 loaded rates convert into money.
The variable buyers underestimate is the last one. A project priced assuming internal admin support and then delivered without it lands at the USD 300-700 project band for work that was quoted at advisory rates, which is how a fixed scope quietly becomes a change order.
| Scope variable | Cheaper when | More expensive when | Rate band affected |
|---|---|---|---|
| Systems in scope | One CRM, one automation tool | Multiple CRMs after M&A | USD 300-700 project |
| Historical data | Forward instrumentation only | Years of records to reconcile | USD 300-700 project |
| Definitions | Already agreed and documented | Disputed across teams | USD 5,000-25,000 retainer |
| Internal support | A named internal admin | No internal counterpart | USD 200-600 hourly |
| Reporting audience | One team | Board and investors | Value-based, 15% of market |
Five questions before signing
Which unit is this priced in, given the market splits 30% project, 29% hourly, 16% retainer? Which systems are explicitly out of scope? What does completion look like inside the 4-24 week project window? Which number is the work expected to move, and against which published comparator - the 16-month CAC payback median is the usual one? And what is handed over so the work survives a change of supplier?
Answers to those five turn a quote into a contract you can hold someone to. Their absence is the single best predictor of a project that ends as an open-ended retainer at four to five times the cost.
A budgeting sequence that works
Scope the diagnostic as a day or a short project, priced at the USD 300-700 loaded project band. Buy the build as a fixed project against a named system list. Then, and only then, decide whether continuous stewardship justifies a retainer in the USD 5,000-25,000 band or an internal owner at USD 293,575 total cash.
Bought in that order, each step funds the next with evidence. If you want the sequence priced against your own stack, our growth team can scope it, or send us your current reporting setup.
Related reading
- Marketing Strategy Consulting Statistics: Cost and Pricing
- Marketing Operations Consulting Statistics: Hiring vs Outsourcing
- Marketing Operations Consulting Statistics: Adoption and Tooling
- Marketing Strategy Consulting services at Web Tonic
Frequently Asked Questions
How much does marketing operations consulting cost in 2026?
There is no published benchmark for this service specifically, so the honest answer is a range built from consulting-wide data. Fractional Pulse reports loaded hourly rates of USD 200-500 on retainer, USD 300-700 on projects and USD 200-600 hourly, with monthly retainers of USD 5,000-25,000 and projects running 4-24 weeks. Go Fractional reports an average marketing leadership rate of USD 180 an hour, median 175, with a 130-220 interquartile range.
What pricing models do consultants actually use?
Consulting Success surveyed roughly 1,000 consultants and found project-based pricing at 30%, hourly at 29%, monthly retainers at 16%, value-based at 15% and daily rates at 10%. Fixed-scope project pricing is therefore the most common shape for cross-system implementation work, while retainers suit continuous stewardship of definitions and reporting.
Is a retainer or a project cheaper for RevOps work?
For finite work, a project. Fractional Pulse models a project delivered on a retainer at four to five times the cost of the same work bought as a project - USD 180,000 against USD 40,000 in its worked example. The reverse is also true: continuous ownership bought as repeated projects loses the context that makes each engagement faster than the last.
How does that compare with hiring the role?
Built In puts total cash compensation for a US chief marketing officer at USD 293,575, made of USD 225,908 base and USD 67,667 additional. Talentfoot cites a US Department of Labor floor of at least 30% of first-year earnings for a bad hire, with senior mis-hires reaching 213% of salary and retained search at 25-35%. Those figures are the real comparison point for any rented alternative.
What budget does this work usually come out of?
Technology and operations budgets rather than campaign budgets. Gartner's 2026 CMO Spend Survey puts martech at 19.4% of the marketing budget, a five-year low against 26.6% in 2021, with 56% of organisations shifting to consumption-based pricing. The CMO Survey 2026 puts total marketing budgets at 9.0% of company revenue with spend growth of just 1.7%, so operations work is generally funded by reallocating, not by adding.
Sources
Fractional Pulse - Fractional Executive Engagement Comparison
Go Fractional - Fractional CMO Rates
Consulting Success - Consulting Fees Study
Built In - CMO Salary Data
Talentfoot - Cost of a Leadership Mis-hire, 2026 data
Chief Marketer - Gartner 2026 CMO Spend Survey coverage
The CMO Survey - Highlights and Insights Report 2026
The Business Research Company - Management Consulting Services Global Market Report


