



Table of contents

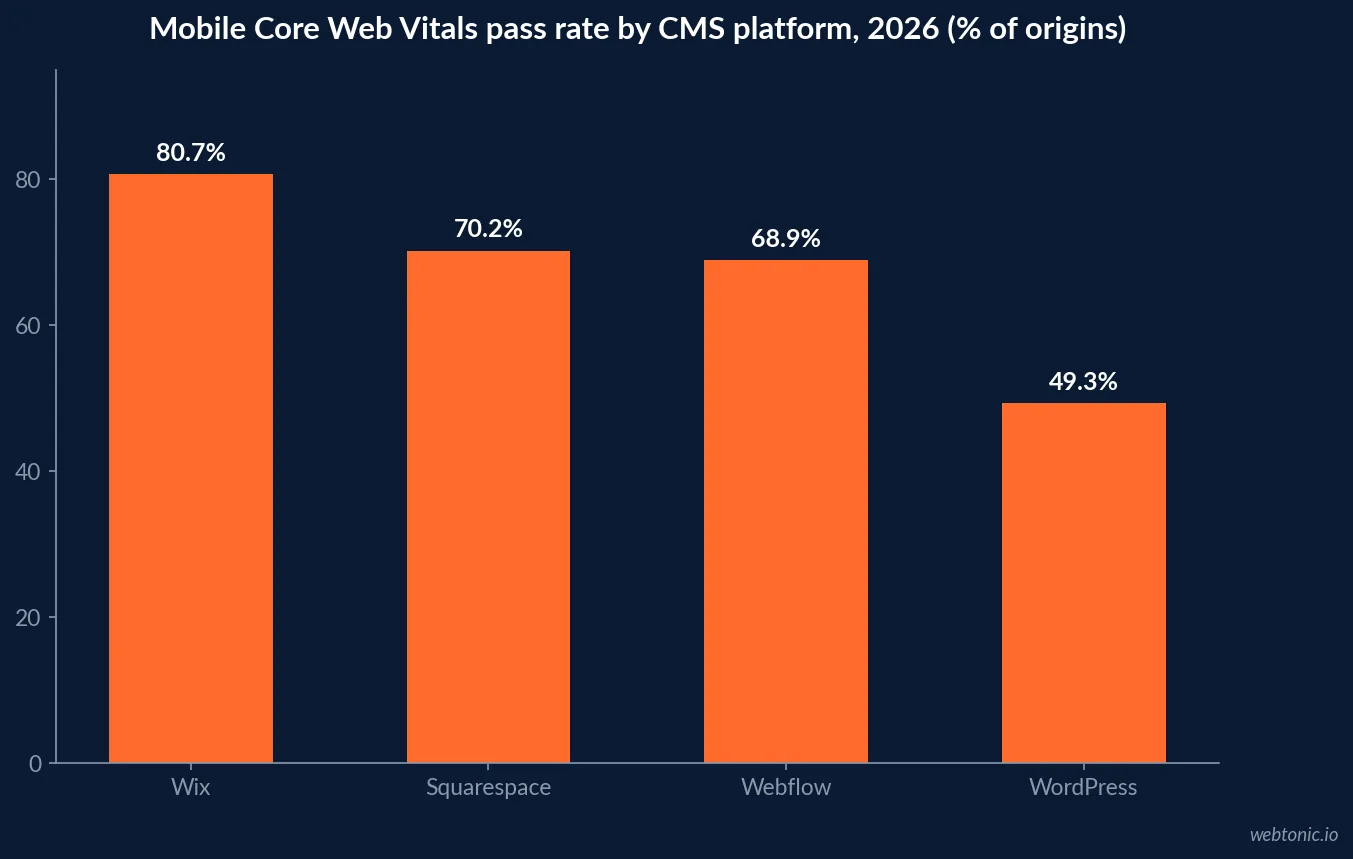
Webflow origins pass all three mobile Core Web Vitals 68.9% of the time against 49.3% for WordPress — a 19.6-point field gap on a platform where most industrial sites convert under 1% of visitors into an RFQ. Here is the 2026 data a manufacturer should weigh before replatforming.
Key Takeaways
- Mobile Core Web Vitals pass rate: Webflow 68.9%, WordPress 49.3%, Squarespace 70.2%, Wix 80.7% (CrUX field data, May 2026).
- Good mobile TTFB share: Webflow 55.5% versus WordPress 24.8%.
- Webflow ships the lightest combined mobile payload — 918 KB JS + 855 KB images.
- A separate HTTP Archive cut reports 58% Webflow vs 42% WordPress on CWV — same direction, different denominator.
- Platform share: 0.8% of all websites and about 822,550 active sites (roughly 1 in 125) on BuiltWith-style tracking.
- A 1M-domain commercial crawl instead reports 2.8% of websites and 4.2% of identifiable-CMS sites, up from 0.6% in 2022.
- Adoption concentrates in agencies (24.6%) and B2B SaaS (18.4%); 64.2% of new B2B SaaS launches in 2025–26 chose Webflow.
- WordPress still holds 48.6% of mid-market B2B services sites and 42.4% of all websites.
- Webflow revenue reached $213M in 2024, up 66%, at a $4B valuation with 300,000+ brands.
- 95% of marketing leaders say current website governance practices hurt their ability to manage sites.
- 52% of marketing leaders will prioritise optimising for AI-driven search in 2026.
- Most industrial sites convert well under 1% of visitors to a quote request; optimised capability pages reach 1–3%.
- Industrial sites lose an estimated 40–70% of qualified visitors before reaching the RFQ form.
- Every 1-second LCP improvement correlates with an 8.4% conversion lift; pages under 2.5s convert 34.2% better than 4s+ pages.
- Redesign benchmarks: average 287% ROI within 9 months, 4.8-month payback, inquiries +47%.
- WordPress sites average 18.4 plugins — the main reason its field speed floor is so low.
Field Speed: The Numbers That Justify a Replatform
Chrome UX Report field data via the HTTP Archive May 2026 crawl — every detected origin on each platform, not a lab test — puts Webflow at 68.9% mobile CWV pass and WordPress at 49.3%, with Squarespace at 70.2% and Wix leading at 80.7%. On server response, the gap is wider: 55.5% of Webflow origins hit good mobile TTFB against 24.8% of WordPress origins, because Webflow ships on one CDN-backed hosting stack while WordPress runs on everything from $3 shared plans to enterprise clusters.
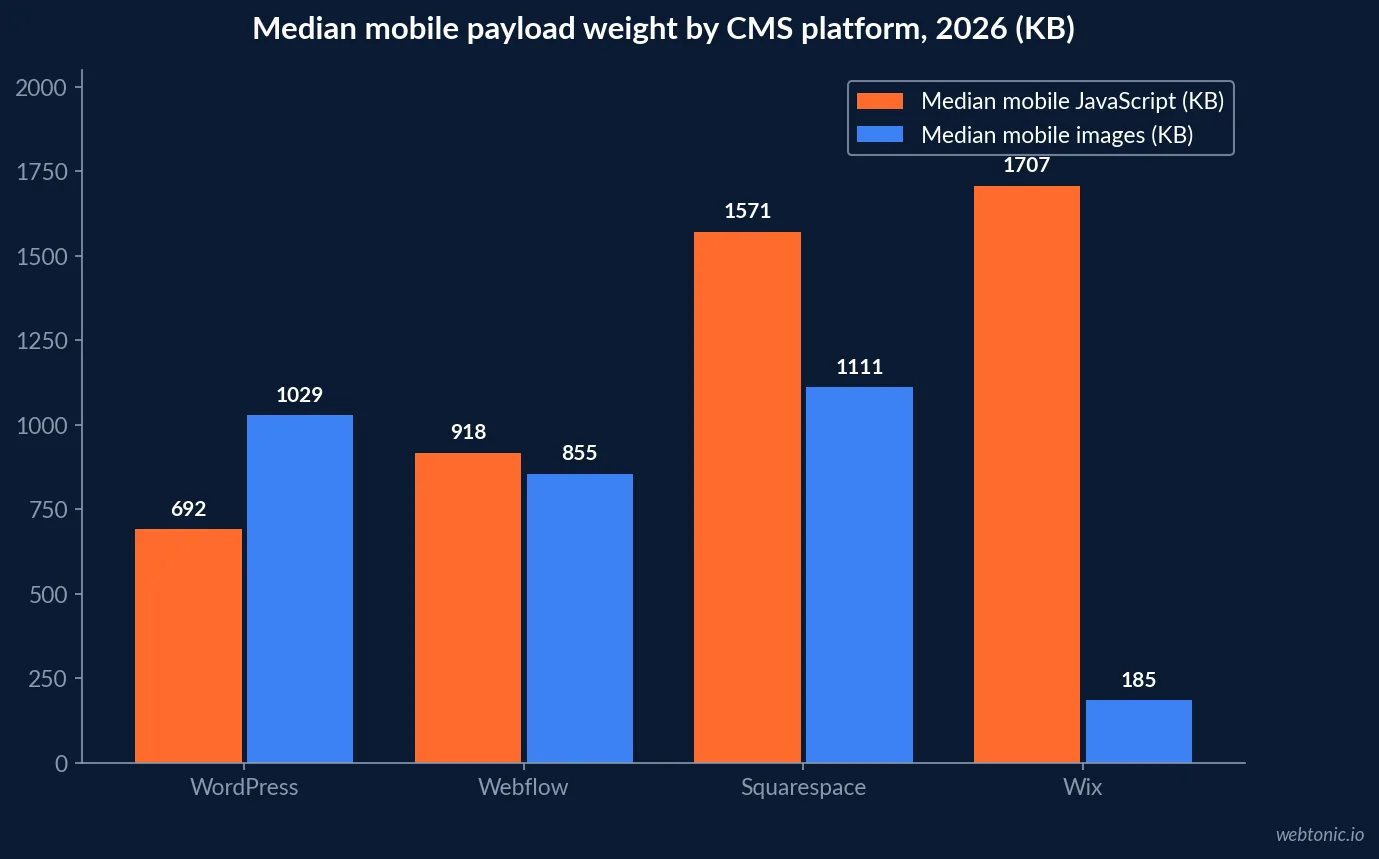
Payload tells the more useful story for a catalogue-heavy industrial site. Webflow carries 918 KB median mobile JavaScript and 855 KB median images — the lightest combined total of the four — thanks to clean generated markup and automatic responsive images with WebP conversion. WordPress ships the least JavaScript (692 KB) but the second-heaviest images (1,029 KB) and averages 18.4 plugins. A separate HTTP Archive analysis reports the same direction at 58% versus 42%.
| Metric (mobile field data) | Webflow | WordPress | Squarespace | Wix |
|---|---|---|---|---|
| All three Core Web Vitals pass | 68.9% | 49.3% | 70.2% | 80.7% |
| Good TTFB share | 55.5% | 24.8% | 80.8% | 66.9% |
| Median JavaScript weight | 918 KB | 692 KB | 1,571 KB | 1,707 KB |
| Median image weight | 855 KB | 1,029 KB | 1,111 KB | 185 KB |
| Optimisation ceiling | Medium–high | Very high | Low | Low |
| Optimisation difficulty | Easy–moderate | Moderate–hard | Very limited | Very limited |
Platform Share: Two Denominators, Both True
Webflow’s market share is quoted at wildly different levels, and the difference is the sample. Technology-detection tracking reports 0.8% of all websites — about 822,550 active sites, roughly 1 in 125 — and 1.2% of identifiable-CMS sites, up from 544,053 sites two years earlier. A 1,000,000-domain crawl weighted toward commercial sites reports 2.8% of websites and 4.2% of identifiable-CMS sites, up from 0.6% in 2022 — 4.7x growth in four years.
For a manufacturer the segment cuts matter more than the headline. Webflow holds 24.6% of agency sites and 18.4% of B2B SaaS sites, and 64.2% of new B2B SaaS launches in 2025–26 chose it over WordPress. Mid-market B2B services — the closest available proxy for industrial — remains 48.6% WordPress, with enterprise at 22.4%. Translation: choosing Webflow puts you ahead of your industrial peer group on platform defaults, not behind a crowd. Usage tracking shows the platform doubling its share of all sites since 2021.
| Segment | Webflow share 2026 | Webflow share 2022 |
|---|---|---|
| Agencies (digital, design) | 24.6% | 6.8% |
| B2B SaaS | 18.4% | — |
| All websites (1M-domain crawl) | 2.8% | 0.6% |
| Identifiable-CMS sites (1M-domain crawl) | 4.2% | — |
| All websites (technology-detection tracking) | 0.8% | — |
| New B2B SaaS launches, 2025–26 | 64.2% | — |
Company Health: Does the Vendor Survive Your Depreciation Schedule?
Manufacturers plan capital on longer horizons than marketing teams do, so vendor durability is a fair question. Webflow reached $213 million in annual revenue in 2024, up 66% from $128 million in 2023, holds a $4 billion valuation on $334.9 million of total funding, employs roughly 1,292 people, and reports 300,000+ brands on the platform across more than 190 countries. Webflow e-commerce grew 647.81% over three years to 12,501 active stores.
The platform’s own 2026 research also frames the buying case honestly: 95% of marketing leaders say current website governance practices hurt their ability to manage their sites, and 52% will prioritise optimising for AI-driven search in 2026. For an industrial marketing team of one or two people who currently file a ticket to change a spec table, governance is usually the real driver of a replatform — not raw speed.
The Spec Catalogue Problem a CMS Can Actually Solve
The highest-value use of Webflow on a manufacturing site is not the homepage — it is turning part families into CMS collections. Each item renders a crawlable HTML specification table, carries its own schema markup, links internally to related parts and certifications, and keeps the PDF datasheet as a download beneath it rather than as the only source of truth. That single architectural change addresses the structural issue documented in our industrial technical SEO benchmarks: specifications locked in documents cannot carry markup or pass link equity.
The same pattern fixes friction. Industrial design analysis finds sites lose 40–70% of qualified visitors before reaching the RFQ form, with hidden specifications, complex forms and missing certifications the top three causes — all three are content-model problems, not visual-design problems. A CMS collection with a spec table, a certification field, a CAD download and a short quote form on every part page removes them at the template level instead of page by page.
What the Rebuild Has to Return
The benchmark to beat is unflattering: manufacturing lead-generation data shows most industrial sites converting well under 1% of visitors into a quote request, while well-optimised capability pages reach 1–3%. Moving 2,000 monthly visitors from 1% to 2.5% is the difference between 20 and 50 inquiries a month — which is why conversion architecture, not aesthetics, should own the project brief.
Speed feeds the same equation. Analysis across 184 page-speed A/B tests found every one-second LCP improvement produced an 8.4% conversion lift, pages under 2.5s converting 34.2% better than 4s+ pages, and mobile pages under 200ms INP converting 22% above slower pages. Redesign ROI benchmarks report average returns near 287% within nine months, a 4.8-month payback, inquiries +47% and demo requests +58%. Track the result against your reporting baseline at 30, 60, 90 and 180 days.
| Lever | Benchmark impact | Where Webflow helps |
|---|---|---|
| Platform speed floor | 68.9% vs 49.3% mobile CWV pass | Managed hosting and CDN by default |
| 1-second faster LCP | +8.4% conversion rate | Automatic responsive images and WebP |
| HTML spec tables instead of PDFs | Rich-result and AI-crawler eligibility | CMS collections per part family |
| Removing RFQ-form friction | Recovers part of the 40–70% drop-off | Template-level forms and fields |
| Marketing team autonomy | 95% cite governance as a blocker | Editor access without developer tickets |
| Full redesign programme | 287% average ROI, 4.8-month payback | Faster build cycles than custom stacks |
When Webflow Is the Wrong Answer
- Deep ERP or PIM sync. Thousands of SKUs with live pricing and stock usually need a headless front end or middleware, not native CMS collections.
- Complex product configurators. Custom code embeds work, but the maintenance sits outside the visual editor.
- Very large catalogues. CMS item limits force pagination strategy decisions early — model this before migrating.
- Heavily plugin-dependent workflows. WordPress’s 18.4 average plugins often encode real process; audit what each one does first.
- Teams that will bolt on heavy animation. Custom code and large Lottie files are the main causes of slow Webflow builds — the platform floor is not a guarantee.
- Multi-language distributor networks. Localisation is available but costs more than most industrial budgets assume.
- Sites where WordPress is already fast. A lean install on managed hosting beats a bloated Webflow build; measure before migrating.
- Projects without a content model. Replatforming a PDF-first catalogue reproduces the same problem in a nicer editor — fix the model first, alongside the rest of your industrial marketing plan.
- No owner for post-launch iteration. Budget for the first 90 days of optimisation, or the investment stops compounding at launch.
Frequently Asked Questions
Is Webflow a good platform for a manufacturing website?
For marketing sites, capability pages and spec catalogues, the field data supports it. Webflow origins pass all three mobile Core Web Vitals 68.9% of the time against 49.3% for WordPress, and 55.5% hit good mobile TTFB versus 24.8%. Webflow also ships the lightest combined mobile payload of the four major platforms (918 KB JS plus 855 KB images). Where it fits less well is deep ERP, configurator or PIM integration, which usually needs custom code or a headless front end.
What share of websites use Webflow in 2026?
It depends on the measurement population. BuiltWith-style tracking puts Webflow at 0.8% of all websites — roughly 822,550 active sites, about 1 in 125 — and 1.2% of identifiable-CMS sites. A 1,000,000-domain crawl weighted toward commercial sites reports 2.8% of all websites and 4.2% of identifiable-CMS sites, up from 0.6% in 2022. Both agree on direction: Webflow is the fastest-growing mainstream CMS, concentrated in agencies (24.6%) and B2B SaaS (18.4%).
Is Webflow faster than WordPress for an industrial catalogue?
On defaults, yes; at the ceiling, no. May 2026 field data shows Webflow at 68.9% mobile CWV pass and WordPress at 49.3%, largely because WordPress runs across every tier of hosting and averages 18.4 plugins. A separate HTTP Archive cut reports 58% versus 42%. But a lean WordPress install on managed hosting will beat a Webflow site loaded with custom code and heavy Lottie animations. Platform sets the floor; implementation sets the outcome.
What should a manufacturer expect from a website rebuild?
Most industrial sites convert well under 1% of visitors into a quote request, while well-optimised sites reach 1–3% on capability pages, and industrial sites lose an estimated 40–70% of qualified visitors before reaching the RFQ form. Redesign benchmark data reports average ROI near 287% within nine months and a 4.8-month payback, with inquiries up 47% and demo requests up 58%. Speed contributes directly: each one-second LCP improvement correlates with an 8.4% conversion lift.
How should spec sheets be handled in Webflow?
As CMS collection items, not PDFs. A Webflow CMS collection for part families lets every specification render as crawlable HTML with schema markup while the PDF stays as a download beneath it. That solves the biggest structural SEO problem on manufacturing sites — specifications locked in documents that cannot carry markup or pass internal-link equity — and it is why the replatform decision and the technical SEO backlog belong in the same project.
Sources
PageSpeed Matters — WordPress vs Webflow vs Squarespace vs Wix (CrUX, May 2026)
Popupsmart — 50+ Webflow Statistics 2026
Visionary — CMS Market Share Report 2026 (1M-domain crawl)
Tech Insider — WordPress vs Webflow 2026 Core Web Vitals
MFG Web Design — Manufacturing Website & Lead Generation Benchmarks 2026
Pixerts — Industrial Website Design Best Practices 2026
KrishaWeb — Website Redesign Cost vs ROI 2026
Visionary — Conversion Benchmark Report 2026 (184 page-speed tests)
The Alien Design — Webflow Usage Statistics 2026


