Table of contents
Enterprise marketing teams pull from 12 data sources with only 38% integrated into one view — while 48% of manufacturing marketing teams are one or two people. That gap, not tool choice, is why industrial reporting stays manual. Here is the 2026 data.
Key Takeaways
- Enterprises average 12 marketing data sources; only 38% are fully integrated.
- Integrating one new source takes 6.2 months on average.
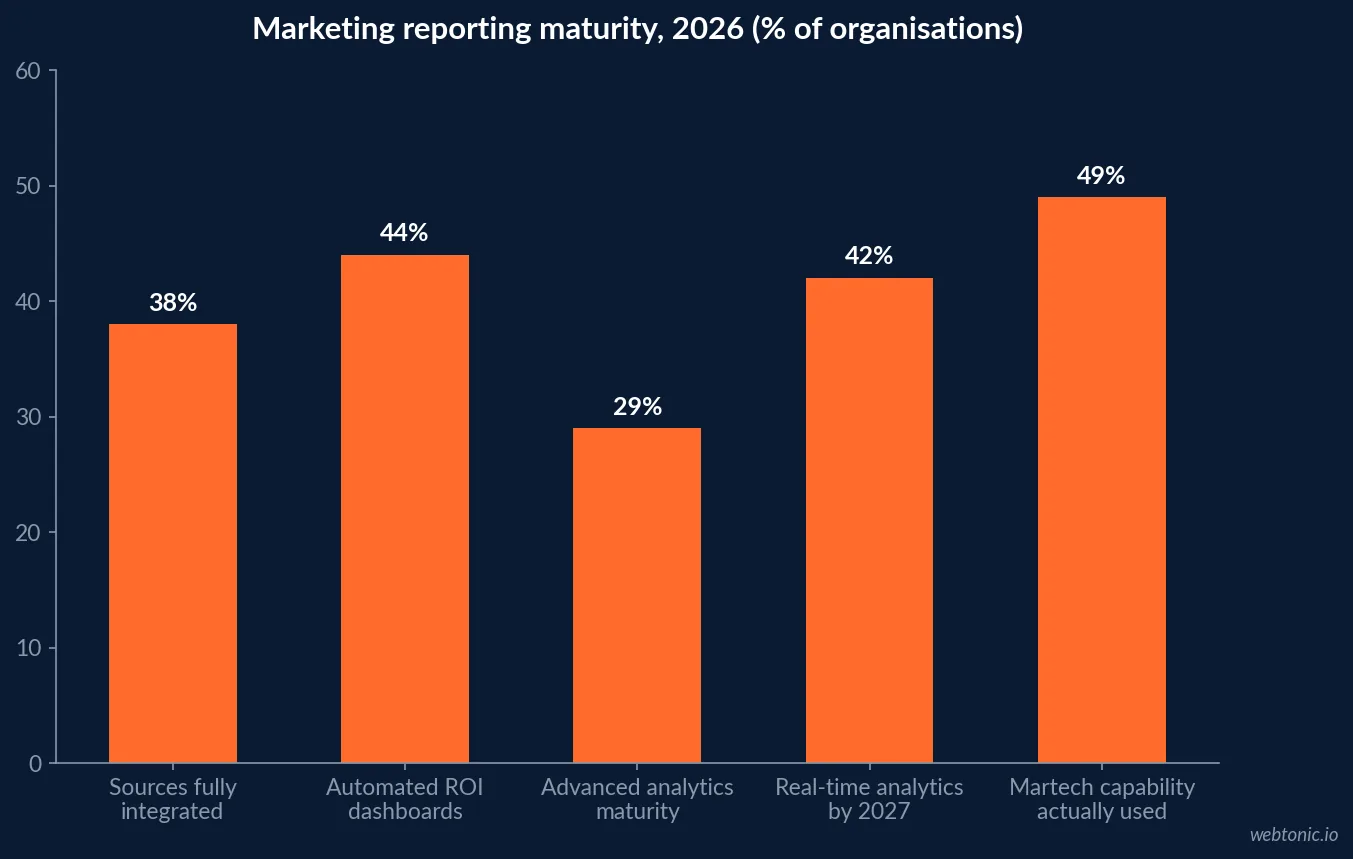
- Just 44% of organisations run automated marketing ROI dashboards.
- 42% of marketing teams are projected to have real-time analytics by 2027.
- 29% of organisations sit at advanced analytics maturity; mature teams report 23% higher marketing ROI.
- Analytics infrastructure pays back in 8–14 months.
- 56% of marketers cannot find time to analyse data — four times the 14% citing lack of expertise.
- 48% of manufacturing marketing teams have 1–2 people; 60% are at companies under 100 staff.
- 74% of US manufacturers employ fewer than 20 people in total.
- Manufacturing website conversion benchmarks sit at 2.2%.
- Industrial funnel bands: visitor-to-lead 1–3%, lead-to-MQL 15–30%, MQL-to-SQL 20–40%, close 15–30%.
- CAC payback beyond 18 months strains industrial cash flow even with strong LTV.
- Marketers use only 49% of purchased martech capability (up from 33% in 2023, below 58% in 2020).
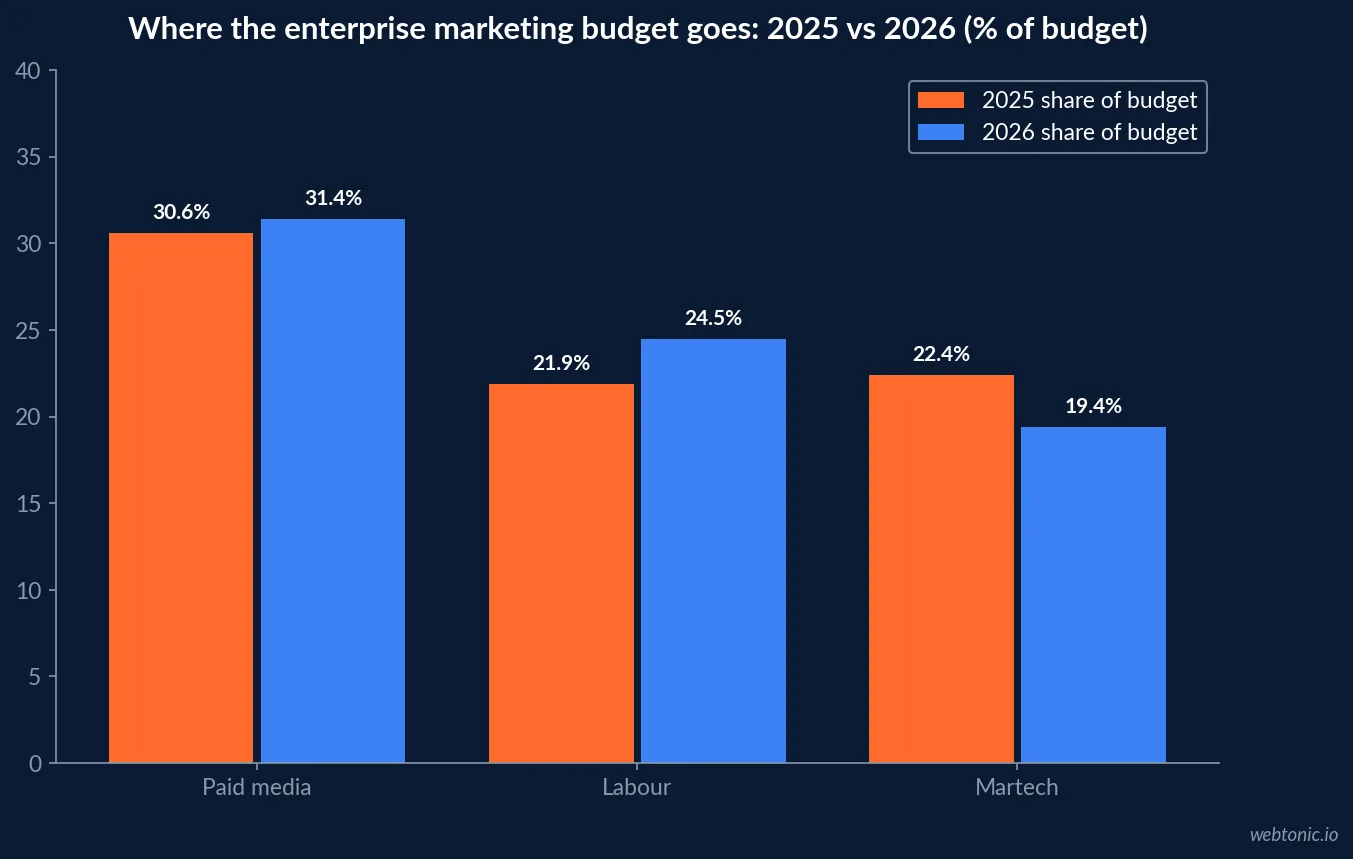
- Martech fell to 19.4% of marketing budget from 26.6% in 2021 — yet 62% of CMOs plan to spend more.
- Marketing budgets sit at 7.8% of revenue (Gartner) / 9.0% (The CMO Survey).
- 90.3% of teams use AI agents somewhere, but only 23.3% run them in production.
- 72% of manufacturing marketers now rate themselves at least moderately AI-proficient.
The Integration Gap Is the Whole Story
2026 marketing analytics benchmarks put the average enterprise at 12 marketing data sources with only 38% fully integrated into a unified view, and 6.2 months as the average time to bring a new source in. Salesforce’s narrower count puts the typical marketing organisation at seven sources. Either number is more than a two-person industrial marketing team can reconcile by hand every month.
The consequence shows up as a reporting ceiling rather than a data shortage. Only 44% of organisations have automated marketing ROI dashboards, 29% reach advanced analytics maturity, and 42% of marketing teams are only projected to have real-time analytics by 2027. Supermetrics survey data identifies the bottleneck precisely: 56% of marketers say they lack time to analyse, four times the 14% who cite lack of expertise, even as returned data rows grew 230% and query volume 50%.
| Reporting capability | 2026 figure | What it means for a lean industrial team |
|---|---|---|
| Marketing data sources | 12 per enterprise (7 typical) | Consolidation matters more than adding tools |
| Sources fully integrated | 38% | Most dashboards are still partial views |
| Time to integrate a source | 6.2 months | Sequence one connection per quarter |
| Automated ROI dashboards | 44% of organisations | Automation is still a competitive edge |
| Advanced analytics maturity | 29% | Mature teams report 23% higher marketing ROI |
| Analytics payback period | 8–14 months | Fits inside one industrial budget cycle |
Why Manufacturing Reporting Stays Manual: Team Size
Straight North’s 2026 survey of 245 manufacturing marketers is the clearest picture of who actually builds these dashboards: 48% work on teams of one or two people, 60% are at companies with fewer than 100 employees, and only 14% represent enterprises above 300 staff. NAM data adds the wider context — 74% of US manufacturing firms employ fewer than 20 people in total.
Their reported challenges follow from that. Lead quality tops the list at 25%, reaching buyers at the right moment at 19% — together nearly 45% of responses — while only 8% struggle to create content. Manufacturing marketers have solved production; they have not solved measurement and targeting. AI is filling part of the gap: 72% rate themselves at least moderately proficient, 55% use AI for written content, and 55% say it improved content quality.
The Manufacturing KPI Scorecard, With Benchmark Bands
Industrial B2B metric guidance gives usable bands for each funnel stage, and each acts as a thermometer for a specific failure. A lead-to-MQL rate below 15% is a traffic-quality or qualification-criteria problem, not a sales problem. A weak MQL-to-SQL rate points at the handoff. And in industrial sales, CAC payback beyond 18 months strains cash flow even when lifetime value looks excellent.
Site conversion anchors the top of that funnel: First Page Sage data puts manufacturing website conversion at 2.2% (PCB design and manufacturing slightly higher at 2.4%), with sales cycles of 6 to 12 months on large enterprise deals — which is why conversion rates calculated inside a single calendar year are usually wrong. Email benchmarks for the business and finance category sit at a 31.35% open rate and 2.78% click rate.
| Dashboard metric | Benchmark band | Diagnostic if below band |
|---|---|---|
| Visitor-to-lead | 1–3% | Offer, page clarity or traffic intent |
| Lead-to-MQL | 15–30% | Traffic quality or qualification criteria |
| MQL-to-SQL | 20–40% | Marketing-to-sales handoff and SLA |
| SQL close rate | 15–30% | Fit, pricing or competitive position |
| Site conversion (manufacturing) | 2.2% median | Spec content and quote-path friction |
| CAC payback | Under 18 months | Channel mix or deal-size mismatch |
Budget Context: Reporting Competes With Media for a Shrinking Slice
Gartner’s 2026 CMO Spend Survey (401 leaders) puts marketing budgets at 7.8% of company revenue — near a multi-year low — with The CMO Survey reporting 9.0% across a broader US sample. Inside that budget, paid media rose to 31.4% while martech fell to 19.4%, down from 26.6% in 2021, a five-year decline. Yet 62% of CMOs say they plan to invest more in martech, and 15.3% of budget now goes to AI against only 30% who say they are ready to scale it.
For a manufacturer, the read is straightforward: reporting infrastructure has to justify itself against media spend in the same budget line. The 8–14 month analytics payback and 23% ROI premium for analytics-mature teams are the two numbers to bring to that conversation.
Don’t Buy More Stack — Use the Stack
The most useful martech statistic for a lean industrial team is a utilisation number. Gartner’s survey chain shows marketers using 49% of purchased martech capability in the latest reading — recovered from the widely-quoted 33% low of 2023 but still below 58% in 2020. The 2026 landscape lists 15,505 products, up just 0.79%, the flattest growth in fifteen years, with 1,488 added and 1,367 removed.
AI agents follow the same pattern of ambition ahead of readiness: 90.3% of surveyed teams use AI agents somewhere, but only 23.3% run them in full production and 80.6% keep them assist-only. A manufacturer with a two-person team should read all of this as permission to consolidate rather than expand.
Real-Time Reporting: Useful, and Usually Oversold
Business intelligence adoption data reports 92% of data-driven companies using BI weekly, with 64% of users saying it improves decision speed, and roughly two-thirds of enterprises embedding analytics directly in workflows rather than standalone tools. But on a 10-month industrial buying cycle, most metrics do not change meaningfully day to day.
The honest split for manufacturers: real time for delivery and spend anomalies (budget pacing, form breakages, lead-response time), weekly for pipeline movement, and monthly or quarterly for CAC, payback and channel ROI. Chasing live dashboards on quarterly-scale metrics manufactures noise, and noise is expensive when one analyst is also running the campaigns.
Reporting Cadence and Ownership on a Lean Team
Dashboard projects in manufacturing fail on ownership more often than on tooling. With 48% of teams at one or two people and an average 6.2-month integration timeline per data source, the realistic model is one owner, one scorecard and a fixed cadence — not a self-serve BI rollout. Embedded analytics is where the market has moved anyway, with roughly two-thirds of enterprises putting dashboards inside the workflow instead of a standalone tool.
Sales alignment is the other precondition. Without a written marketing-to-sales SLA defining what an MQL is, what an SQL is and how fast sales must respond, the 20–40% MQL-to-SQL band is unmeasurable — the definitions drift every quarter and the dashboard silently changes meaning. Agreeing those definitions from historical data, not opinion, is a one-afternoon exercise that makes every downstream number comparable.
| Cadence | What it answers | Metrics on the view | Owner |
|---|---|---|---|
| Daily (alerts only) | Is anything broken? | Spend pacing, form failures, lead response time | Marketing ops |
| Weekly | Is pipeline moving? | Leads, MQLs, SQLs, opportunity value by source | Marketing lead |
| Monthly | Is the mix working? | CPL, CPQL, stage conversion vs benchmark bands | Marketing + sales |
| Quarterly | Should budget move? | CAC payback, channel ROI, self-reported source mix | Leadership |
What to Automate First on a Two-Person Team
- Lead-source hygiene — one required source field, one naming convention. Nothing downstream works without it.
- CRM + quote value — join marketing data to deal value; a 2.2% site conversion means nothing without deal size.
- One-page scorecard — the six KPI bands above, refreshed automatically. Only 44% of organisations have this.
- Stage-level pipeline view — spend, leads, MQL, SQL, opportunity value by channel.
- Anomaly alerts — spend pacing and form-failure alarms instead of a live dashboard nobody opens.
- Quarterly channel review — CAC payback against the 18-month industrial ceiling.
That sequence takes a lean manufacturing team from spreadsheet reconciliation to a defensible board slide without buying anything new. When you are ready to wire it, our data intelligence practice builds the pipeline and growth marketing acts on it — the same reporting spine behind our manufacturing paid search benchmarks and industrial email performance data.
Frequently Asked Questions
What KPIs belong on a manufacturing marketing dashboard?
Six stages, each with a benchmark band: visitor-to-lead 1-3%, lead-to-MQL 15-30%, MQL-to-SQL 20-40%, SQL close rate 15-30%, plus CAC payback (an industrial red flag above 18 months) and pipeline value by source. Site conversion sits at 2.2% for manufacturing, so plan quote, demo and technical-download goals against that floor rather than an all-industry average.
How many data sources does a marketing dashboard need to combine?
Enterprise marketing teams average 12 data sources, and only 38% are fully integrated into a unified analytics view — with 6.2 months as the average time to integrate a new one. Salesforce puts the typical marketing organisation at seven sources. For a manufacturer, the minimum viable set is ads, website analytics, CRM and ERP or quote data, because deal value lives outside marketing tools.
What share of companies have automated marketing reporting?
Only 44% of organisations run automated marketing ROI dashboards, and just 42% of marketing teams are projected to have real-time analytics by 2027. 29% sit at advanced analytics maturity on Gartner's scale. Analytics infrastructure investments show an average payback of 8 to 14 months, and analytics-mature organisations report 23% higher marketing ROI.
Why is manufacturing marketing reporting still manual?
Team size, not tooling. 48% of manufacturing marketing teams are one or two people, 60% work at companies under 100 employees, and 74% of US manufacturing firms have fewer than 20 staff in total. Survey data shows the analysis bottleneck is time rather than expertise — 56% of marketers say they cannot find time to analyse data properly, versus 14% citing lack of expertise.
Should a manufacturer build dashboards or buy a platform?
Follow the utilisation data before spending. Marketers report using only 49% of purchased martech capability, recovered from 33% in 2023 but still below 58% in 2020, and martech has fallen to 19.4% of marketing budget even though 62% of CMOs plan to invest more. For most manufacturers the winning sequence is to fix lead-source hygiene, connect CRM and quote value, then automate a single one-page scorecard — before evaluating another platform.
Sources
Digital Applied — Marketing Analytics Statistics 2026
CO Consulting — CMO & Marketing Budget Statistics 2026
Digital Applied — Martech Statistics 2026
Artic Agency — Key Metrics for Industrial B2B Marketing
Straight North — 2026 Manufacturing Marketing Survey
Manufacturing Lead Generation — 100+ Benchmarks 2026
Konabayev — Marketing Analytics Statistics 2026
ZipDo — Business Intelligence Statistics 2026