



Table of contents
Between 42% and 51% of sites pass all three Core Web Vitals depending on the dataset, client-side rendering costs an average 32% of content in Google’s index, and the most damaging error on an industrial site is locking tolerances inside a PDF. Here is the 2026 technical SEO benchmark set for manufacturers.
Key Takeaways
- Core Web Vitals pass rates: 58.0% desktop / 49.1% mobile among origins with full field data; 51.3% mobile in a June 2026 cut; 42% on a stricter whole-web basis.
- URL-level pass rates split hard: 84% for homepages versus 51% for long-tail pages.
- 91% of audited sites fail at least one Core Web Vital somewhere; 34% of crawled URLs fail a threshold.
- Median mobile LCP is 3.8s versus 2.1s desktop; median INP 188ms versus 76ms.
- 97% of sites are slower on mobile than desktop.
- Fully client-side rendered sites lose an average 32% of indexed content; SPAs average 47% fewer indexed pages.
- Googlebot indexes only the first 2MB of each HTML, JS and CSS file.
- Third-party AI crawlers do not execute JavaScript — JS-rendered spec tables are invisible to them.
- Most common issues: duplicate content 52%, robots.txt problems 38%, broken internal links 35%, redirect chains 28%, orphan pages 22% of sites.
- Googlebot spends about 29% of crawl on pages that never appear in search results.
- 30.8% of scanned domains have no sitemap at all.
- Only 39% of sites use any structured data; 72% of markup is JSON-LD and 33% of implementations contain errors.
- Industrial organic CTR on technical product pages: 2.1–3.8%; organic conversion to inquiry 1–3%.
- 84% of manufacturing buyers start supplier evaluation online; ~80% of the decision is done before first contact.
- Page-one results pass CWV 47.6% of the time versus 44.2% on page two; top three positions 50.8%.
Core Web Vitals: Three Numbers, Three Denominators
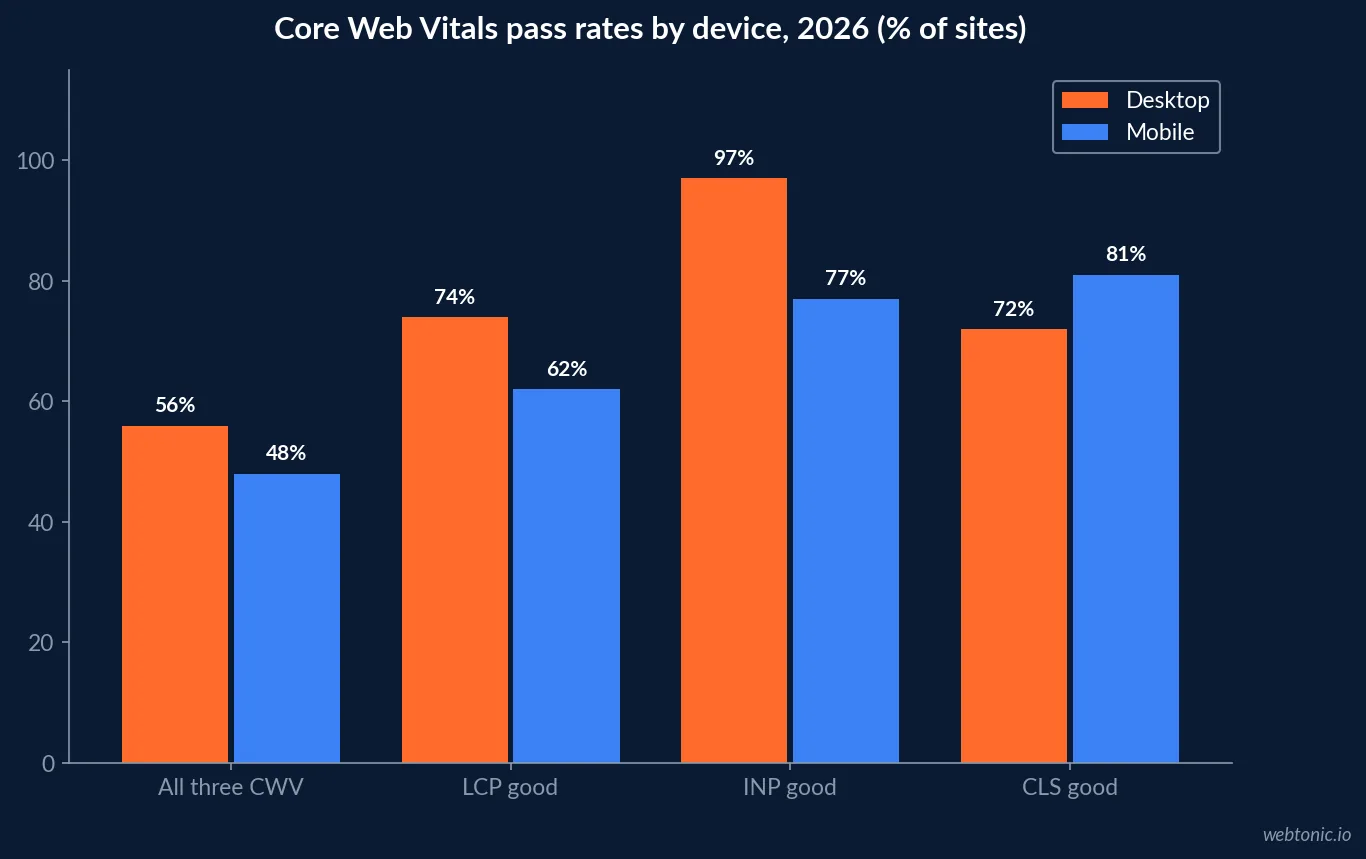
Any single “pass rate” quoted without its denominator is misleading, and manufacturers get burned by this in vendor pitches. A May 2026 analysis of 13.75 million sites reports 58.0% passing all three Core Web Vitals on desktop and 49.1% on mobile among origins with complete field data. A June 2026 study puts mobile at 51.3%, up from 43.2% a year earlier. A stricter whole-web cut lands at 42%. All three are defensible; they measure different populations.
The number that matters for an industrial catalogue is neither. Aggregate crawl data shows passes concentrated on homepages and cornerstone pages: 84% homepage pass rate against 51% on long-tail pages, with a 66% aggregate URL-level rate and 91% of sites failing at least one metric somewhere. Spec pages, filtered category views and gated resource pages — exactly the templates that generate RFQs — are the ones failing.
| Metric | Desktop | Mobile | Google’s “good” threshold |
|---|---|---|---|
| All three Core Web Vitals | 56–58% | 48–51% | All three in range |
| LCP good | 74% | 62% | ≤ 2.5s |
| INP good | 97% | 77% | ≤ 200ms |
| CLS good | 72% | 81% | ≤ 0.1 |
| Median LCP | 2.1s | 3.8s | ≤ 2.5s |
| Median INP | 76ms | 188ms | ≤ 200ms |
The PDF Specification Trap
This is the finding that separates manufacturing technical SEO from every other vertical. Industrial SEO analysis for 2026 names it directly: the single most damaging technical error on manufacturing websites is locking tolerance data, material grades and engineering documentation inside PDF datasheets. Crawlers index PDFs far less frequently than HTML pages, PDFs cannot carry schema markup, and they cannot pass the internal-linking relationships that build topical authority. Image-based scans — still common in older operations — are unreadable to Google and to AI crawlers entirely.
The competitive consequence is concrete: search a part specification such as a structural bolt size and a distributor page with an HTML specification table will outrank the manufacturer’s locked PDF, even from a lower-authority domain. The recommended fix is a hybrid architecture — rebuild each spec sheet as an on-page crawlable HTML table with bold labels and clear units, keep the PDF as a download beneath it — and it typically produces measurable ranking movement on standard part pages within 60 to 90 days. Sites with schema on product specifications also earn featured snippets at roughly twice the rate of unstructured competitors in the same category.
Rendering: Where Industrial Catalogues Disappear
Modern manufacturing sites are increasingly React or Next.js builds, and that is where indexation quietly leaks. Client-side rendered sites lose an average 32% of their content from Google’s index compared with server-rendered equivalents, and single-page applications average 47% fewer indexed pages without SSR or dynamic rendering. Infinite scroll without pagination costs 41% fewer indexed items, and JavaScript blocks rendering on 23% of all web pages — with average JS weight now 507KB compressed, 54% of it third-party.
Two hard limits should shape the build spec. Googlebot processes only the first 2MB of each HTML, JS and CSS file for indexing, with subresources fetched and size-checked separately. And third-party AI crawlers — GPTBot, OAI-SearchBot, PerplexityBot, ClaudeBot — read only raw server HTML and never execute JavaScript, while many manufacturing sites block them by default at the WAF. If a procurement manager asks an assistant for a shortlist of suppliers, a JS-rendered spec table plus a default Cloudflare rule is enough to remove you from consideration. That is the same access problem covered in broader industrial SEO benchmarks.
| Rendering pattern | Measured impact | Fix |
|---|---|---|
| Full client-side rendering | −32% of content indexed on average | Server-render spec, capability and certification pages |
| Single-page application, no SSR | 47% fewer indexed pages | Static generation or SSR per route |
| Infinite scroll, no pagination | 41% fewer indexed items | Paginated crawlable URLs alongside the scroll |
| Files over 2MB | Silent truncation by Googlebot | Split bundles; keep spec HTML small and first |
| AI crawlers blocked at WAF | No eligibility for third-party AI citations | Explicitly allow GPTBot, PerplexityBot, ClaudeBot |
Crawl Budget and the Long Catalogue Problem
Crawl budget is rarely an issue below 10,000 pages, which exempts many manufacturers — until a filtered parts catalogue generates URLs combinatorially. Where it does bite, the waste is measurable: log-file analysis shows Googlebot spending about 29% of its crawl on pages that never appear in search results, while a clean internal-link structure with a maximum depth of three clicks improves crawl efficiency by roughly 31%. Removing 404s and redirect chains produced 18% more indexed pages and 12% more organic traffic within eight weeks in a documented case study.
Faceted navigation is the usual culprit on distributor sites, and untreated crawl directives can inflate crawlable URL counts by 30–40% on catalogue-heavy sites. Resolving canonical chain conflicts has been observed to improve indexation coverage 20–35% within 60 days. AI crawlers add new pressure: bot traffic from GPTBot, ClaudeBot and peers has driven a 340% increase in crawl requests since 2024, and 28% of sites now actively block AI crawlers — a decision worth making deliberately rather than inheriting from a firewall default.
The Issue Frequency Table Every Audit Reproduces
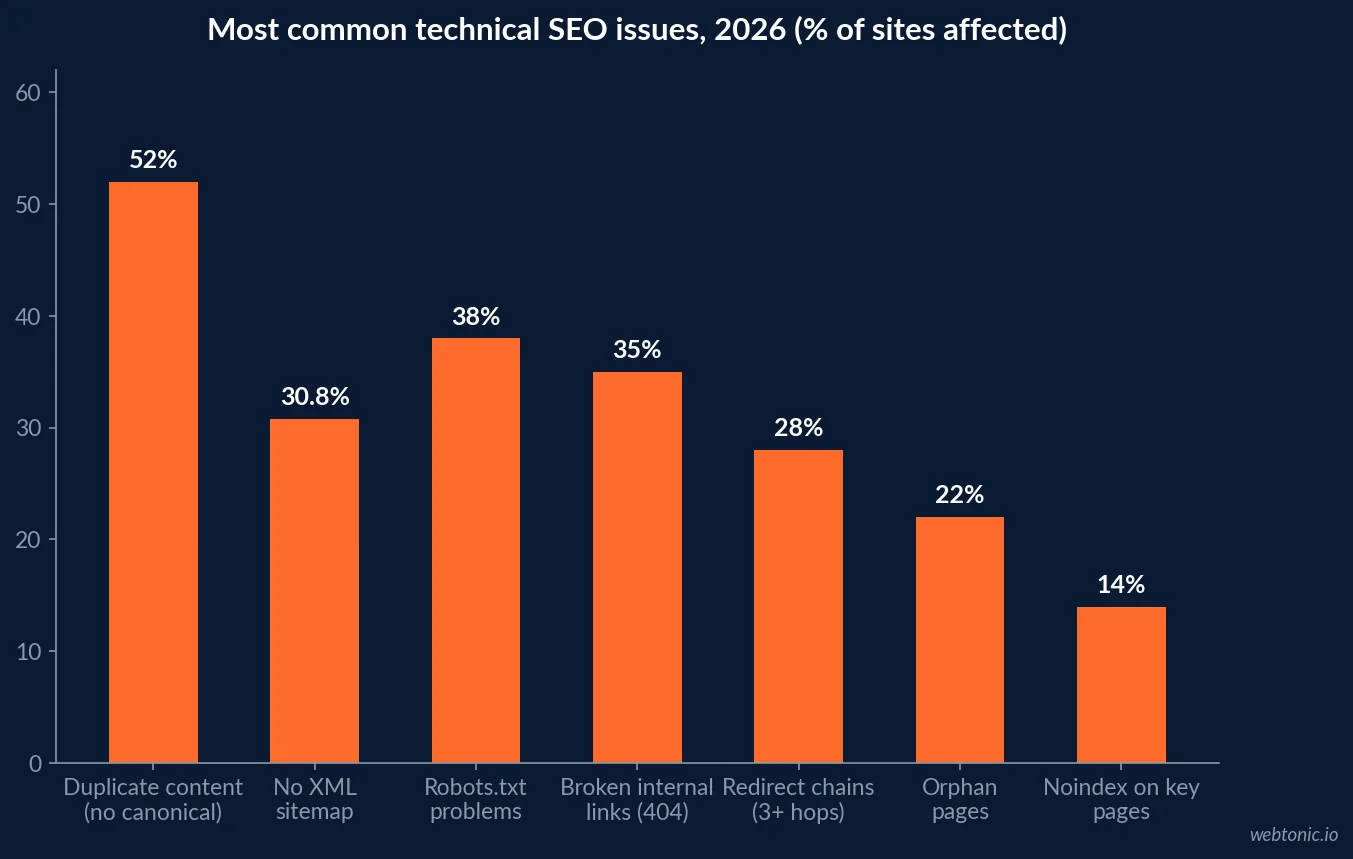
Site-level frequency data is remarkably consistent across crawl datasets. Duplicate content without canonicals affects 52% of sites, missing or incorrect robots.txt 38%, broken internal 404s 35%, redirect chains of three or more hops 28%, orphan pages 22% and noindex on important pages 14%. Enterprise sites average 450+ broken links against a web-wide average of about 17 per site. Cheap structural gaps persist too: 2026 benchmark scanning found 30.8% of domains with no sitemap at all.
Structured data is the most under-exploited item on the list for manufacturers. Only 39% of sites use any schema, 72% of implementations are JSON-LD, and 33% contain errors that suppress rich results. Since PDFs cannot carry markup, every spec sheet converted to HTML is also a schema opportunity — which is precisely why the PDF fix and the schema fix belong in the same sprint rather than sequential quarters of roadmap work.
| Issue | Share of sites affected | Priority for an industrial catalogue |
|---|---|---|
| Duplicate content without canonical | 52% | High — part variants and filtered views |
| Missing or incorrect robots.txt | 38% | High — also governs AI crawler access |
| Broken internal links (404) | 35% | Medium — dead ends in crawl paths |
| Redirect chains (3+ hops) | 28% | Medium — common after site migrations |
| Orphan pages | 22% | High — spec pages with no internal links |
| No XML sitemap at all | 30.8% of domains | High — cheapest fix on the list |
| Noindex on important pages | 14% | Critical when it hits product templates |
Speed as a Commercial Metric, Not a Score
Speed data only becomes persuasive internally when it is expressed in conversions. Mobile-versus-desktop analysis shows median INP of 188ms on mobile against 76ms on desktop and 97% of sites slower on mobile, with a one-second site converting at 3.05% against 0.41% for a five-second site. Passing all three Core Web Vitals correlated with 23% higher conversion rates across 2.3 million sessions, and 24% lower bounce rates in a separate 2026 comparison.
The ranking correlation is real but modest, and worth quoting honestly: page-one results pass Core Web Vitals 47.6% of the time versus 44.2% on page two, rising to 50.8% for the top three positions. Speed is not the lever that puts an industrial page on page one — relevance and technical accessibility do that — but it decides how many of the engineers who arrive stay long enough to download a CAD file. Pair it with landing-page conversion data before deciding where the next sprint goes.
What Industrial Sites Should Expect After the Fixes
Audits of 44 manufacturing and distribution sites give the most realistic outcome bands available: organic CTR on technical product pages of 2.1–3.8% (below consumer verticals), organic visitor-to-inquiry conversion of 1–3% on well-optimised sites, first measurable ranking movement in 60–120 days for low-competition terms and 6–12 months for competitive ones, and year-one organic traffic gains of 30–80% where technical debt is cleared first.
The commercial stakes justify the sequence. 84% of manufacturing buyers begin supplier evaluation online, roughly 80% of the procurement decision is complete before a vendor is contacted, and 95% of manufacturers that win a contract were already on the buyer’s shortlist before the first sales call. A spec page that Google renders late and an AI crawler cannot read is not a ranking problem — it is a shortlist problem.
The Fix Order That Respects Industrial Constraints
- Convert spec PDFs to HTML tables first. Highest-leverage change; movement in 60–90 days, and it unlocks schema.
- Server-render every spec, capability and certification page. CSR costs 32% of indexed content; AI crawlers run no JavaScript.
- Audit robots.txt and the WAF explicitly — 38% of sites get robots.txt wrong and 28% block AI crawlers, often unintentionally.
- Canonicalise part variants and filtered views. Duplicate content affects 52% of sites; chain fixes lift coverage 20–35%.
- Publish a sitemap — 30.8% of domains still have none, and it is a one-hour job.
- Flatten to three clicks maximum. Worth roughly 31% in crawl efficiency and rescues orphaned spec pages.
- Fix mobile LCP on templates, not the homepage. Long-tail pages pass at 51% versus 84% for homepages.
- Add and validate JSON-LD on the new HTML spec pages; 33% of implementations contain suppressing errors.
- Re-crawl monthly and watch indexed-page count, not scores — index coverage is the metric tied to RFQs.
- Re-check the same templates every quarter alongside the rest of your industrial marketing scorecard — rendering regressions arrive with every redeploy.
Frequently Asked Questions
What share of websites pass Core Web Vitals in 2026?
It depends on the dataset and the denominator. Among origins with complete field data, 58.0% pass all three on desktop and 49.1% on mobile in the May 2026 CrUX-based sample; a separate June 2026 analysis puts mobile at 51.3%, up from 43.2% a year earlier; and a stricter whole-web cut lands at 42%. URL-level data is harsher than site-level: homepage pass rates reach 84% while long-tail pages sit near 51%. For a manufacturer, that means your product and spec pages almost certainly score worse than your homepage.
What is the most damaging technical SEO mistake on manufacturing websites?
Locking specifications inside PDF datasheets. PDFs are crawled far less often than HTML, cannot carry schema markup, and cannot pass internal-link equity; image-based scans are unreadable to Google and to AI crawlers entirely. An HTML specification table on a distributor page will outrank a manufacturer's locked PDF for a part-number query. The fix is a hybrid architecture — crawlable HTML spec table on the page, PDF kept as a download below it — which typically shows ranking movement on standard part pages within 60 to 90 days.
Does JavaScript rendering hurt industrial product catalogues?
Materially. Fully client-side rendered sites lose an average of 32% of their content from Google's index versus server-rendered equivalents, and single-page applications average 47% fewer indexed pages without SSR or dynamic rendering. Third-party AI crawlers (GPTBot, PerplexityBot, ClaudeBot) do not execute JavaScript at all, so a JS-rendered spec table is a blank page to them. Googlebot also indexes only the first 2MB of each HTML, JS and CSS file.
Which technical issues are most common across sites?
Site-level frequency data puts duplicate content without canonicals at 52% of sites, missing or incorrect robots.txt at 38%, broken internal 404s at 35%, redirect chains of three or more hops at 28% and orphan pages at 22%. An aggregate 2026 crawl dataset found 91% of sites fail at least one Core Web Vital somewhere and 34% of crawled URLs fail a threshold. Googlebot also spends about 29% of its crawl on pages that never appear in search results.
What organic benchmarks should an industrial site expect?
Organic click-through rates on technical product pages average 2.1–3.8%, below consumer verticals, while organic conversion to inquiry runs 1–3% on well-optimised industrial sites. Expect 60–120 days for movement on low-competition terms and 6–12 months on competitive ones, with year-one organic traffic gains of 30–80% where technical debt is cleared first. 84% of manufacturing buyers begin supplier evaluation online and around 80% of the decision is complete before first vendor contact.
Sources
PageSpeed Matters — Core Web Vitals Pass Rates (13.75M sites)
JustAnalytics — Core Web Vitals Statistics 2026
Searchlab — Technical SEO Statistics 2026
Crawlix — Top Technical SEO Issues, Aggregate Crawl Data 2026
SEOmator — 2026 SEO Benchmarks Report
Connascent — Manufacturing SEO Guide 2026
Authority Specialist — Industrial SEO Benchmarks (44 manufacturers)
EdgeComet — How Googlebot Crawls, Renders & Indexes JavaScript
PageSpeed Matters — Mobile vs Desktop Speed Gap 2026


