



Table of contents

For industrial OEMs and manufacturers, lifecycle marketing is an aftermarket and installed-base question, not a customer-churn dashboard borrowed from software. Parts, service contracts and long-term agreements are where retention actually lives, and three independent 2025-2026 surveys — Syncron, Thomasnet/Xometry and NAM — put numbers on how big that motion already is and where it is headed.
Key Takeaways
- 95% of OEMs include parts in their aftermarket offering (Syncron, 2025, n=550).
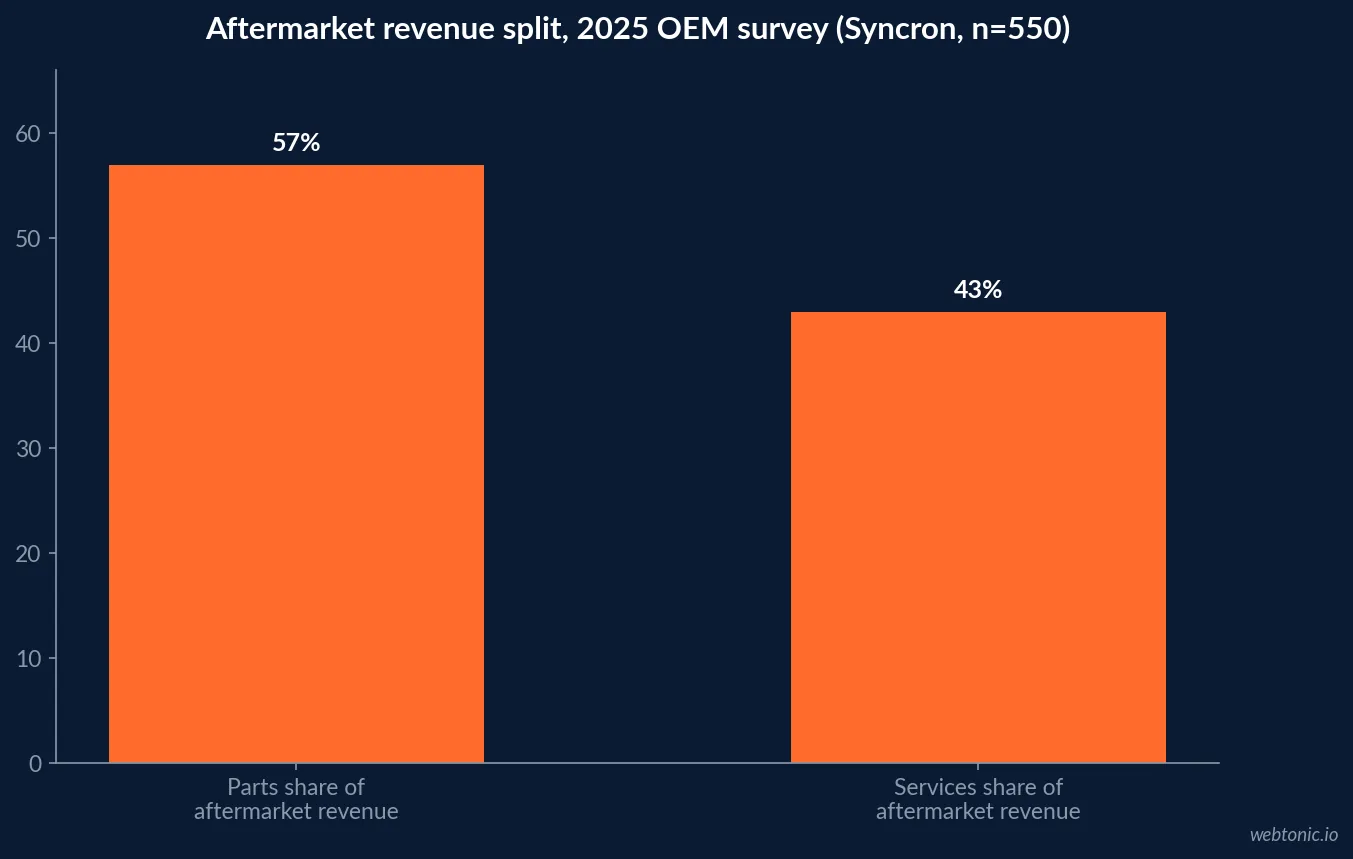
- Parts make up 57% of aftermarket revenue, services 43%, on the same survey.
- Most OEMs report 10-29% of total revenue from aftermarket today.
- That share is expected to climb to 30-49% within five years.
- Nearly a third of U.S. OEMs expect aftermarket to hit 50%+ of revenue within five years.
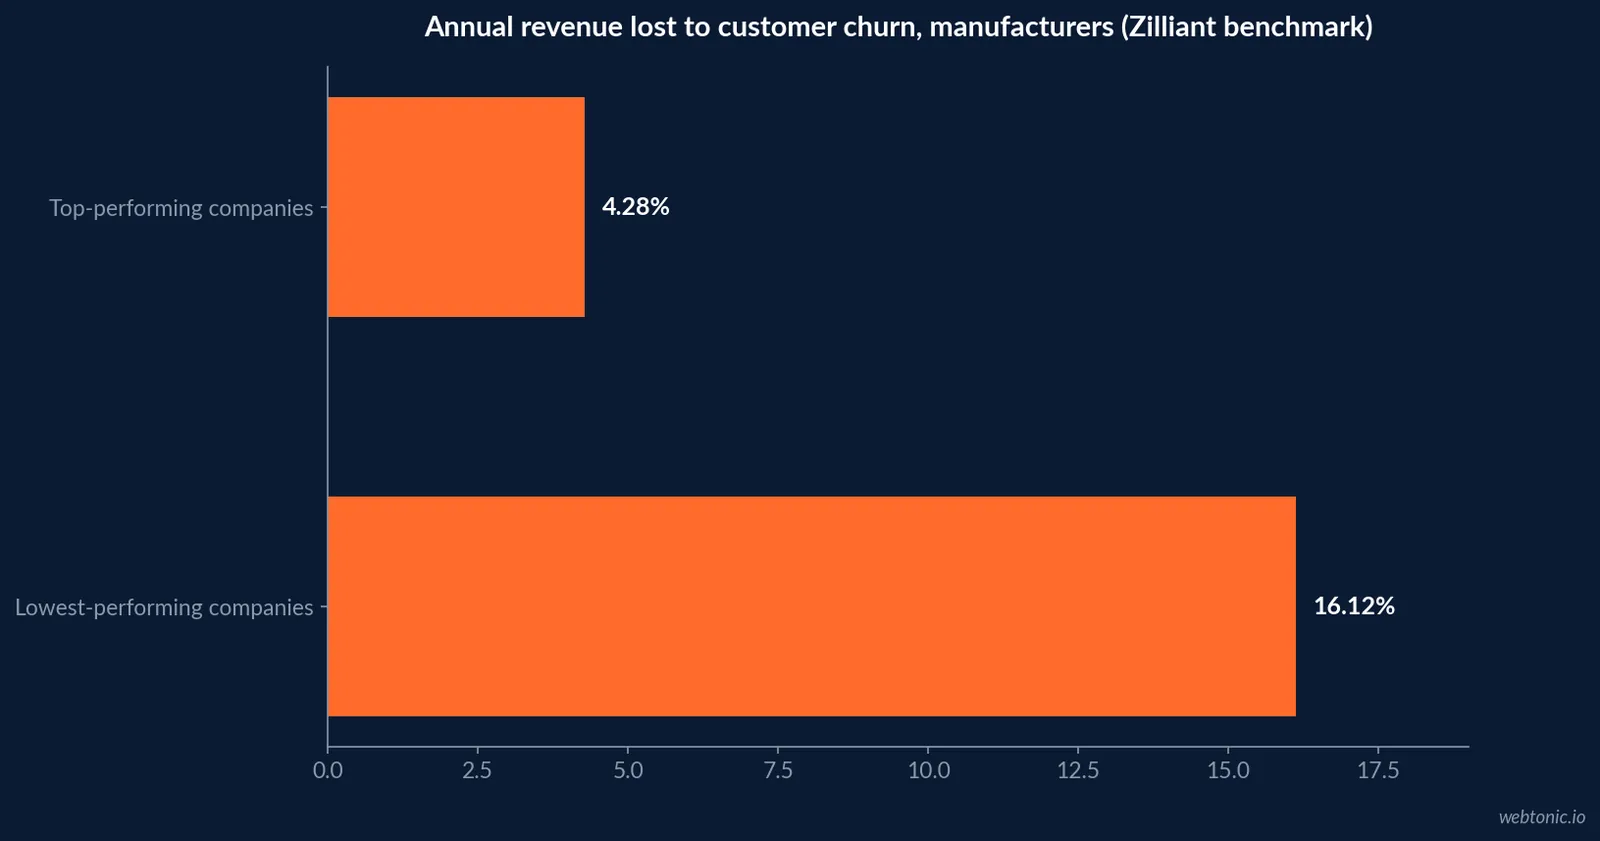
- Manufacturers lose 4.28% to 16.12% of annual revenue to customer churn (Zilliant, 2022 data).
- For a USD 1 billion company, that is USD 42.8M to USD 161.2M a year.
- 78.9% of manufacturers are positive about their own outlook in Q3 2026 (NAM, n=220).
- That is a four-year sentiment high, up 4.7 points from Q2 2026.
- Expected 12-month sales growth is 4.3%, production growth 3.8% (NAM Q3 2026).
- 78% of manufacturers raised prices in 2025 due to cost pressure (Thomasnet/Xometry, n=300).
- U.S. domestic sourcing grew 28% on Xometry data amid the same pricing pressure.
- Aftermarket services can carry roughly 25% gross margin against about 10% for new equipment.
- Leading OEMs sign 31% more customers to maintenance contracts at time of purchase than the industry average (BCG).
Benchmarks at a glance
| Metric | Figure | Source (year, sample) |
|---|---|---|
| OEMs including parts in aftermarket offering | 95% | Syncron (2025, n=550) |
| Aftermarket revenue split, parts vs. services | 57% / 43% | Syncron (2025, n=550) |
| Current aftermarket share of total OEM revenue | 10-29% (most common) | Syncron (2025, n=550) |
| Expected aftermarket share within 5 years | 30-49% | Syncron (2025, n=550) |
| Annual revenue lost to customer churn | 4.28%-16.12% | Zilliant (2022 benchmark data) |
| Manufacturers positive on own outlook, Q3 2026 | 78.9% | NAM (2026, n=220) |
Aftermarket is already the retention motion for industrial OEMs
Syncron's 2025 State of the Aftermarket report, based on 550 quantitative interviews plus 15 qualitative depth interviews with senior aftermarket decision-makers, found 95% of OEMs already include parts in their aftermarket offering, with parts contributing 57% of aftermarket revenue and services the remaining 43%. Most respondents currently report aftermarket at 10-29% of total company revenue, but expect that share to reach 30-49% within five years — and in the U.S. specifically, nearly a third of OEMs expect aftermarket to supply at least half of total revenue in that window, a materially more bullish expectation than DACH respondents (8%) hold for the same threshold.
What churn actually costs a manufacturer
The Zilliant Global B2B Benchmark Report: Manufacturing Edition (2022 data, still the most-cited public figure of its kind) measured Customer Churn at the product-category level — declining purchase volume plus competitor defection — and found manufacturers lose an average of 4.28% to 16.12% of annual revenue to it. For a USD 1 billion company, that is a swing of USD 42.8 million to USD 161.2 million a year, entirely separate from new-customer acquisition performance. That range is also the clearest argument for lifecycle marketing budget in this category: retention is not a soft metric here, it shows up directly in the P&L line the sales team is measured on.
| Churn performance tier | Annual revenue lost to churn | Note |
|---|---|---|
| Top-performing companies | 4.28% | Still a measurable, non-zero loss |
| Lowest-performing companies | 16.12% | Nearly 4x the top-tier loss rate |
| USD 1B company, top tier | ~USD 42.8M/year | Illustrative, from the same ratio |
| USD 1B company, bottom tier | ~USD 161.2M/year | Illustrative, from the same ratio |
Sector sentiment and the pricing pressure behind it
NAM's Q3 2026 Manufacturers' Outlook Survey (220 responses, fielded August 11-27, 2026) found 78.9% of manufacturers positive about their own company's outlook, up 4.7 points from Q2 2026 and the highest level since Q2 2022. Expected growth over the next 12 months: sales up 4.3%, production up 3.8%, and full-time employment up 1.8%. Raw material costs remain the top concern, cited by 80.8% of respondents. Against that backdrop, Thomasnet's 2026 Manufacturing Outlook — built on a Xometry/Zogby Strategies survey of 300 manufacturing executives across the US, UK and Europe (margin of error +/-5.7 points) — found 78% of U.S. manufacturers raised prices in 2025 to manage cost pressure, alongside 28% growth in U.S. domestic sourcing and a 63% increase in sourcing for U.S. aluminum suppliers on the Thomasnet platform since January 2025, alongside strategic shifts toward supply-chain diversification.
| Signal | Figure | Source |
|---|---|---|
| Positive on own company outlook, Q3 2026 | 78.9% | NAM (n=220) |
| Expected sales growth, next 12 months | 4.3% | NAM (n=220) |
| Manufacturers who raised prices in 2025 | 78% | Thomasnet/Xometry/Zogby (n=300) |
| Growth in U.S. domestic sourcing | 28% | Xometry data via Thomasnet |
What leading aftermarket programs do differently, in numbers
BCG's third services benchmark study, covering industrial machinery manufacturers, found companies that prioritize aftermarket services generate one-third or more of total income from those offerings, and for most companies services revenue growth now exceeds new-equipment sales growth — up 10% in 2023 with another 8% expected in 2024 at the time of the study. Leading companies also sign 31% more customers to maintenance contracts at the time of purchase than the industry average, and outperform on long-term service agreements by 11 percentage points and on repair/field services by 3 points. Companies that elevate services to a core competency capture a high-margin revenue share as much as 9 percentage points above the industry average, concentrated among manufacturers with direct buyer relationships rather than third-party distribution.
| BCG benchmark | Leading companies | Industry average | Gap |
|---|---|---|---|
| Maintenance contracts signed at time of sale | +31% more | Baseline | 31 pts |
| Long-term service agreement penetration | Above average | Baseline | +11 pts |
| Repair and field services penetration | Above average | Baseline | +3 pts |
| High-margin services share of revenue | Above average | Baseline | +9 pts |
How to size an aftermarket lifecycle marketing budget
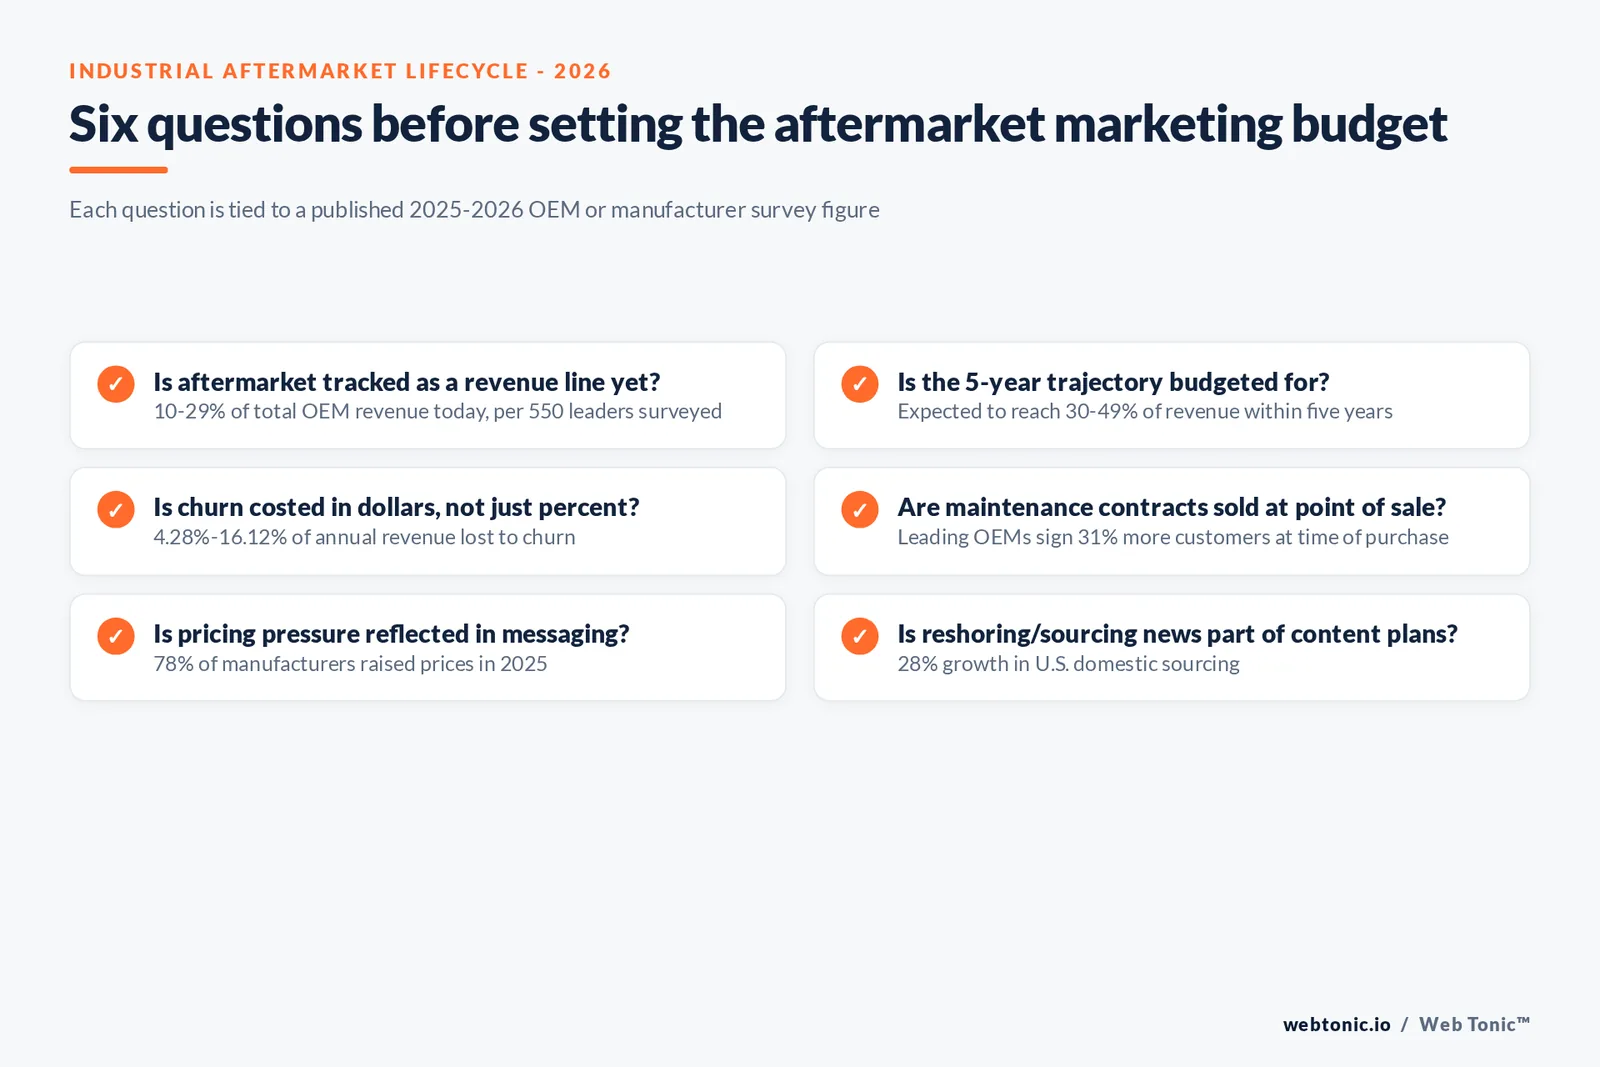
Put together, these figures give industrial marketers a defensible way to size retention-program budget without inventing a number: take the installed base's current aftermarket revenue share (10-29% today per Syncron), apply the churn-cost range (4.28%-16.12% of revenue) to see what is at risk without a program, and weigh that against the margin gap between services and new equipment. A retention program that moves even a fraction of accounts from the bottom churn tier toward the top tier is worth defending with real budget, not treated as a service-department line item.
Manufacturing vs. a generic B2B retention motion
| Dimension | Manufacturing / industrial | Generic B2B services |
|---|---|---|
| Primary retention lever | Aftermarket parts + service contracts | Renewal/subscription terms |
| Revenue already at stake | 10-29% of total revenue today, per Syncron | Varies by category |
| Measured churn cost | 4.28%-16.12% of annual revenue (Zilliant) | Rarely disclosed at this granularity |
| Near-term sector sentiment | 78.9% positive (NAM Q3 2026) | Varies by sector |
Where lifecycle marketing budget should point in this sector
- Treat aftermarket revenue share as a marketing KPI, not just an operations metric — it is already 10-29% of total revenue and rising toward 30-49% within five years per OEM leaders themselves.
- Model the churn-cost range (4.28%-16.12% of revenue) against your own installed base to size the retention-marketing budget in dollar terms, not percentage abstractions.
- Weight content and campaigns toward the reshoring/domestic-sourcing narrative while pricing pressure and tariff exposure remain top-cited concerns in both the NAM and Thomasnet surveys.
- Push maintenance-contract attach messaging to the point of equipment sale, where BCG's data shows leading companies already outperform the industry average.
- Report the parts-vs-services split (57%/43%) separately in dashboards; the two carry different margins and different marketing motions, one transactional and one relationship-based.
Common mistakes in industrial aftermarket marketing
- Reporting aftermarket as a single blended number, hiding whether growth is coming from parts, services, or both.
- Ignoring the churn-cost range entirely because it is described in percentages rather than dollars — the same Zilliant data translates directly into a revenue-at-risk figure for any installed base size.
- Treating positive sector sentiment (78.9%) as evidence that retention programs can wait — the same survey period shows raw material costs as the top challenge for over 80% of respondents.
Related benchmarks
For adjacent B2B retention and lifecycle data, see Web Tonic's customer retention statistics and customer lifetime value statistics pages, or the data intelligence service page for how installed-base revenue tracking gets built for an industrial marketing team.
Frequently Asked Questions
How much manufacturer revenue actually comes from aftermarket parts and service?
Syncron's 2025 State of the Aftermarket survey of 550 senior aftermarket decision-makers at OEMs found aftermarket parts and services already make up 95% of respondents' offering mix, with parts contributing 57% of aftermarket revenue and services 43%. Most OEMs currently report 10-29% of total company revenue comes from aftermarket; within five years, respondents expect that share to climb to 30-49%.
Is the U.S. manufacturing sector actually growing right now?
Yes, and sentiment is improving. NAM's Q3 2026 Manufacturers' Outlook Survey (220 responses, fielded August 11-27, 2026) found 78.9% of manufacturers positive about their own company's outlook, up 4.7 points from Q2 and the highest reading in four years. Expected sales growth over the next 12 months is 4.3%, production growth 3.8%, and full-time employment growth 1.8%.
What's driving the shift toward domestic sourcing right now?
Thomasnet's 2026 Manufacturing Outlook Report, based on a Xometry/Zogby Strategies survey of 300 manufacturing executives (margin of error +/-5.7 points), found 78% of U.S. manufacturers raised prices in 2025 due to cost pressure, alongside 28% growth in U.S. domestic sourcing and a 63% jump in sourcing for U.S. aluminum suppliers on the Thomasnet platform since January 2025 — a reshoring signal that correlates with, not necessarily causes, the sourcing shift.
How much revenue loss does customer churn actually cause manufacturers?
Zilliant's Global B2B Benchmark Report: Manufacturing Edition (2022 data, still the most cited public figure of its kind) found manufacturers lose an average of 4.28% to 16.12% of annual revenue to Customer Churn — declining product-category purchase volume and competitor defection, measured at the product category level. For a USD 1 billion company, that is a swing of USD 42.8 million to USD 161.2 million a year, which is why installed-base retention is treated as a pricing and marketing problem, not only a sales problem.
Do long-term service agreements really change retention outcomes?
Directionally, yes, per BCG's third services benchmark study: companies that prioritize aftermarket services generate one-third or more of total income from those offerings, and for most companies the growth rate of services now exceeds new-equipment sales growth. Service revenue carried gross margins of roughly 25% against about 10% for new equipment in an earlier McKinsey analysis of aftermarket economics, which is the margin gap that funds retention-focused service and parts marketing.
Sources
Syncron — The State of the Aftermarket 2025 (n=550)
Zilliant — Global B2B Benchmark Report: Manufacturing Edition (2022 data)
National Association of Manufacturers — Q3 2026 Manufacturers' Outlook Survey (n=220)
Thomasnet / Xometry / Zogby Strategies — 2026 Manufacturing Outlook Report (n=300)
BCG — Aftermarket Services Drive Growth for Industrial Manufacturers (2025)


