Table of contents
81% of US consumers made an impulse purchase so far in 2026, even as 53% say their budget is tighter than last year - and price plus reward-seeking, not idle boredom, drive most of it. A 1,000-consumer 2026 survey and Adobe's own shopper behavior research pin down what is actually triggering unplanned spending and where it happens.
Key Takeaways
- 81% of consumers made at least one impulse purchase so far in 2026.
- 53% say their overall budget is tighter than the year before.
- Consumers average 7 impulse buys per the surveyed period.
- The median spend per impulse buy is USD 50.
- That is roughly USD 350 in impulse spend in a single quarter.
- The single biggest impulse buy averaged USD 355 in 2026.
- Food is the top impulse category at 54%, just ahead of clothing.
- Clothing follows closely at 53% of impulse purchases.
- 64% of major online retailer visits produce impulse buys, the top venue.
- Nearly two-thirds cite price or a deal as their trigger.
- 64% cite feeling deserving of a treat or reward as a trigger.
- 62% regret their impulse purchases at least some of the time.
- 34% say impulse purchases cause them financial stress.
- 49% of Gen Z has impulse bought directly on social media.
- TikTok is the top social platform for impulse buys at 43%.
- Two-thirds of shoppers blame a coupon or discount for an unplanned buy.
The scale of the behavior in 2026
Impulse buying is not a fringe habit - it is close to a majority behavior even in a year most consumers describe as financially tighter. PartnerCentric's 2026 consumer survey, covering more than 1,000 US consumers evenly split across Gen Z, Millennials, Gen X and Boomers, found 81% had made at least one impulse purchase so far this year. That happened despite 53% reporting a tighter overall budget than the prior year, with Gen X and Boomers leading the belt-tightening at 57% and 56% respectively.
The frequency is not occasional either: the average consumer reported 7 impulse buys at a median spend of USD 50 each, which works out to roughly USD 350 in impulse spending over a single quarter, plus an average of USD 355 spent on that year's single largest impulse purchase.
What people actually buy on impulse
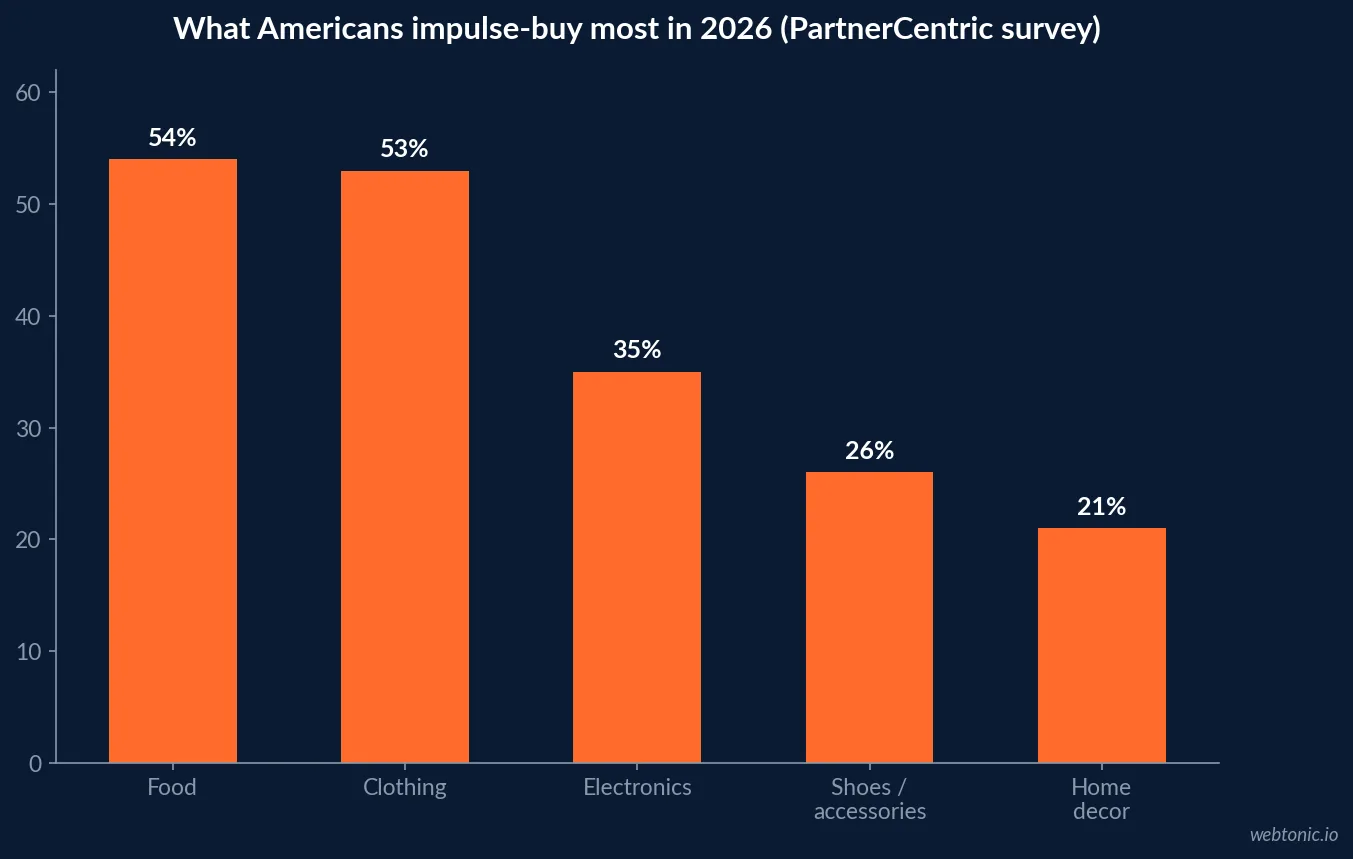
Food leads every category at 54%, narrowly ahead of clothing at 53%, then electronics (35%), shoes and accessories (26%) and home decor (21%). The split runs along gender lines: women skew toward clothing, food and beauty products, while men skew toward electronics, food and clothing - and electronics barely register for women in the same dataset.
Debit cards are the most common payment method for these purchases at 56%, ahead of credit cards at 54% and cash at 31%, which suggests most impulse spend is coming out of available cash flow rather than being financed.
| Impulse purchase category | Share of consumers | Where it ranks |
|---|---|---|
| Food | 54% | 1st |
| Clothing | 53% | 2nd |
| Electronics | 35% | 3rd |
| Shoes / accessories | 26% | 4th |
| Home decor | 21% | 5th |
What actually triggers the purchase
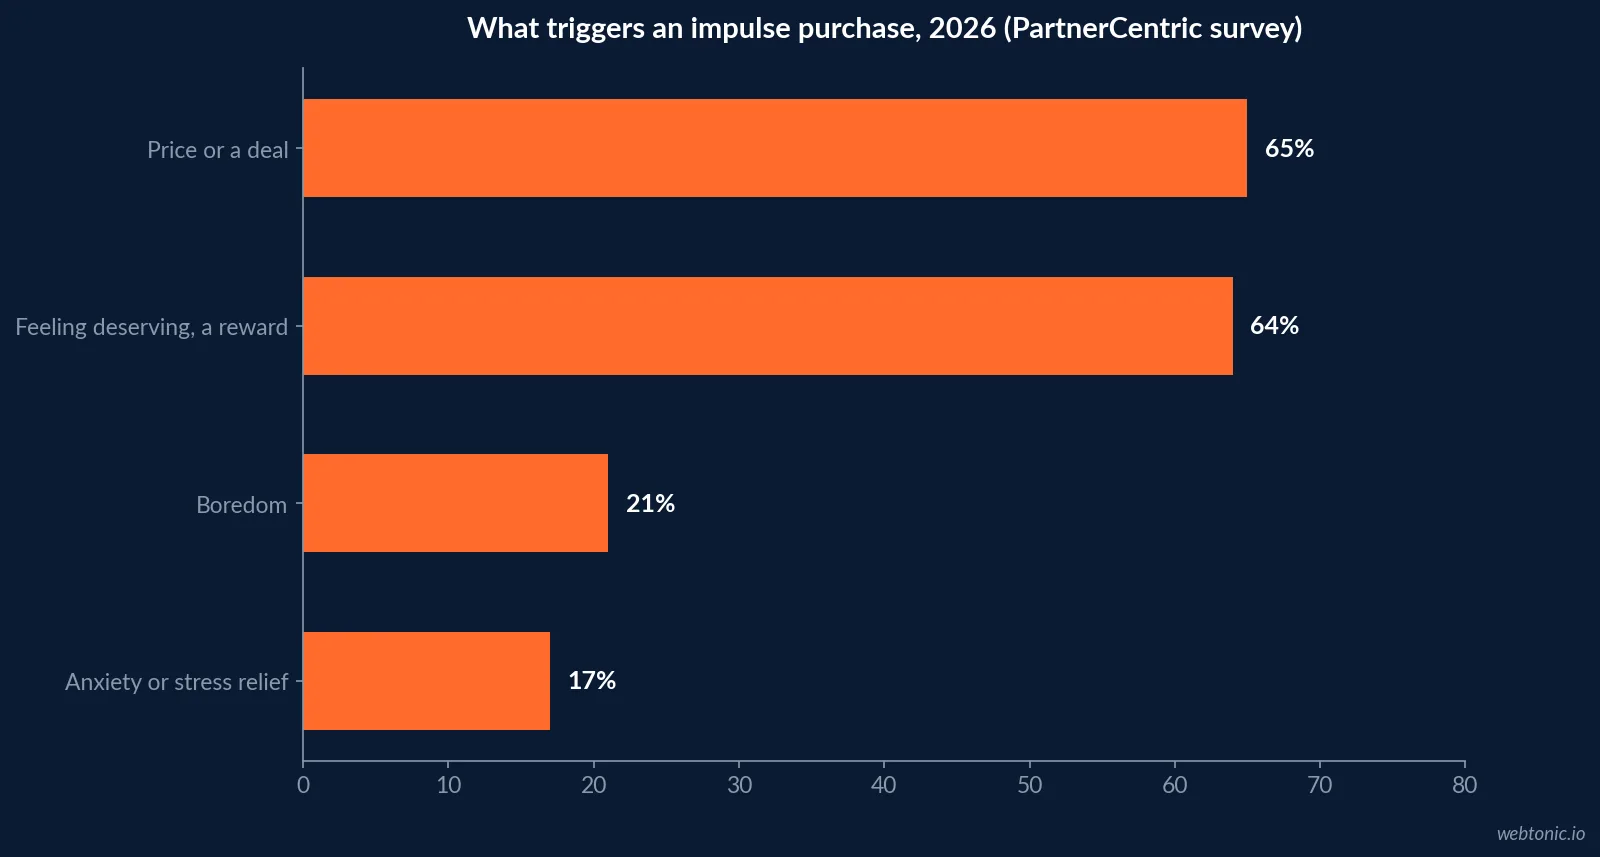
The trigger data splits almost evenly between rational and emotional drivers. Close to two-thirds of consumers cite price or a deal, and a nearly identical 64% cite feeling deserving of a treat or reward - meaning a large share of buyers report both a rational and an emotional reason at once. Boredom accounts for 21%, and roughly 1 in 6 cite anxiety or stress relief specifically. Over a third of respondents say their emotional state overall is the single most likely trigger.
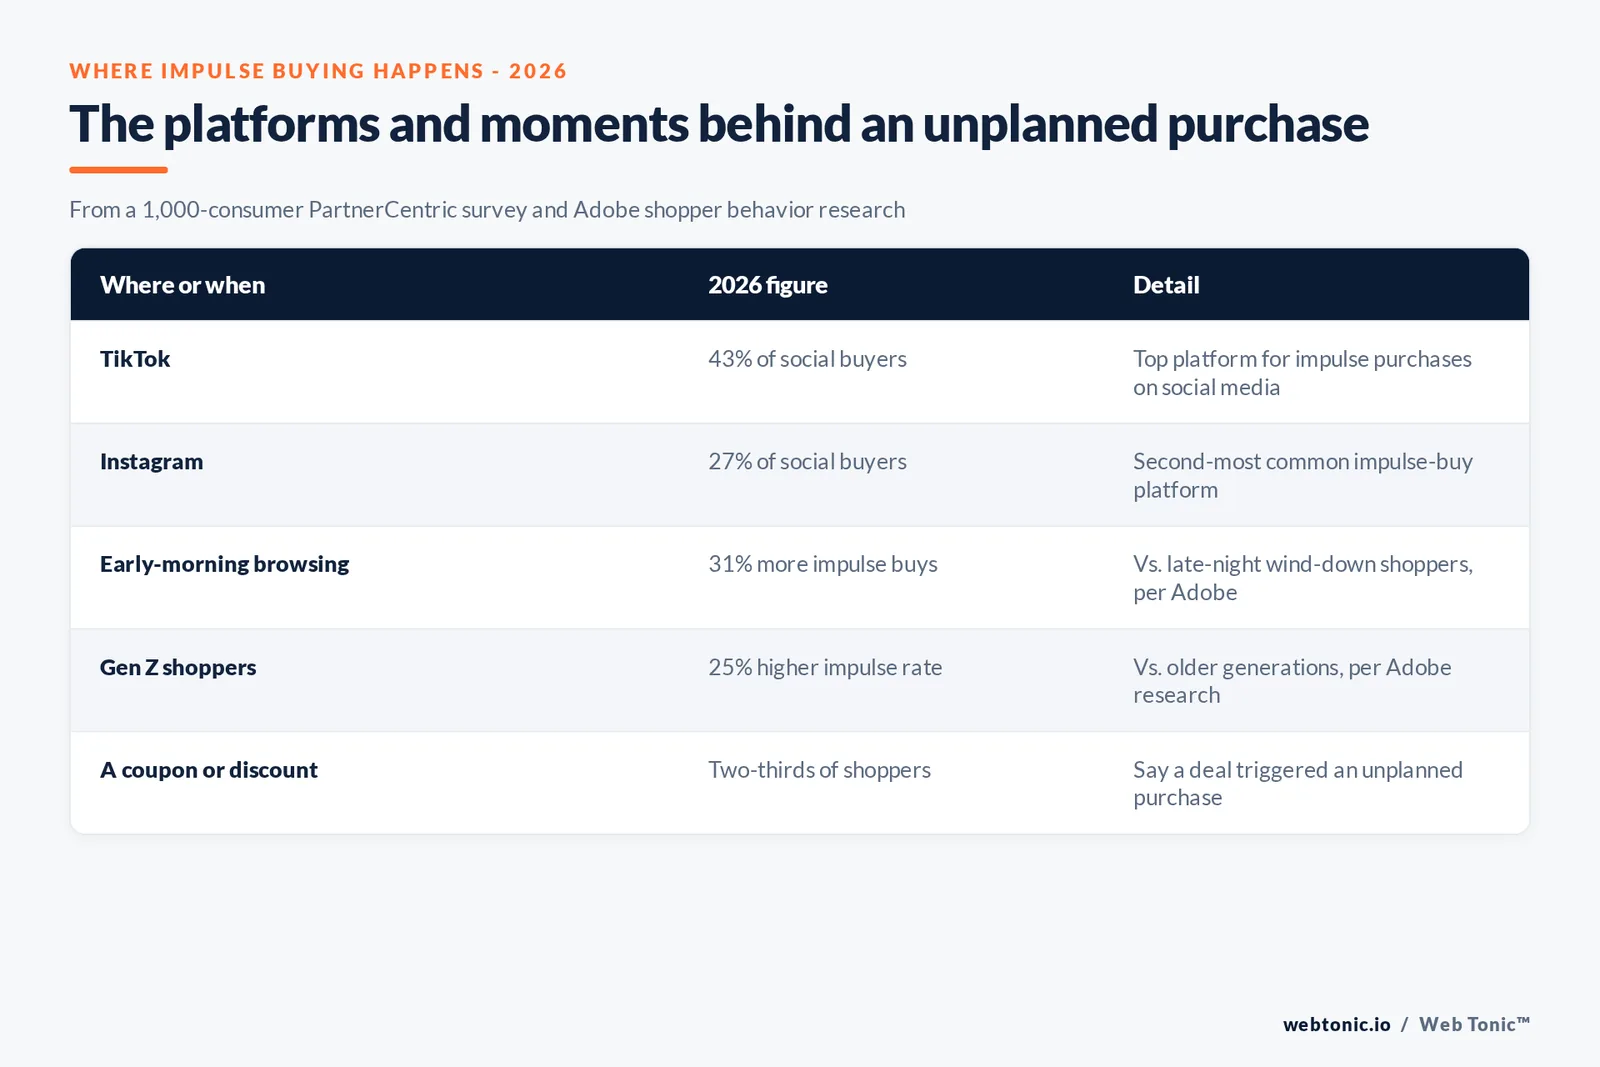
Adobe's own e-commerce research adds a mechanism behind the "price or deal" trigger: two- thirds of consumers report making an unplanned purchase specifically because of a coupon or discount, according to Adobe for Business's guide to product recommendations.
Where and when it happens
Major e-commerce sites are the leading venue for impulse purchases at 64%, well ahead of big-box stores like Walmart or Target (36%), grocery stores (34%), purchases made while on vacation (22%) and small shops (22%). Timing matters too: Adobe's shopper behavior research, based on a survey of over 1,000 US consumers, found early-morning shoppers are 31% more likely to impulse buy than late-night, wind-down shoppers, and that Gen Z shows a 25% higher impulse-buying frequency than older generations.
Social media has its own separate impulse-buying layer. 22% of all consumers surveyed by PartnerCentric have made an impulse purchase on social media, but among Gen Z that figure jumps to 49%, versus roughly 1 in 6 for Millennials and Gen X. TikTok leads the platforms at 43%, ahead of Instagram (27%) and Facebook Marketplace (15%).
| Venue or moment | Share reporting impulse buys there | Source |
|---|---|---|
| Major e-commerce sites | 64% | PartnerCentric 2026 survey |
| Big-box stores (Walmart, Target, etc.) | 36% | PartnerCentric 2026 survey |
| Grocery stores | 34% | PartnerCentric 2026 survey |
| Social media overall (all consumers) | 22% | PartnerCentric 2026 survey |
| Social media, Gen Z specifically | 49% | PartnerCentric 2026 survey |
The cost of an impulse buy is more than the receipt
A majority of consumers feel some downside after the fact. PartnerCentric's survey found 62% regret their impulse purchases at least some of the time, and 34% say impulse purchases actively cause them financial stress. That sits alongside a more supportive framing in Capgemini's Today's Consumer 2026 report, which found seven in ten consumers say small indulgences help manage financial stress rather than add to it - suggesting the same behavior reads as either relief or regret depending on how and what is bought.
Capgemini's data also shows the behavior is not accelerating unchecked: 54% of consumers say they are making fewer impulse purchases than a year ago, down from 71% reporting the same restraint the year before - a modest swing back toward spending after a period of tighter self-control.
| Consumer sentiment about impulse buying, 2026 | Figure | Source |
|---|---|---|
| Regret impulse purchases at least sometimes | 62% | PartnerCentric 2026 survey |
| Say impulse purchases cause financial stress | 34% | PartnerCentric 2026 survey |
| Say small indulgences ease financial stress | 70% | Capgemini Today's Consumer 2026 |
| Making fewer impulse purchases than last year | 54% | Capgemini Today's Consumer 2026 |
| Said the same restraint the year before | 71% | Capgemini Today's Consumer 2026 |
How consumers pay for what they didn't plan to buy
Payment method data hints at how these purchases are actually being financed. PartnerCentric's survey found debit cards lead at 56%, ahead of credit cards at 54% and cash at 31% - respondents could select more than one method, which is why the totals exceed 100%. Only 17% of respondents described their impulse purchases as typically large, consistent with a median spend of USD 50 that keeps most of this spending inside a normal weekly cash flow rather than requiring financing.
Planned, nonessential purchases tell a different financial story. The same survey found consumers reported spending roughly USD 1,200 on planned nonessential purchases in the first quarter of 2026 alone - several times the roughly USD 350 in impulse spend over the same window, a reminder that impulse buying, while frequent, is not the largest nonessential spend category even for the same consumers.
| Payment method for impulse purchases | Share using it | Note |
|---|---|---|
| Debit card | 56% | Most common method |
| Credit card | 54% | Near-tied for most common |
| Cash | 31% | Third most common |
| Large impulse purchases (self-described) | 17% | Most impulse buys are small |
| Q1 2026 planned nonessential spend | ~USD 1,200 | Several times impulse spend in the same period |
Where shoppers say they prefer to buy, planned or not
Despite e-commerce leading specifically for impulse purchases, PartnerCentric's broader survey found consumers still say they prefer shopping in person to online shopping overall, at 57% to 43%. For planned, nonessential purchases specifically, major e-commerce sites still lead at 75% of voter share, followed by in-person retail stores at 67%, big-box stores at 43%, a specific brand's own site at 25%, and small shops at 17%.
The gap between stated preference (in person) and reported impulse behavior (mostly online) is worth noting for anyone building a channel strategy: the venue people say they prefer is not necessarily the venue where their unplanned spending actually concentrates.
What the wider economic mood adds to the picture
Capgemini's 2026 research also frames impulse restraint inside a broader "smart downshifting" pattern: around 49% of consumers report buying smaller quantities to manage rising prices, and a similar 48% say they are substituting cheaper alternatives, such as private-label goods, rather than cutting a category out entirely. That context matters for impulse-purchase forecasting - the same shopper making fewer big-ticket impulse buys may still be an active impulse buyer at a lower price point, which is closer to what PartnerCentric's USD 50 median spend actually shows.
Trust in the channel also plays a role in willingness to buy on impulse at all: Capgemini found two in three consumers believe e-commerce offers fair prices, roughly matching the trust level reported for thrift and discount store formats - one likely reason major online retailers remain the leading venue for impulse purchases in PartnerCentric's data as well. A separate Clever Real Estate survey of 1,000 Americans puts a floor under how large this spending can get: 22% of Americans - nearly 1 in 4 - say they have spent USD 1,000 or more on a single impulse purchase, and self-described overspenders skew heavily younger, with 49% of Gen Z and 39% of Millennials identifying as overspenders against just 12% of Boomers.
What this means for merchandising and campaign timing
The data points to three concrete levers: price-anchored offers still convert the largest single trigger group, morning and early-day placements outperform late-night pushes for impulse-prone categories, and TikTok-first creative reaches the Gen Z segment that impulse buys on social media at roughly three times the rate of older cohorts. None of that argues for chasing volume alone - with regret running at 62%, offers that feel like a deal rather than pressure tend to hold up better after the sale.
If impulse-driven categories are a meaningful share of revenue, our growth marketing practice builds the paid social and lifecycle sequencing this data points toward, our team can review your own merchandising calendar against this data, and our guide to what search advertising costs is a useful comparison when deciding how much budget to shift toward the impulse-heavy channels above.
Frequently Asked Questions
How common is impulse buying in 2026?
Very common, even with budgets tighter than a year ago. PartnerCentric's 2026 survey of over 1,000 US consumers found 81% made at least one impulse purchase so far this year, averaging 7 impulse buys at a median spend of USD 50 each - about USD 350 in a single quarter - even as 53% said their overall budget is tighter than the year before.
What triggers most impulse purchases?
Price and emotion, roughly evenly. PartnerCentric's survey found close to two-thirds of consumers cite price or a deal as a trigger, and 64% cite feeling deserving of a treat or reward. Smaller but still notable shares point to boredom (21%) and anxiety or stress relief (about 1 in 6), with over a third saying their emotional state is the single most likely trigger overall.
Where do most impulse purchases happen?
Major e-commerce sites lead by a wide margin. PartnerCentric's survey puts large online retailers at 64% for impulse purchases specifically, ahead of big-box stores (36%), grocery stores (34%), purchases made while on vacation (22%) and small shops (22%). On social media specifically, TikTok is the top platform at 43%, ahead of Instagram at 27%.
Does a coupon or discount actually cause unplanned purchases?
Adobe's own e-commerce research says yes for a large share of shoppers: two-thirds of consumers report making an unplanned purchase because of a coupon or discount, according to Adobe for Business. Adobe's broader shopper behavior study also found early-morning browsers are 31% more likely to impulse buy than late-night, wind-down shoppers.
Which generation impulse buys the most?
Gen Z, on both counts available. Adobe's shopper research found Gen Z shows a 25% higher impulse buying frequency than older generations, and PartnerCentric's survey found 49% of Gen Z respondents have made an impulse purchase directly on social media, versus roughly 1 in 6 Millennials and Gen Xers who say the same.
Sources
PartnerCentric - Planned and Impulse Buying Statistics 2026
Adobe for Business - Ecommerce Analytics That Reveal Why People Buy
Adobe for Business - A Guide to Product Recommendations
Capgemini - Today's Consumer 2026
Retail Brew - Consumers Are Still Making Impulse Purchases, and Then Regretting Them
Clever Real Estate - American Spending Habits: 2026 Edition