



Table of contents
Across 104 audited HVAC contractor websites the mean mobile Largest Contentful Paint is 8.35 seconds — more than 3x Google's 2.5-second threshold — while 45.3% of local business sites carry no structured data at all. Technical SEO is where heating and cooling companies lose rankings they already earned. Here is the 2026 data.
Key Takeaways
- Mean mobile LCP across 104 HVAC sites is 8.35s; the trade scored 65.32/100 overall.
- Only 42% of web origins pass all three Core Web Vitals; LCP passes at 58%, INP at 65%, CLS at 74%.
- 43% of sites still fail the 200ms INP threshold, and 35% that passed FID now fail INP.
- About 42% of JavaScript-rendered content never gets indexed; render-queue loss on JS-heavy sites is a median ~80%.
- 45.3% of 16,673 audited local sites have zero schema; only 31.6% use LocalBusiness, 12.5% FAQPage.
- Schema-valid pages are cited roughly 3.1x more often in AI Overviews; JSON-LD is ~70% of implementations.
- 23% of the top 10,000 sites block an AI crawler, but commercial categories sit near 4%.
- 73.3% of sampled HVAC sites carry broken links and 26.7% have no sitemap.
- GBP signals carry ~32% of local pack weight versus 19% on-page — technical work is the tiebreaker, not the whole game.
1. The Trade's Technical Baseline
The most useful dataset for heating and cooling operators is not a global average but a trade-specific audit. Fervor Studio inspected 104 HVAC contractor websites in May 2026 using Lighthouse and axe-core, and the results describe a phone-first trade with a rendering problem.
| Audit metric | 2026 figure | Reading |
|---|---|---|
| Sites inspected | 104 HVAC brands | US and Canada |
| Mean overall score | 65.32 / 100 (median 65) | D on a school scale |
| Mean mobile LCP | 8.35 seconds | 3.3x the 2.5s threshold |
| Clickable header phone number | 74% of brands | Strongest adoption of any signal |
| Real online scheduling tool | 56.7% | 43% still require a daytime call |
| Content and SEO category score | 8.79 / 15 | Second-weakest category |
| Accessibility category score | 3.5 / 8 | Weakest category measured |
The pattern matters more than any single number. The conversion basics are largely in place — three in four sites put a tappable phone number in a persistent header — but the pages carrying those numbers take over eight seconds to paint on a phone. A separate 15-site diagnostic sample found broken links on 73.3% of HVAC sites and no sitemap on 26.7%, which is the unglamorous half of technical SEO that never appears in a proposal.
2. Core Web Vitals: Where Sites Actually Fail
Aggregated Chrome UX Report and HTTP Archive data shows the failure is concentrated in loading, not layout.
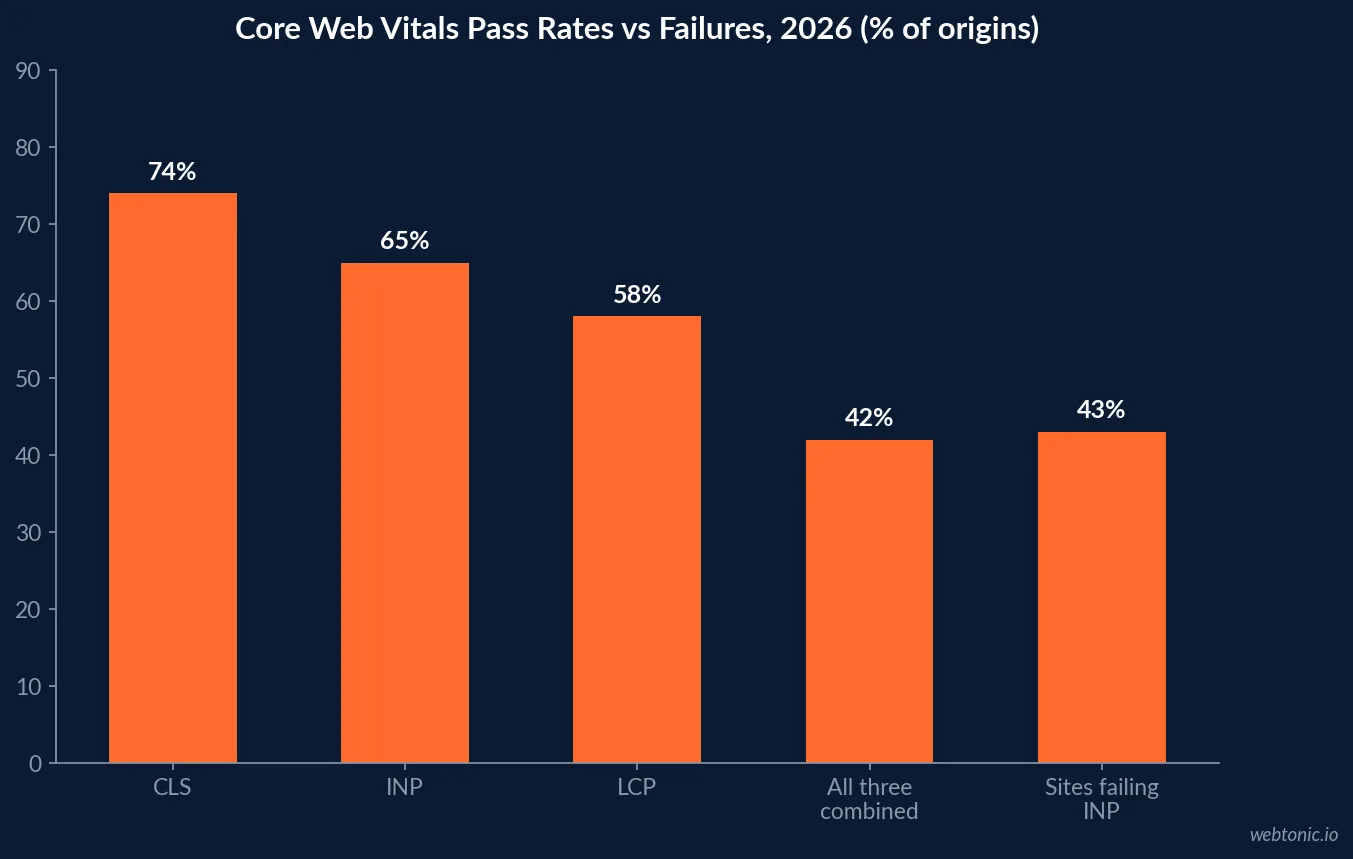
| Metric | Pass rate | Threshold |
|---|---|---|
| CLS (Cumulative Layout Shift) | 74% | 0.1 |
| INP (Interaction to Next Paint) | 65% | 200ms |
| LCP (Largest Contentful Paint) | 58% | 2.5s |
| All three combined | 42% | 75th percentile field data |
| Sites failing INP outright | 43% | Hardest vital to pass |
| Passed FID but now fail INP | 35% | Post-March-2024 shift |
| Median mobile LCP (open web) | 3.8s | Desktop median 2.1s |
INP-specific analysis explains why contractor sites are exposed: INP measures every tap across a session, not just the first. A site loaded with a chat bubble, a scheduling iframe, a review slider and two tracking containers will pass a synthetic Lighthouse run and still fail field INP the moment a homeowner taps "Book now". Google now evaluates Core Web Vitals at origin level as well as page level, so one bloated template drags the whole domain.
3. What Speed Is Worth in Booked Jobs
Speed only matters commercially because of what it does to lead volume. The published elasticities are unusually consistent.
| Speed finding | Figure | Source basis |
|---|---|---|
| Conversion drop per extra second | ~7% | Portent / Cloudflare 2026 |
| Mobile visitors abandoning after 3s | 53% | Think with Google |
| Bounce increase at 5 seconds | +90% vs 1s baseline | Google / SOASTA |
| Median load time of Google top-10 pages | 1.65s | Backlinko 2026 |
| Organic traffic advantage under 2s | +27% vs over 4s | Semrush site audits |
| Sites passing all three CWV: bounce | 24% lower | Google / Deloitte |
| LCP improved 4s to 2s | +15% conversion rate | web.dev case data |
Applied to the trade's own numbers, the arithmetic is brutal. A site at 8.35 seconds is roughly six seconds behind the top-ten median, and contractor-specific speed analysis puts the slow tail of the trade near 9.5 seconds on a phone. Emergency demand is where that costs the most, because the homeowner searching at 9pm has three tabs open and no patience — a dynamic we quantify in our HVAC landing page statistics.
4. Rendering and Crawl Budget
Most modern contractor sites inject the parts that rank. Onely's study of roughly 6,000 sites and render-queue analysis both point at the same failure mode.
| Rendering finding | Figure | HVAC translation |
|---|---|---|
| JS-rendered content never indexed | ~42% | Injected service copy can vanish |
| Client-side rendered ranking gap | ~67% lower on average | Widget-first builds underperform |
| Median crawl budget lost to render queue | ~80% (range 50-90%) | Fewer city pages get seen |
| Static-first sites losing budget | Under 20% | SSG or SSR is the fix |
| Render-queue bottleneck signal | >30% of crawls needing rendering | Check GSC crawl stats |
| Typical symptom | "Discovered – currently not indexed" | New pages stall for weeks |
| Average page weight | 2.3 MB, images 48% | Hero media is the usual culprit |
The rule of thumb for a heating and cooling site is that anything a search engine or an assistant must know — service names, city names, price framing, phone number, review count — belongs in the server-rendered HTML. Booking calendars, chat and tracking can hydrate afterwards. That single architectural decision is worth more than any keyword exercise, and it is the reason platform choice matters; see our HVAC WordPress statistics for the CMS-level trade-offs.
5. The Structured Data Gap
An audit of 16,673 local business websites quantifies how much of the trade is invisible to rich results and AI answer engines.
| Schema finding | Share of sites | Consequence |
|---|---|---|
| No structured data at all | 45.3% | Plain blue link only |
| Using LocalBusiness schema | 31.6% | The type that drives local rich results |
| Using FAQPage schema | 12.5% | Unclaimed SERP real estate |
| WebSite schema (most common) | 69.8% of schema users | Generic, low leverage |
| Trade businesses with any schema | 62.2% | Ahead of most local categories |
| JSON-LD share of implementations | ~70% | The format to standardise on |
| AI Overview citation lift, valid schema | ~3.1x | Markup is now an AI play |
For an HVAC company the high-leverage set is small and well defined: LocalBusiness (or HVACBusiness) with real geo coordinates and opening hours, Service for each core job type, FAQPage on service pages, BreadcrumbList for architecture, and AggregateRating only where reviews are genuinely on-page. Everything else is noise. Because AI assistants lean on entity clarity, the same markup that earns stars also improves the odds of being named, a topic we cover in our HVAC SEO statistics.
6. AI Crawlers, robots.txt and llms.txt
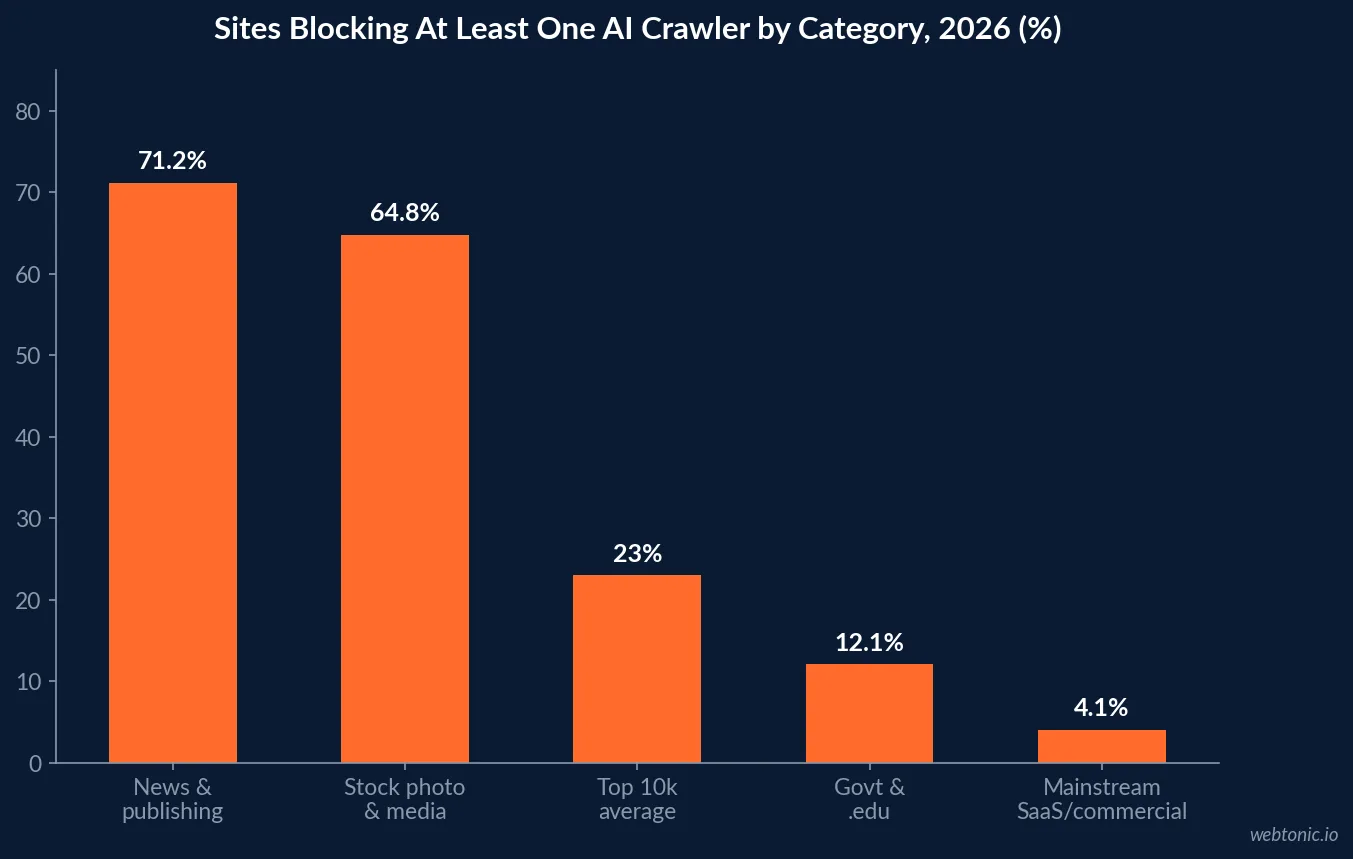
A May 2026 survey of the top 10,000 sites shows AI-crawler policy has become a real technical decision — and one most contractors are making by accident.
| AI crawler metric | 2026 figure | What it means for contractors |
|---|---|---|
| Top-10k sites blocking ≥1 AI bot | 23% (up from 11%) | Policy is tightening upstream |
| Blocking all four major bots | 6% | Mostly publishers |
| News and publishing block rate | 71.2% | Content-licensing dispute |
| Mainstream commercial block rate | 4.1% | The right peer group |
| GPTBot disallow rate | 18.4% | Most-blocked single bot |
| Sites with no explicit AI policy | 77% | Default rules decide for you |
| Citation loss after blocking | 30-60% within 90 days | Blocking has a visible cost |
The practical checklist is short: confirm your robots.txt does not inherit a blanket disallow from a template or a security plugin, allow the retrieval-oriented bots explicitly, keep an XML sitemap current, and publish clean plain-HTML service and city pages that an assistant can quote. An optional llms.txt summary file costs nothing and gives a machine reader an unambiguous map of your services and service area.
7. City Pages and Indexation at Scale
Every growing HVAC company eventually ships thirty city pages. Multi-location SEO research explains why most of them never rank.
| Scale factor | Data point | Rule to apply |
|---|---|---|
| Unique content needed per location page | 30-50% | Templated swaps get filtered |
| Typical failure state | "Crawled – currently not indexed" | Duplicate detection, not penalty |
| GBP share of local pack weight | ~32% | Profile work outranks page count |
| On-page share of local pack weight | 19% | Still the second-largest factor |
| Review signals | 16% | Velocity and diversity matter |
| Link signals | 15% | Local links, not volume |
| High performers with a local strategy | 94% vs 60% average | Process beats tooling |
The defensible pattern is to publish the smallest number of location pages you can genuinely differentiate — real technicians, real jobs, real municipal detail such as permit rules or common system types in that housing stock — and to interlink them through a service hub rather than a footer dump. Authority still has to reach those pages, which is where our HVAC link building statistics fit into the same architecture.
8. Mobile-First Realities for Emergency Demand
Technical SEO for this trade is mobile SEO. Contractor audit data and mobile-indexing statistics converge on the same operational point.
| Mobile factor | Figure | Implication |
|---|---|---|
| Mobile share of web traffic | 63.4% | Mobile is the indexed version |
| Mobile share of HVAC emergency queries | 60-70%+ | Higher than category average |
| Mobile bounce rate | 51% vs 41% desktop | Speed explains most of the gap |
| Mobile-first indexing coverage | 100% of sites | Since July 2024 |
| Ranking loss without viewport meta | ~34% of mobile rankings | Trivial fix, real cost |
| Touch targets under 48px | Flagged on 23% of sites | Top mobile usability error |
| Local service page conversion range | 3-8% | Quality and speed dependent |
The highest-return mobile work in this trade is not redesign. It is compressing the hero image, deferring the video, moving the booking widget below the fold, and making sure the tap target for the phone number is large, fixed and instant. Those four changes routinely move field LCP by seconds and cost a fraction of a new site.
9. A Prioritised Technical Fix List
Ordered by measured impact against the trade baseline rather than by audit-tool severity.
- Fix the hero. Uncompressed imagery and background video explain most of the 8.35s mean mobile LCP.
- Server-render the ranking content. Roughly 42% of JS-injected content never gets indexed.
- Audit INP after third-party scripts. 43% of sites still fail the 200ms threshold.
- Ship LocalBusiness, Service and FAQPage JSON-LD. 45.3% of local sites still have none.
- Check robots.txt for accidental AI blocking. 77% of sites have no explicit policy.
- Repair broken links and publish a sitemap. Present on 73.3% and missing on 26.7% of sampled HVAC sites.
- Differentiate city pages by 30-50% or delete them.
- Fix viewport and touch targets. Worth up to 34% of mobile visibility.
Sequence matters: rendering and speed first, because they gate everything downstream; then structured data, because it multiplies the visibility of pages that already work; then architecture at scale. Teams that invert that order end up with beautifully marked-up pages nobody can load. Our data intelligence practice instruments each step so the change shows up in field data, not just in a Lighthouse screenshot.
10. The Bottom Line
HVAC technical SEO in 2026 is not an abstract hygiene exercise. The trade's own audit numbers — 65.32/100 mean score, 8.35s mobile LCP, 3.5/8 accessibility, broken links on 73.3% of sampled sites — describe a market where the technical layer is the differentiator, because content and ad spend have already been commoditised. The contractors who fix rendering, speed, markup and indexation are not buying a marginal ranking bump; they are making every dollar already spent on content, ads and reviews actually land. If you want that work scoped and measured against these benchmarks, talk to our team.
Frequently Asked Questions
How slow are HVAC contractor websites in 2026?
Slower than almost any other measured trade. A 2026 inspection of 104 HVAC contractor websites found a mean mobile Largest Contentful Paint of 8.35 seconds against Google's 2.5-second "good" threshold, driven mainly by uncompressed hero photography and background video. For context, the median mobile LCP across the open web is about 3.8 seconds and the median load time of pages ranking in Google's top ten is roughly 1.65 seconds. The same audit scored the trade at 65.32 out of 100 overall, with Content and SEO the second-weakest category at 8.79 out of 15.
Which Core Web Vital do contractor sites fail most often?
LCP first, INP second. Across the open web only about 58% of origins pass LCP versus 65% for INP and 74% for CLS, and roughly 42% pass all three together. Interaction to Next Paint is the metric that broke the most sites when it replaced First Input Delay in March 2024 — about 35% of sites that previously passed FID now fail INP, and roughly 43% of sites still miss the 200-millisecond threshold. For HVAC sites the practical culprits are chat widgets, booking scripts and review carousels that all execute on first tap.
Do JavaScript booking widgets hurt HVAC SEO?
They can, and the damage is invisible in a browser. An Onely study of roughly 6,000 websites found that about 42% of JavaScript-rendered content never gets indexed, and client-side rendered pages rank materially lower than server-rendered equivalents. Render-queue analysis puts crawl-budget loss on JavaScript-heavy sites at a median near 80%, versus under 20% for static-first builds. The fix is not removing the widget; it is making sure service copy, city names, phone numbers and review snippets exist in the initial HTML rather than being injected after load.
How much does schema markup matter for an HVAC site?
It is the cheapest unclaimed advantage in the trade. An audit of 16,673 local business websites found 45.3% carry no structured data at all, only 31.6% use LocalBusiness schema and just 12.5% publish FAQPage markup — while trade businesses as a category sit at 62.2% schema adoption, ahead of most local verticals. Rich results attract materially more clicks than plain blue links, and schema-valid pages are cited around 3.1x more often in AI Overviews, which makes markup a search and an AI-visibility play at the same time.
Should an HVAC company block AI crawlers?
Almost never. As of May 2026 roughly 23% of the top 10,000 sites block at least one major AI crawler and 6% block all four, but the blocking is concentrated in news, publishing and stock media — 71.2% and 64.8% respectively — while mainstream commercial sites sit near 4%. A contractor's economic interest runs the opposite way: being quoted when someone asks an assistant who to call for a failed furnace is free distribution. The defensible position is to allow the retrieval bots, keep robots.txt explicit rather than accidental, and make the site machine-readable.
Sources
Fervor Studio — Digital State of the HVAC Industry 2026 (104 sites)
Searchlab — Technical SEO Statistics 2026
theStacc — Core Web Vitals Statistics 2026
PageSpeed Matters — Core Web Vitals Pass Rates
Onely — SEO for Dynamic Content and Dynamic Sites
Prerender — Crawl-Budget Loss on JavaScript Sites
Atlantis Digital — Local SEO Schema Markup Gap 2026
CrawlMind — AI Crawler Policy Survey 2026
BizIQ — Multi-Location SEO Statistics 2026
Borah Labs — HVAC Website Benchmarks
Authority Specialist — HVAC SEO Benchmarks 2026
Full Stack HVAC — The Nine-Second Problem


