



Table of contents

No study benchmarks TV advertising for heating and cooling contractors, so the useful HVAC question is narrower: how is the TV audience and the TV ad budget now split between linear and streaming? This page answers it with named 2025-2026 data and labels every cross-industry figure as such.
Key Takeaways
- Streaming held 49.0% of US TV time in July 2026; broadcast 19.5%, cable 18.7% (Nielsen).
- Streaming reached 48.2% of ad-supported TV in Q2 2026.
- Among adults 18+, streaming drops to 44.4% of ad-supported viewing.
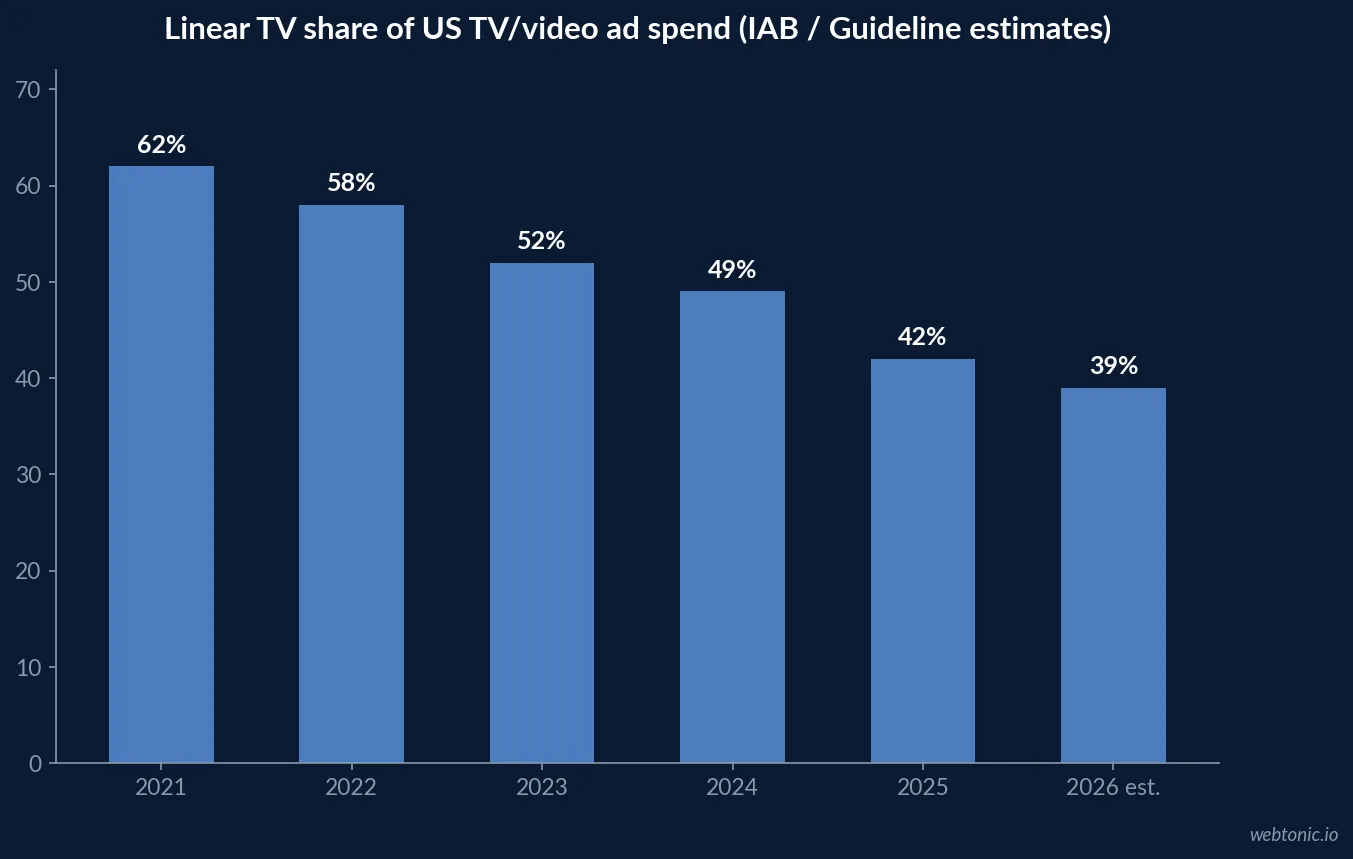
- Linear TV is estimated at 39% of US TV/video ad spend in 2026, down from 62% in 2021 (IAB).
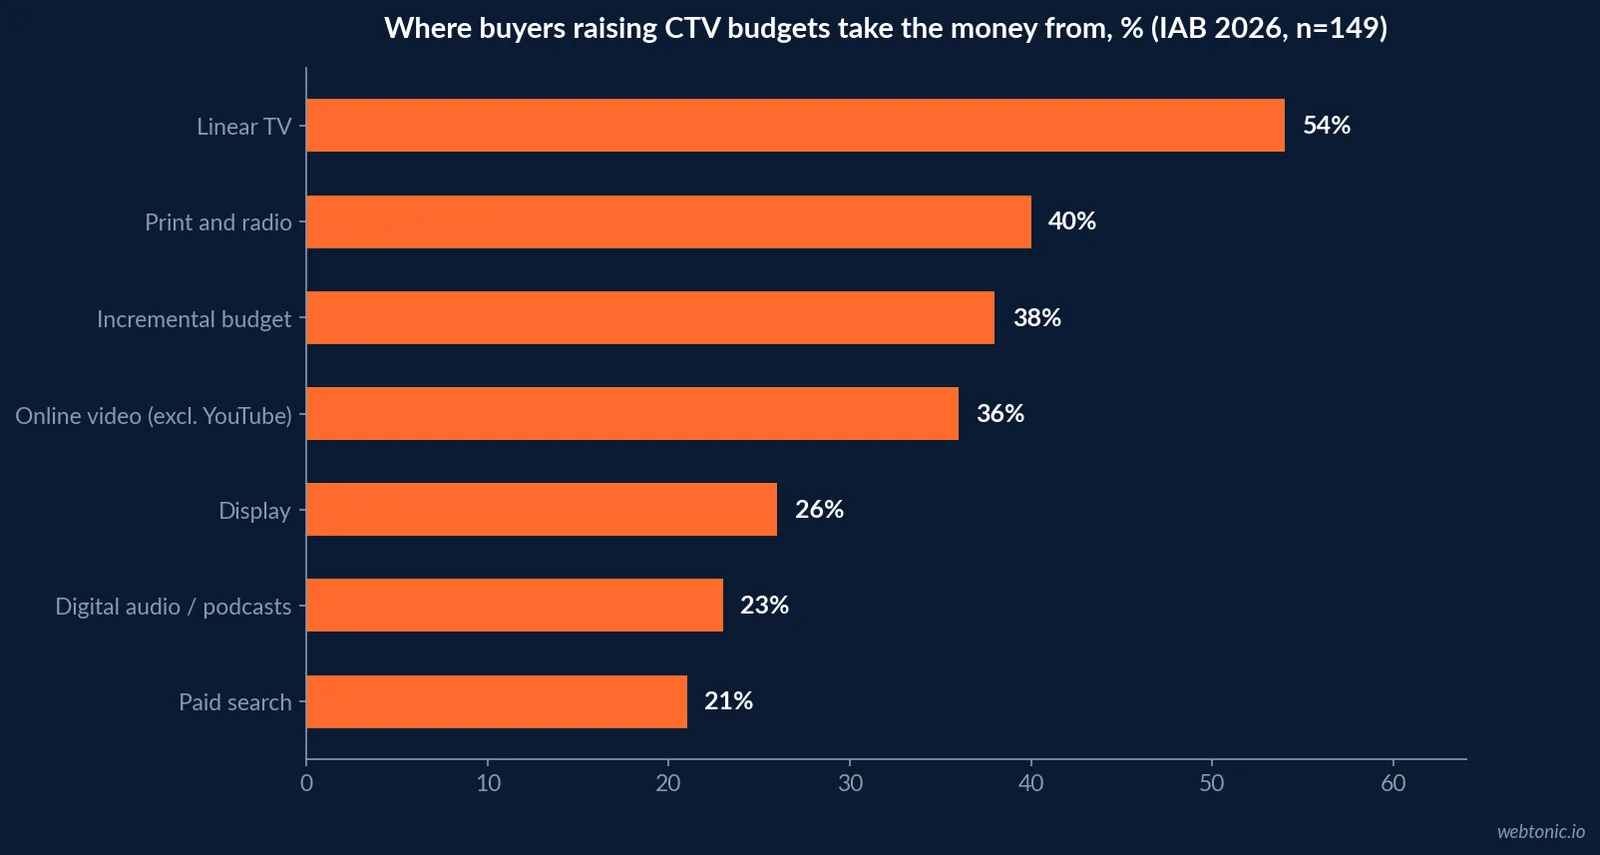
- 54% of buyers raising CTV spend fund it from linear TV.
- Tatari client data put streaming CPMs near USD 9.50 against USD 2.50 for linear.
- 88% of US households use air conditioning (EIA, 2020 survey).
- AC and heat pump shipments fell 20% in 2025 to 7.75 million (AHRI via ACHR News).
Linear versus streaming at a glance
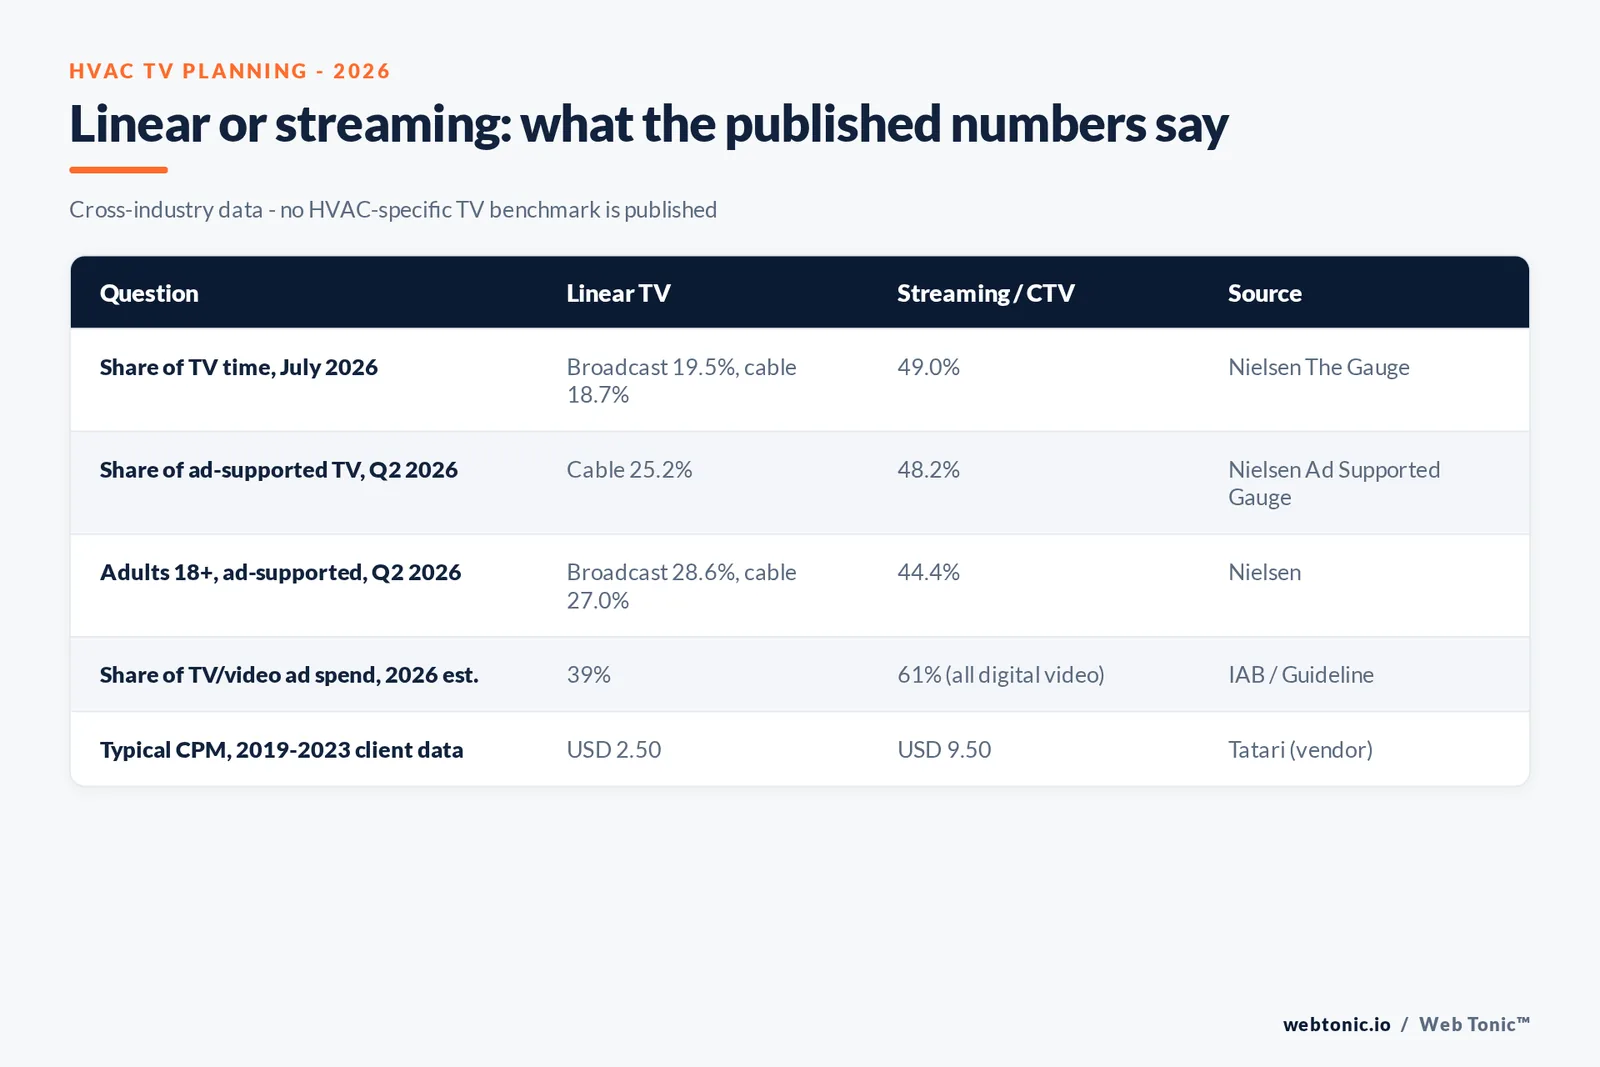
Each row pairs a linear figure with its streaming counterpart from the same source and period. None of the rows is specific to HVAC; they describe the TV market an HVAC advertiser buys into.
| Metric | Linear TV | Streaming / CTV | Source and period |
|---|---|---|---|
| Share of total TV time | Broadcast 19.5%, cable 18.7% | 49.0% | Nielsen The Gauge, July 2026 |
| Share of ad-supported TV, all persons | Cable 25.2% | 48.2% | Nielsen Ad Supported Gauge, Q2 2026 |
| Share of ad-supported TV, adults 18+ | Broadcast 28.6%, cable 27.0% | 44.4% | Nielsen, Q2 2026 |
| Share of TV/video ad spend | 39% | 61% (all digital video) | IAB / Guideline, 2026 estimate |
| Typical CPM | USD 2.50 | USD 9.50 | Tatari client data, 2019-2023 |
Viewing: streaming now leads total TV time
Nielsen's July 2026 Gauge put streaming at 49.0% of total TV usage, up 0.5 points, with streaming usage up 3.4% on June and YouTube at a record 14.2%. Broadcast finished at 19.5% and cable at 18.7%, even with the final weeks of the World Cup on air.
For an HVAC firm, July is the cooling-emergency month, and it is also the month streaming usually peaks. The two linear categories together still held 38.2% of viewing, which is why the split matters more than the headline.
Ad-supported viewing: the audience you can actually buy
Total TV time includes ad-free streaming. Nielsen's Q2 2026 Ad Supported Gauge narrows it: ad-supported TV was 71.5% of total viewing, streaming took 48.2% of that ad-supported time (up 1.6 points) and cable 25.2%. Among adults 18 and older, streaming falls to 44.4% while broadcast rises to 28.6% and cable to 27.0%.
HVAC decisions are made by adult homeowners, so the 18+ view is the more relevant one. On that measure linear still carries a majority of ad-supported time, a point often lost in streaming headlines.
| Ad-supported TV, Q2 2026 (Nielsen) | All persons 2+ | Adults 18+ |
|---|---|---|
| Streaming | 48.2% | 44.4% |
| Broadcast | Not stated in release | 28.6% |
| Cable | 25.2% | 27.0% |
| Ad-supported share of all TV | 71.5% | Not stated |
| Linear combined (broadcast + cable) | Not stated | 55.6% |
Spring versus peak summer: the split by month
HVAC demand swings between tune-up season and cooling emergencies, so it helps to see the linear-streaming split at two points in the year. Nielsen's May 2026 Gauge put streaming at 48.6%, broadcast at 19.2% and cable at 20.4%. By July, streaming was 49.0%, broadcast 19.5% and cable 18.7%, with live sports explaining much of the broadcast movement.
The shift between the two months is small. For planning, the takeaway is stability: the linear share an HVAC firm reaches in spring is close to what it reaches in July, so seasonal budget changes should follow demand, not a belief that the audience migrates wholesale in summer.
| Nielsen Gauge month | Streaming | Broadcast | Cable |
|---|---|---|---|
| May 2026 | 48.6% | 19.2% | 20.4% |
| July 2026 | 49.0% | 19.5% | 18.7% |
| Change, May to July | +0.4 pts | +0.3 pts | -1.7 pts |
Spend: the budget crossed over before the audience did
The 2026 IAB Digital Video Ad Spend and Strategy report, using Guideline estimates, shows linear TV's share of US TV/video ad spend falling from 62% in 2021 to 49% in 2024, 42% in 2025 and an estimated 39% in 2026. Digital video passes 60% of the total for the first time. The IAB's May 2026 release projects digital video above USD 80 billion, with CTV growing 11%.
| Year | Linear TV share | Digital video share |
|---|---|---|
| 2021 | 62% | 38% |
| 2022 | 58% | 42% |
| 2023 | 52% | 48% |
| 2024 | 49% | 51% |
| 2025 | 42% | 58% |
| 2026 estimate | 39% | 61% |
Where the CTV money comes from
The same IAB report asked buyers who are increasing CTV spend how they will fund it (base 149). 54% named linear TV, 40% print and radio, 38% incremental budget, 36% online video excluding YouTube, 26% display, 23% digital audio and podcasts and 21% paid search. Respondents could name several sources.
This is the clearest published evidence of linear-to-streaming substitution. It describes national ad buyers, not HVAC contractors, but local trades that already run broadcast spots face the same trade-off.
Price: CPMs on each side
Tatari, a TV buying vendor, analysed its client data from 2019 to 2023 and found streaming CPMs typically three to four times linear: about USD 9.50 against USD 2.50. Its streaming rates are already well below market thanks to direct publisher deals, often 66% lower than programmatic. Tatari's 2025 planning guide adds that the average streaming CPM for a 30-second spot fell 16.7% in 2024.
The price gap is real, but it compares a broadcast impression reaching everyone in a market with a streaming impression that can be limited to owner-occupied homes in a service area.
The HVAC demand base behind any TV plan
EIA's 2020 Residential Energy Consumption Survey found 88% of US households use air conditioning and two-thirds rely on central AC or a heat pump. Use is highest in the South (93%) and Midwest (92%) and lowest in the West (73%). On the equipment side, ACHR News, reporting AHRI data, shows combined AC and heat pump shipments of 7.75 million in 2025, down 20% from 9.68 million; AC alone fell 26.2% and heat pumps 11.6%.
Two cautions apply. The EIA figure is from a 2020 survey, the most recent edition published, and shipment totals describe manufacturers' output rather than homeowner purchases in a given month. Even so, together they show why HVAC sits among the trades with near-universal household demand, which is the condition under which broad TV reach, linear or streaming, is worth testing at all. The 2025 shipment drop is a reminder that a TV budget set in a strong equipment year may need to be re-sized when the replacement cycle slows.
| HVAC demand indicator | Figure | Source |
|---|---|---|
| US households using air conditioning | 88% | EIA RECS 2020 |
| AC use, South / Midwest / West | 93% / 92% / 73% | EIA RECS 2020 |
| AC and heat pump shipments, 2025 | 7.75 million (down 20%) | AHRI via ACHR News |
| AC-only shipments, 2025 | 4.10 million (down 26.2%) | AHRI via ACHR News |
| Heat pump shipments, 2025 | 3.64 million (down 11.6%) | AHRI via ACHR News |
| Americans under heat alerts, July 2026 heat dome | More than 200 million | ACCA |
Weather spikes and the case for flexible buying
In July 2026 ACCA reported more than 200 million Americans under heat alerts during a heat dome, with heat indices of 105-115°F. Demand arrives in bursts like this, and linear schedules are usually booked ahead. Self-serve streaming can be switched on within days: Roku's Ads Manager needs only a USD 500 lifetime budget per campaign and bills on delivery.
That flexibility is a mechanical advantage, not a proven HVAC result. Whether a heat-wave flight pays back still has to be measured against calls and bookings in exposed areas.
What each side can target for a service area
The metrics above compare audiences and prices, but the operational difference for an HVAC company is targeting. The IAB's 2026 buyer survey found targeting overtook content quality as the top criterion for TV and video buys, up 10 points year on year, with small and mid-size spenders driving the shift by 23 points. The table summarises how the two sides differ in mechanics, without assigning any invented performance figure to either.
| Planning need | Linear TV | Streaming / CTV |
|---|---|---|
| Geography | Designated market area or cable zone | Down to ZIP code or household list, platform-dependent |
| Audience | Programme and daypart demographics | Household data segments such as homeowners |
| Booking lead time | Usually scheduled ahead | Self-serve launch within days |
| Minimum entry | Set by each station or rep | Roku USD 500 lifetime budget |
| Verification | Broadcast ratings measurement | Ad-server logs plus invalid-traffic filtering |
Traffic quality on the streaming side
Linear spots are verified by broadcast measurement; programmatic streaming has a fraud question. Pixalate's Q3 2025 North America benchmarks put invalid traffic at 18% of US open programmatic CTV. The figure is cross-industry and covers open programmatic supply only, but it belongs in any linear-versus-streaming cost comparison: a cheaper effective CPM on paper can shrink once invalid impressions are removed.
A split-budget approach the data supports
- Keep linear where adult reach is the goal: broadcast and cable hold 55.6% of adult ad-supported time.
- Add streaming for targeting: it holds 49.0% of all TV time and can be fenced to service ZIPs.
- Budget the price gap honestly: USD 9.50 versus USD 2.50 in one vendor's data.
- Filter streaming supply: 18% invalid on US open programmatic CTV in Q3 2025.
- Measure calls and bookings by area, not completion rate.
Our data intelligence team sets up area-level measurement, and our performance creative team produces spots that run on both. See the connected TV advertising statistics hub, the wider streaming media statistics and our HVAC SMS marketing statistics for follow-up after a TV-driven call.
Frequently Asked Questions
Should an HVAC company buy linear TV or connected TV?
The published data does not pick a winner for HVAC, because no dataset measures HVAC TV results. What it shows is the audience split: in July 2026 streaming held 49.0% of US TV time against 19.5% for broadcast and 18.7% for cable (Nielsen). Among adults 18 and older in ad-supported TV, broadcast and cable together still reach 55.6% of Q2 2026 viewing. Many HVAC plans therefore keep some linear and add streaming rather than switching outright.
Is linear TV cheaper than streaming for HVAC ads?
Per impression, usually yes. Tatari's client data from 2019 to 2023 put streaming CPMs at about USD 9.50 against USD 2.50 for linear. That is one vendor's direct-buy data across its clients, not an HVAC rate, and streaming can be restricted to specific households and ZIP codes, which linear cannot.
Where are advertisers finding money for more CTV?
In the IAB's 2026 video report, 54% of buyers increasing CTV spend said they would fund it from linear TV, 40% from print and radio and 38% from incremental budget (base: 149 buyers raising CTV spend).
Does HVAC demand justify TV at all?
The demand base is broad: EIA's 2020 Residential Energy Consumption Survey found 88% of US households use air conditioning, and two-thirds use central AC or a heat pump as their main equipment. Equipment shipments are cyclical, though: AHRI data reported by ACHR News show AC and heat pump shipments down 20% in 2025 to 7.75 million.
What is the minimum budget for HVAC streaming TV?
Roku Ads Manager requires a lifetime budget of at least USD 500 per campaign. That is the platform's floor, not a recommended HVAC spend; delivered cost depends on geography, season and competition.
Sources
Nielsen - The Gauge, July 2026
Nielsen - Q2 2026 Ad Supported Gauge
IAB - 2026 Digital Video Ad Spend and Strategy full report
IAB - US digital video ad spend to surpass USD 80B in 2026
Tatari - What is driving down linear CPMs
Tatari - How to budget and plan for TV in 2025
EIA - Nearly 90% of US households used air conditioning (RECS 2020)
ACHR News - Heat pump and AC shipments down 20% in 2025 (AHRI data)
ACCA - Heat dome release, July 2026
Pixalate - Q3 2025 North America IVT benchmarks
Roku Ads Manager - campaign budget and schedule


